

Abstract
The growing use of nanoparticles in biomedical applications, including cancer diagnosis and treatment, demands the capability to exactly locate them within complex biological systems. In this work a correlative optical and scanning electron microscopy technique was developed to locate and observe multi-modal gold core nanoparticle accumulation in brain tumor models. Entire brain sections from mice containing orthotopic brain tumors injected intravenously with nanoparticles were imaged using both optical microscopy to identify the brain tumor, and scanning electron microscopy to identify the individual nanoparticles. Gold-based nanoparticles were readily identified in the scanning electron microscope using backscattered electron imaging as bright spots against a darker background. This information was then correlated to determine the exact location of the nanoparticles within the brain tissue. The nanoparticles were located only in areas that contained tumor cells, and not in the surrounding healthy brain tissue. This correlative technique provides a powerful method to relate the macro- and micro-scale features visible in light microscopy with the nanoscale features resolvable in scanning electron microscopy.
Keywords: Scanning electron microscopy, Optical microscopy, Correlative microscopy, Cancer diagnosis, Nanotechnology
1. Introduction
The increasing use of nanoparticles in biomedical applications, such as cancer diagnosis and treatment (Devaraj et al. 2009; Ptak et al. 2010; Thakor et al 2011), joint repair(Ma et al. 2003) and drug delivery (Farokhzad and Langer 2009) has necessitated the ability to accurately and precisely locate them within complex biological systems. Scanning electron microscopy (SEM) is a powerful tool for characterizing the size, shape and structure of nanoparticles owing to its ability to resolve nanometer scale features (Roussel et al. 2009).
SEM has been successfully utilized to locate nanoparticles in cells and tissue through the use of backscattered electron imaging (BSE) to distinguish between the inorganic nanoparticles and the surrounding organic structure(Koh et al. 2008; Shachaf et al. 2009; Papis et al. 2009). Unfortunately, there is no mechanism to readily distinguish between tissue types, e.g. healthy and cancerous tissue, in the SEM due to a lack of contrast either in BSE or secondary electron (SE) modes.
Through the use of staining protocols(Presnell and Schreibman 1997) it is possible to discern biologically relevant differences in the structure of tissue sections, including the presence of a brain tumor, through optical microscopy (OM)(Kircher et al. 2012). Owing to the relatively low magnification utilized it is possible to image large areas in the microscope, including macroscopic features such as blood vessels. OM however has a spatial resolution of approximately 250 nm due to the wave length of visible light (Svitkina and Borisy 1998). Furthermore, OM has a limited depth of field at high magnifications. These limitations restrict conventional OM to the microscopic regime and make it impossible to locate and image nanoparticles.
By utilizing these two techniques in tandem and correlating the results it is possible to exploit the benefits of both while minimizing their respective disadvantages (Sartori et al. 2007; Svitkina and Borisy 1998). SEM offers evidence of nanoparticle accumulation and localization in the tissue, while OM provides biologically relevant information, such as the presence of tumor or healthy tissue. In the present work, we developed a correlative optical and scanning electron microscopy approach to locate triple modality nanoparticles (magnetic resonance imaging-photo acoustic imaging-Raman imaging (MPRs)) within brain tissue and to determine if they are located in healthy or tumor tissue.
2. Methods and Materials
2.1 Mouse and Tissue Preparation
Male severe combined immunodeficiency (SCID) mice implanted with an orthotopic primary human xenograft glioblastoma, TS543, were injected with MPRs via their tail vein (Kircher et al. 2012). All mice were treated following animal protocol (#06-07-011) approved by the Institutional Animal Care and Use Committee of Memorial Sloan Kettering Cancer Center on October 20th 2006. The MPRs consist of a 60 nm diameter gold core surrounded by a monolayer of the Raman tag trans-1,2-bis(4-pyridyl)-ethylene and encapsulated in a 30 nm silica shell. This was then coated with maleimide-DOTA-Gd3+ resulting in a gold-silica core-shell surface enhanced Raman scattering (SERS) nanoparticle covered with Gd3+ ions(Kircher et al. 2012). It was anticipated that the MPRs would enter the extra vascular space of the tumor via the enhanced permeability and retention (EPR) effect and as a result no targeting motif was needed for MPR uptake. 24 hours post injection the mice (n=2) were sacrificed and the brain excised (Kircher et al. 2012). The brain tissue was then embedded in Tissue-Tek® optimal cutting temperature (O.C.T.) compound (Sakura), and snap-frozen in liquid nitrogen(Kircher et al. 2012). Ten-micron thick sections of frozen tissue were obtained using a Leica cryotome and adjacent tissue sections, one each, were stained following the hematoxylin and eosin (H&E) histochemical and Olig2-specific (OLIG) immunohistochemical staining protocols to reveal the general structure of the tissue section and the exact location and extent of the tumor respectively (Kircher et al. 2012; Ligon et al. 2004; Presnell and Schreibman 1997). The OLIG stain was selected because the TS543 tumor model overexpresses the Olig2 transcription factor. H&E stained tissue sections were prepared without a cover slip contrary to standard protocols because SEM is a surface sensitive technique and the cover slip would inhibit the ability to image the nanoparticles.
2.2 Optical microscopy Imaging of Tissue Samples
The OLIG stained sections were imaged using a Leica TCS SP2 AOBS Confocal Laser Scanning Microscope or a Leica DMI6000 inverted fluorescence microscope.
H&E stained tissue sections were imaged using a DM Leica 2000 light microscope at 100x magnification. Between 50 and 100 images were acquired from each tissue section and stitched together by hand using Adobe Photoshop to create a large composite image of the entire brain section. Images were taken with partial overlap to provide regions to align each image with its respective neighbor images.
2.3 Scanning Electron Microscopy Imaging of Tissue Samples
After imaging the H&E stained tissue sections in the optical microscope, the sections were then sputter coated with a thin layer of AuPd using a Cressington 108 Sputter Coater for 30 seconds with a current of 20 mA to provide a conductive surface layer.
The samples were then imaged using a Magellan XHR SEM operated at 15 kV with a probe current of 50 pA and spatial resolution of 1 nm in secondary electron (SE) mode. In BSE mode, the resolution is slightly worse at approximately 5 nm due to decreased signal intensity and in-sample electron scattering. A low magnification montage image was created of the entire brain section using the automated montage stitching program embedded in the SEM software. Two-hundred and twenty-five (225) low magnification (i.e. 200 times magnification) images each with a 1 mm field of view were taken and stitched together creating the montage image with a 14.9 mm field of view. The tissue was then examined at 5000x magnification using the BSE detector to locate the higher atomic number MPRs in the tissue. The MPRs appear as bright spots in the image due to their gold core. This magnification was selected to maximize the analysis efficiency by covering the largest possible area while still being able to resolve individual MPRs.
The beam conditions were optimized to maximize the BSE signal while minimizing charging and false positives. An accelerating voltage of 15 kV was selected to provide enough energy for the primary beam to penetrate through the silica shell and interact directly with the gold core while a low beam current of 50 pA was chosen to minimize the risk of charging. The dwell time was set to 10 µs per pixel while the contrast and brightness settings on the BSE detector were set so that the background tissue appeared black in the image while the individual MPRs oversaturated the detector, making them easy to identify. Through this method any stray salt crystals or surface features would not appear bright and the chance of a false positive was diminished.
When MPRs were located using the BSE detector, the exact location of the nanoparticles was recorded on the montage image created previously. The magnification was then increased until the MPRs in question filled the screen and secondary electron, back scattered electron, and 50:50 mixed signal images were acquired. Through this process the entire brain section was imaged for the presence of MPRs.
2.4 Optical Microscopy / Scanning Electron Microscope Correlation
The montage image created in the SEM with the MPR locations embedded in it was overlaid manually, utilizing macroscopic tissue features, on the large composite OM image created from the same tissue section. This was accomplished by locating three distinct points on each image and matching them together. Utilizing this overlaid image the exact locations of the MPRs in the tissue were determined. This information was then correlated with the adjacent OLIG stained tissue section to identify the exact location of the MPRs with respect to the tumor and its peripheries. Because the tissue sections were only 10 µm thick, less than the diameter of most cells, it can be expected that the tissue structures from one section to the next would remain largely unchanged, with tumor peripheries remaining largely in the same place. As a result, the locations of the MPRs obtained from the H&E sections were translated to the OLIG stained sections to reliably identify their exact position with respect to the tumor.
3. Results
A composite OM image of an entire H&E stained brain tissue section is shown in figure 1 revealing the overall structure of the brain tissue including the cerebral cortex, cerebellum and brain stem. The figure also shows that a few sections of the tissue were not preserved during sample preparation. The OLIG stained section shown in figure 2, prepared from a section immediately adjacent to the H&E stained section, indicates the presence of the TS543 glioblastoma in the tissue. The slightly darker section of tissue in the image outlined in black corresponds to the tumor (Kircher et al. 2012). By overlaying figures 1 and 2 it becomes apparent that the glioblastoma is located in the vicinity of the missing tissue in figure 1.
Figure 1.

Optical microscopy image of H&E stained brain tissue section showing the Cerebral cortex, the two large lobes at the bottom and top right of the figure; the cerebellum, the two smaller lobes to the left of each of the larger lobes; and the brain stem, the large area on the top left of the image between the lobes of the cerebellum. Positions 1-3 correspond to locations in which MPRs were located in the SEM. Positions 4-5 correspond to positions where no MPRs were located. Note that the MPRs were located in regions surrounding a section of missing tissue. Scale = 2.5 mm
Figure 2.

Image of serial brain tissue section stained with anti-Olig2 immunohistochemisty showing the brain tumor marked by the black line as a darker brown than the surrounding tissue . Inset shows region where tumor was located and where MPRs were located indicating that the nanoparticles were located within the tumor. Note that this tumor region corresponds with the region of missing tissue surrounded by positions 1-3 in figure 1. Positions 1-3 are located within the peripheries of the tumor whereas positions 4 and 5 are located well outside the tumor region. Scale = 2.5 and 1 mm respectively
MPRs were successfully located in the H&E stained brain tissue section using the SEM, appearing as bright spots against a dark background in the BSE image shown in figure 3(A). The SE image taken from the same location, figure 3(B) does not clearly show the MPRs because they are located within the tissue section and not on the surface. BSE’s have energies very close to that of the primary beam, allowing them to escape from deep within the sample whereas SE’s have very low energy, 10–100 eV, meaning they can only escape from near the surface. Mixed signal BSE and SE images, figure 4, reveal both atomic and surface sensitive information about the sample.
Figure 3.

(A) Backscattered electron and (B) secondary electron images of MPRs located in brain tissue. Note that the MPRs appear as bright regions in the BSE image and are not individually visible in the SE image. Scale = 500 nm
Figure 4.

Mixed backscattered electron and secondary electron image composed from the images in figure 3. Note that both the surface topography from the SE image and the atomic number sensitivity from the BSE image are preserved in this mixed signal image. Scale = 500 nm
The location of each group of MPRs was recorded onto the large SE montage image with five representative positions shown in figure 5. Positions 4 and 5 represent regions of the tissue where no MPRs were located as demonstrated in figure 6. Positions 1-3 correspond to the locations of MPR clusters within the tissue section as shown in figure 7. The nanoparticles were generally located in clusters in the tissue as evidenced by the large size and irregular intensity levels of the bright regions in these images. These clusters varied greatly in population from 1- 2 nanoparticles up to well over 100 nanoparticles per cluster, as has been observed in prior nanoparticle bio-imaging studies(Kempen et al. 2013; Koh et al. 2008).
Figure 5.

SEM secondary electron montage image of brain tissue section with positions 4 and 5 corresponding to regions without MPRs and positions 1-3 corresponding to regions of tissue where MPRs were located. Note that the MPRs were located in regions surrounding a section of missing tissue. Scale = 2.5 mm
Figure 6.

50:50 mixed back scattered: secondary electron images from positions 4 and 5 of figure 5 respectively showing no MPRs located in the healthy brain tissue surrounding the tumor. Scale = 1 µm
Figure 7.
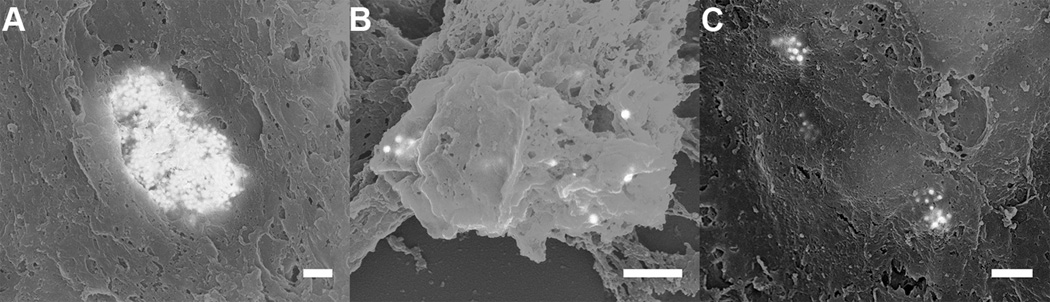
(A-C) 50:50 mixed back scattered: secondary electron images from regions 1 through 3, respectively, showing the accumulation of MPRs in the periphery of the tumor. Note that the MPRs do not appear crisp in the images. This occurs because the MPRs are not located at the surface and as a result both the incident electron probe and the backscattered electrons are scattered as they enter and exit the tissue respectively. Scale = 500 nm
After SEM analysis the montage image was overlaid onto the H&E image as shown in figure 8. The location of the MPRs was then transposed onto the H&E composite image and finally onto the OLIG image. Figure 9 provides a concise visualization of the relations between the OM and the SEM images from one of the two brain sections analyzed in this work.
Figure 8.

Partial overlay of the SEM secondary electron montage image from figure 5 over the optical microscopy image of the H&E stained brain tissue from figure 1 enabling the localization of the MPRs on the optical microscopy image. Scale = 2.5 mm
Figure 9.

Micrograph map showing the location of each SEM micrograph. Positions 1 through 3 correspond to the locations of MPRs while positions 4 and 5 correspond to locations without MPRs. Scale = 2.5 mm for tissue section. Scale = 500 nm for each micrograph.
4. Discussion
Positions 1-3 from figures 1 and 9 with MPRs present correspond to regions of brain tumor identified from the Olig2 stained adjacent tissue section shown in figure 2. MPRs were not located outside of the tumor region as demonstrated by the representative positions 4 and 5. This demonstrates that the MPRs accumulate in the brain tumor as expected and not in the healthy brain tissue indicating that they are not passing through the uncompromised blood brain barrier (Kircher et al. 2012; Smith et al. 2012). This was further corroborated in kircher et al. (2012), using the STEM protocol we previously developed to analyze large volumes of tissue for nanoparticles (Kempen et al. 2013). These results however are limited due to the small sample set (n=2) and should not be considered statistically significant.
MPRs were quickly and easily identified in the tissue section through the use of the BSE detector in the SEM, figure 3(A). Individual 60 nm gold cores can clearly be identified and distinguished in both the BSE and mixed signal images, figures 3, 4 and 7. Some of the MPRs appear diffuse indicating that they are located beneath the surface of the tissue. Even at lower magnification, 5000x, the MPRs can be readily observed due in large part to the microscope calibrations described in the methods section above. This allows for faster and more efficient analysis of the large, approximately 100 mm2,brain section. By mapping the MPR locations to the montage image and eventually to the OLIG section it was possible to pinpoint the location of these nanoparticles within 10 µm and relate this with detailed biologically relevant information e.g. the location of the tumor.
There are a number of other correlative OM/SEM techniques that offer spatial resolutions of 1 µm or better (Harrison et al. 2012; Murphy et al. 2011). These techniques however are only applicable to relatively small samples, less than 1 mm across. New slice and view SEM techniques have also been developed utilizing built in microtomes to obtain high resolution 3D information about a sample, but again they are limited to samples no larger than 1 mm3 and generally much smaller(Denk et al. 2004).
The technique described here provides a method to examine very large tissue samples for the presence of inorganic MPRs by combining the nm resolution of SEM, necessary to locate the MPRs, with the large field of view and biological specificity of OM. The use of BSE imaging to locate the nanoparticles allows for the straightforward identification MPRs in the tissue, while the use of low magnification OM allows for the analysis of very large tissue sections such as an entire brain section.
5. Conclusions
Correlative optical microscopy (OM) and scanning electron microscopy (SEM) analysis of tissue samples for the accumulation of nanoparticles is a powerful approach to locate triple-modality magnetic resonance imaging-photoacoustic imaging-Raman imaging nanoparticles (MPRs) and determine their exact location with respect to biologically relevant tissue structures e.g. the tumor. OM provides detailed biologically relevant information about the sample through the use of standard staining protocols while SEM provides high-resolution analysis of tissue for the presence of nanoparticles. This technique provides a method to analyze large tissue samples for the presence of MPRs while also providing biologically relevant information about the tissue.
Acknowledgements
We thank Pauline Chu and Professor Donna Bouley from the Department of Comparative Medicine at Stanford University for their support in preparing tissue samples for OM and SEM analysis and assistance analyzing the OM results. Dr. Ruimin Huang from Memorial Sloan Kettering Cancer Center assisted in locating the tumors in Olig2-specific stained tissue sections. We also thank Richard Chin at the Stanford Nanocharacterization Laboratory (SNL) at Stanford University for providing support and insight in analyzing the samples using SEM within the SNL. The work was supported by NCI Center for Cancer Nanotechnology Excellence Grants CCNE U54 CA119367 (S.S.G.), CCNE U54 U54CA151459 (S.S.G.). The work was also partially supported under a Stanford Graduate Fellowship, NIH K08 CA163961 (M.F.K.), and RSNA Research Scholar Grant #2380 (M.F.K.). We acknowledge the support of the MSKCC Molecular Cytology Core (P30 CA008748).
References
- Denk W, Horstmann H. Serial Block-Face Scanning Electron Microscopy to Reconstruct Three-Dimensional Tissue Nanostructure. PloS. 2004;2:e329. doi: 10.1371/journal.pbio.0020329. [DOI] [PMC free article] [PubMed] [Google Scholar]
- Devaraj NK, Keliher EJ, Thurber GM, Nahrendorf M, Weissleder R. 18F labeled nanoparticles for in vivo PET-CT imaging. Bioconjugate chemistry. 2009;20:397–401. doi: 10.1021/bc8004649. [DOI] [PMC free article] [PubMed] [Google Scholar]
- Farokhzad OC, Langer R. Impact of Nanotechnology on Drug Delivery. ACS Nano. 2009;3:16–20. doi: 10.1021/nn900002m. [DOI] [PubMed] [Google Scholar]
- Harrison CJ, Jack EM, Allen TD. Light and Scanning Electron Microscopy of the Same Metaphase Chromosomes. In: Hayat MA, editor. Correlative Microscopy in Biology: Instrmentation and Methods. Elsevier; 2012. pp. 190–249. [Google Scholar]
- Kempen PJ, Thakor AS, Zavaleta C, Gambhir SS, Sinclair R. A Scanning Transmission Electron Microscopy Approach to Analyzing Large Volumes of Tissue to Detect Nanoparticles. Microscopy and Microanalysis. 2013;19:1290–1297. doi: 10.1017/S143192761300192X. [DOI] [PMC free article] [PubMed] [Google Scholar]
- Kircher MF, de la Zerda A, Jokerst JV, Zavaleta CL, Kempen PJ, Mittra E, Pitter K, Huang R, Campos C, Habte F, Sinclair R, Brennan CW, Mellinghoff IK, Holland EC, Gambhir SS. A brain tumor molecular imaging strategy using a new triple-modality MRI-photoacoustic-Raman nanoparticle. Nat Med. 2012;18:829–834. doi: 10.1038/nm.2721. [DOI] [PMC free article] [PubMed] [Google Scholar]
- Koh AL, Shachaf CM, Elchuri S, Nolan GP, Sinclair R. Electron microscopy localization and characterization of functionalized composite organic-inorganic SERS nanoparticles on leukemia cells. Ultramicroscopy. 2008;109:111–121. doi: 10.1016/j.ultramic.2008.09.004. [DOI] [PMC free article] [PubMed] [Google Scholar]
- Ligon KL, Alberta JA, Kho AT, Weiss J, Kwaan MR, Nutt CL, Louis DN, Stiles CD, Rowitch DH. The Oligodendroglial Lineage Marker OLIG2 is Universally Expressed in Diffuse Gliomas. J Neuropathology & Experimental Neurology. 2004;63:499–509. doi: 10.1093/jnen/63.5.499. [DOI] [PubMed] [Google Scholar]
- Ma J, Huifen W, Kong LB, Peng KW. Biomimetic processing of nanocrystallite bioactive apatite coating on titanium. Nanotechnology. 2003;14:619. [Google Scholar]
- Murphy GE, Narayan K, Lowekamp BC, Hartnell LM, Heymann JAw, Fu J, Subramaniam S. Correlative 3D Imaging of Whole Mammalian Cells with Light and Electron Microscopy. Journal of Structural Biology. 2011;3:268–278. doi: 10.1016/j.jsb.2011.08.013. [DOI] [PMC free article] [PubMed] [Google Scholar]
- Papis E, Rossi F, Raspanti M, Dalle-Donne I, Colombo G, Milzani A, Bernardini G, Gornati R. Engineered cobalt oxide nanoparticles readily enter cells. Toxicology letters. 2009;189:253–259. doi: 10.1016/j.toxlet.2009.06.851. [DOI] [PubMed] [Google Scholar]
- Presnell JK, Schreibman MP. Humason's animal tissue techniques. 5th ed. Johns Hopkins University Press; Baltimore, MD: 1997. [Google Scholar]
- Ptak K, Farrell D, Panaro NJ, Grodzinski P, Barker AD. The NCI Alliance for Nanotechnology in Cancer: achievement and path forward. Wiley Interdisciplinary Reviews: Nanomedicine and Nanobiotechnology. 2010;2:450–460. doi: 10.1002/wnan.98. [DOI] [PubMed] [Google Scholar]
- Roussel LY, Stokes DJ, Gestmann I, Darus M, Young RJ. Extreme high resolution scanning electron microscopy (XHR SEM) and beyond. Proc SPIE. 2009;7378:73780W. [Google Scholar]
- Sartori A, Gatz R, Beck F, Rigort A, Baumeister W, Plitzko JM. Correlative microscopy: Bridging the gap between fluorescence light microscopy and cryo-electron tomography. Journal of Structural Biology. 2007;160:135–145. doi: 10.1016/j.jsb.2007.07.011. [DOI] [PubMed] [Google Scholar]
- Shachaf CM, Elchuri SV, Koh AL, Zhu J, Nguyen LN, Mitchell DJ, Zhang J, Swartz KB, Sun L, Chan S, Sinclair R, Nolan GP. A Novel Method for Detection of Phosphorylation in Single Cells by Surface Enhanced Raman Scattering (SERS) using Composite Organic-Inorganic Nanoparticles (COINs) PLoS ONE. 2009;4:e5206. doi: 10.1371/journal.pone.0005206. [DOI] [PMC free article] [PubMed] [Google Scholar]
- Smith BR, Kempen P, Bouley D, Xu A, Liu Z, Melosh N, Dai H, Sinclair R, Gambhir SS. Shape matters: intravital microscopy reveals surprising geometrical dependence for nanoparticles in tumor models of extravasation. Nano Letters. 2012;12:3369–3377. doi: 10.1021/nl204175t. [DOI] [PMC free article] [PubMed] [Google Scholar]
- Svitkina TM, Borisy GG. In: Correlative light and electron microscopy of the cytoskeleton of cultured cells. Richard BV, editor. Methods in Enzymology, Academic Press; 1998. pp. 570–592. [DOI] [PubMed] [Google Scholar]
- Thakor AS, Luong R, Paulmurugan R, Lin FI, Kempen P, Zavaleta C, Chu P, Massoud TF, Sinclair R, Gambhir SS. The fate and toxicity of Raman-active silica-gold nanoparticles in mice. Sci. Transl. Med. 2011;3:79ra33. doi: 10.1126/scitranslmed.3001963. [DOI] [PMC free article] [PubMed] [Google Scholar]