

Abstract
The purpose of this study was to identify genes that associated with higher ability of metastasis and chemotherapic resistance in epithelial ovarian carcinoma (EOC) cells. An oligonucleotide microarray with probe sets complementary to 41,000+ unique human genes and transcripts was used to determine whether gene expression profile may differentiate three epithelial ovarian cell lines (RMG-I-C, COC1 and HO8910) from their sub-lines (RMG-I-H, COCI/DDP and HO8910/PM) with higher ability of metastasis and chemotherapic resistance. Quantitative real-time PCR and immunohistochemical staining validated the microarray results. Hierarchic cluster analysis of gene expression identified 49 genes that exhibited ≥2.0-fold change and P value ≤0.05. Highly differential expression of GCET2, NLRP4, FOXP1 and SNX29 genes was validated by quantitative PCR in all cell line samples. Finally, FOXP1 was validated at the protein level by immunohistochemistry in paraffin embedded ovarian tissues (i.e., for metastasis, 15 primary EOC and 10 omental metastasis [OM]; for chemoresistance, 13 sensitive and 13 resistant EOC). The identification of higher ability of metastasis and chemotherapic resistance-associated genes may provide a foundation for the development of new type-specific diagnostic strategies and treatment for metastasis and chemotherapic resistance in epithelial ovarian cancer.
Keywords: Gene expression profile, Metastasis-associated gene, Chemoresistance-associated genes, Microarray, Epithelial ovarian carcinoma, FOXP1
Introduction
Epithelial ovarian cancers (EOC) are high aggressive tumors associated with high mortality and morbidity in gynecology. Although the 5-year survival rate is 90 % for women with early-stage ovarian cancer and postoperative introduction of paclitaxel drug have improved the 5-year survival rate for advanced-stage ovarian cancer, patients with this cancer have a 5-year survival rate of only 30 % [1]. Standard therapy includes cytoreductive surgery with first-line combination chemotherapy, 75 % of patients initially respond to conventional chemotherapy; however, 80 % of these women eventually relapse and die from chemotherapy resistant disease. Thus, to understand the molecular basis of epithelial ovarian cancer metastasis and chemotherapeutic resistance is of vital importance and may have the potential to improve significantly the development of more specific and effective treatment against EOC. Comprehensive, high-throughput technologies such as gene expression microarrays have provided powerful tools for this purpose.
In the present study, the whole human genome oligo microarray was used to investigate the differential expression genes (DEGs) in the human ovary cancer cell lines RMG-1-C, COC1, HO8910 and their high malignant and chemoresistant sub-cell lines RMG-I-H, COC1/DDP and HO8910/PM. Hierarchical clustering of genes by the expression level of the DEGs was performed. The potential functions of the DEGs were analyzed by Gene Ontology (GO) and pathway enrichment analyses. In addition, the interaction relationships between these DEGs were investigated by regulatory network. We hope these metastasis and chemotherapy resistance-associated genes may be used for early detection of epithelial ovarian cancer and for development of more specific chemotherapy drugs against EOC.
Materials and methods
Cell culture
The human ovarian cancer cell strain RMG-1 was the courtesy of Doctor Iwamori Masao of Kinki University in Japan. We transfected the gene of extrinsic α1,2-fucosyl transferase (α1,2-FT) into RMG-1 to create cell line RMG-1-H with high expression of Lewis (y) and α1,2-fucosyl transferase [2, 3], and we discovered that compared with the empty plasmid vector transfected cell line RMG-1-C, cell line RMG-1-H showed enhanced cellular malignant biological behaviors, such as enhanced metastasis and proliferation [4], adhesion [5] and multiple drug resistance [6].
Human ovarian cancer cell lines HO-8910 and HO-8910 PM (a highly metastatic cell line derived from HO-8910) were purchased from the Cell Bank of Type Culture Collection of the Chinese Academy of Sciences (Shanghai, China) [7], human ovarian cancer cell lines COC1 and COC1/DDP (a platinum resistance cell line derived from COC1) were purchased from the China Center for Type Culture Collection (Wuhan, China). Cells were cultured in RPMI-1640 medium supplemented with 100 units/mL penicillin/streptomycin and 10 % fetal bovine serum (FBS) and maintained in an incubator at 37 °C under a humidified atmosphere of 5 % CO2. COC1/DDP cells were cultured in RPMI-1640 medium containing 0.5 µg/mL cisplatin (Sigma, St. Louis, MO, USA) to maintain the drug resistant phenotype. The cell lines and labels in this experiment are listed in Table 1.
Table 1.
Cell line samples description
| Label | A | B | C | 1 | 2 | 3 |
|---|---|---|---|---|---|---|
| Cell line | RMG-I-H | COC1/DDP | HO8910/PM | RMG-I-C | COC1 | HO8910 |
Total RNA extraction and gene chip hybridization
Total RNA was extracted from all 6 cell line samples with TRIZOL reagent (Life Technologies, Inc, Carlsbad, CA) and further purified with RNeasy Min-elute Clean-up Columns (Qiagen, Valencia, CA), as described by the manufacturers. Optical density for each sample of RNA was measured at OD 260 nm and OD 280 nm using NanoDrop ND-1000 (NanoDrop Technologies, Wilmington, DE, USA). All RNA samples isolated OD260/280 ratio should be close to 2.0 for pure RNA (ratios between 1.8 and 2.1 are acceptable). The OD A260/A230 ratio should be more than 1.8. Each isolated RNA sample was subjected to further quality check to ensure integrity of RNA with Agilent RNA 6000 Nano LabChip using Agilent 2100 Bioanalyzer (Agilent Technologies, Santa Clara, CA, USA). All RNA samples were verified to be intact with distinct 28S and 18S RNA bands at a ratio of approximately 2:1 and a RNA integrity number (RIN) > 7.
The samples were amplified and labeled using the Agilent Quick Amp labeling kit and hybridized with Agilent whole genome oligo microarray in Agilent’s SureHyb Hybridization Chambers in accordance with the manufacturer’s instructions. This array contains 41,000+ unique human genes and transcripts represented, all with public domain annotations, content sourced from RefSeq, Goldenpath Ensembl Unigene Human Genome (Build 33) and GenBank databases, over 70 % of the represented probes are validated by Agilent’s laboratory validation process, 4 × 44 K slide formats printed using Agilent’s 60-mer SurePrint technology. After hybridization and washing, the processed slides were scanned with the Agilent DNA microarray scanner (part number G2505B) using settings recommended by Agilent Technologies.
Data analysis and clustering
Agilent Feature Extraction Software (version 10.5.1.1) was used to extract the signal intensity values from each gene chip, and the resulting text files were imported into the Agilent GeneSpring GX software (version11.0) for further analysis. The 6-microarray data sets were normalized in GeneSpring GX using the Agilent FE one-color scenario (mainly median normalization), and genes marked present or marginal in all samples were chosen for data analysis. DEGs were identified through fold-change screening comparing between cell lines group A, B, C and cell lines group 1, 2 and 3. The threshold used to screen up or down-regulated genes is fold change ≥2.0 and P value ≤0.05. A scatter plot was made to visualizingly assess the variation between chips. A hierarchical clustering and volcano plot were performed to visualizingly show a distinguishable gene expression profiling among samples.
Validation for gene expression by quantitative real-time polymerase chain reaction
Real-time polymerase chain reaction (RT-PCR) was performed in triplicate with primer sets and probes that were specific for 4 selected genes that were found to be significantly differentially expressed. These 4 genes were 2 up-regulated genes: GCET2, CFTR and 2 down-regulated genes: FOXP1, GARS. cDNA was synthesized using random primers (hexamers) and Oligo 18dT and Superscript II Reverse Transcriptase (Invitrogen). Real-time PCR was performed on Roche LightCycler 480 sequence detection system, using the following amplification conditions: 5 min, 95 °C; followed by 40 cycles of 15 s 95 °C, 1 min 60 °C and 20 s 72 °C. CT values were determined using the IQ5 software (Bio-Rad). The primers mostly were searched from PrimerBank (http://pga.mgh.harvard.edu/primerbank/ index.html). Primers of target genes are listed in Table 2. The comparative threshold cycle method was used for the calculation of amplification fold, as specified by the manufacturer. The housekeeping gene glyceraldehyde-3-phosphate dehydrogenase (GAPDH) was used to normalize the quantity of complementary DNA that was used in the PCR reactions.
Table 2.
Gene-specific primers used for validation
| Gene name | GenBank accession number | Primer sequence (5′-3′) | Amplicon size (bp) |
|---|---|---|---|
| GCET2 | NM_152785 | F: ACCCTCATCAATCATCGGGTT | 122 |
| R: TCAGTCTCAGTTCCTCCCAAG | |||
| CFTR | NM_000492 | F: TGCCCTTCGGCGATGTTTTT | 127 |
| R: GTTATCCGGGTCATAGGAAGCTA | |||
| FOXP1 | NM_032682 | F: TCCCGTGTCAGTGGCTATGAT | 226 |
| R: CTCTTTAGGCTGTTTTCCAGCAT | |||
| GARS | NM_002047 | F: TTGGCCCAGCTTGATAACTATG | 103 |
| R: ACACTGGAGGGGATAGATCATTT | |||
| GAPDH | NM_001256799 | F: ACAACTTTGGTATCGTGGAAGG | 101 |
| R: GCCATCACGCCACAGTTTC |
F forward primer, R reverse primer
Immunohistochemistry on paraffin embedded tissues
To evaluate protein expression levels for 1 of the 49 genes that was found to be different regulated, in consideration of a further study, immunohistochemical staining for FOXP1 was performed on ovarian tissue samples. 29 cases of primary ovarian cancer samples and 25 cases of omental metastatic (OM) ovarian cancer samples were collected from Shengjing Hospital of China Medical University in 2013, the histopathological diagnoses were determined using the WHO criteria. In our previous studies, we have established a set of ovarian cancer chemotherapeutic sensitive and resistant paraffin embedded samples [8, 9], and we randomly selected 40 samples in sensitive and 30 samples in resistant group for FOXP1 staining. There was no statistical difference between these two groups of ovarian samples in age, pathological subtype, lymph node metastasis or residual tumor size (data not shown). FOXP1 staining was performed using JC12 mouse anti-human monoclonal antibodies (diluted 1:40, JC12 was kindly provided by Alison H. Banham, University of Oxford, UK [10]) using the Envision detection kit (Maixin. Bio China). Positive myoepithelial cell staining and negative stromal cell staining in breast carcinoma were used as internal positive and negative controls, respectively. FOXP1 nuclear expression was scored using the following system: negative = 0; weak/focal = 1; strong focal/widespread moderate staining = 2; or strong/widespread staining = 3. Tumors that scored 2 or 3 were considered positive for FOXP1 nuclear staining. Survival analysis was performed on those patients, and the overall survival (OS) time was defined from the date of surgery (earliest was in July, 2004) to the date of death or the last follow-up (Jun, 2014).
Enrichment analysis of DEGs
Gene Set Analysis Toolkit (Gestalt) tool was used to do enrichment analysis on the DEGs in three sections of function, biological process and molecular composition. Gestalt is a suite rich of analysis of biologically relevant content collecting eight species, including human, rat, mouse and other data from various different public data resources, such as NCBI, Ensemble, Gene Ontology (GO) and Kyoto Encyclopedia of Genes and Genomes (KEGG).
Construction of gene regulatory network
The gene regulatory network was visualized by Cytoscape [11]. Proteins in the network served as the “nodes,” and each pairwise protein interaction (referred to as edge) was represented by an undirected link. The property of the network was analyzed with the plug-in network analysis.
Statistics
Statistical analysis was performed using Graphpad Prism 6.0e Software for Mac OS X (GraphPad Software, La Jolla California USA, www.graphpad.com). Student’s t test was employed for comparison between two groups and one-way ANOVA with Tukey’s post hoc test was used for comparison between more than two groups. As to the analysis of quantitative RT-PCR result, data were expressed as mean ± SEM to compare on mRNA expression between different groups. The Chi square and Kaplan–Meier survival analysis were applied to analyze the nuclear expression of FOXP1. For these tests, a P value of <0.05 was considered statistically significant.
Results
Gene expression analysis and clustering
The expression profiles of all the samples passed the microarray quality control (Table 3); a scatter plot was constructed with a two-dimensional rectangular coordinate plane (Fig. 1).
Table 3.
Sample qualification
| Sample ID | OD260/280 | OD260/230 | Concentration (ng/µL) | RIN | 28S/18S | Results |
|---|---|---|---|---|---|---|
| A | 2.06 | 1.9 | 1,126.89 | 8.9 | 1.8 | Qualified |
| B | 2.06 | 2.09 | 1,692.74 | 8.7 | 1.9 | Qualified |
| C | 2.06 | 2.19 | 1,092.17 | 8.0 | 1.8 | Qualified |
| 1 | 2.07 | 1.95 | 1,431.45 | 8.6 | 1.7 | Qualified |
| 2 | 2.07 | 2 | 1,428.15 | 8.5 | 1.8 | Qualified |
| 3 | 2.07 | 2.14 | 1,024.49 | 8.9 | 2.1 | Qualified |
Fig. 1.
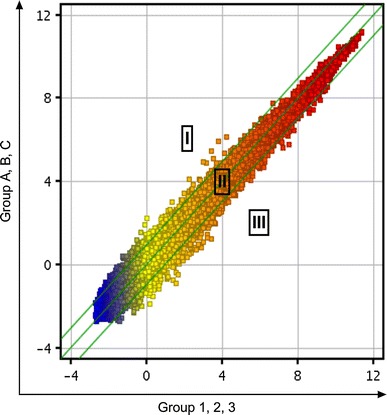
Representative scatter plot of changes in gene expression levels. Scatter plot is a visualization that is useful for assessing the variation (or reproducibility) between chips. All detected probe point values on the chip were plotted. The central diagonal lines were used to classify gene expression levels into three groups: group I, >twofold change increase in gene expression; group II, gene expression levels within a twofold change; and group III, >twofold change decrease in gene expression
Using hierarchical clustering map analysis with probe sets, the DEGs were identified in visualization, which readily distinguished the 2 groups as shown in Fig. 2. The volcano plot of DEGs revealed a total of 49 probe sets that showed a ≥2.0-fold change and P value ≤0.05, as shown in Fig. 3. Of 49 genes, 14 genes were found to be up-regulated and 35 genes down-regulated (Table 4).
Fig. 2.
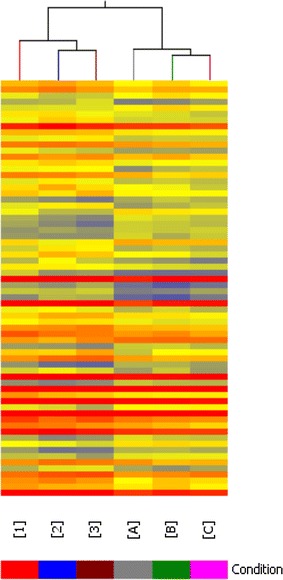
Hierarchical clustering map of DEGs. The result of hierarchical clustering on conditions shows a distinguishable gene expression profiling among samples
Fig. 3.
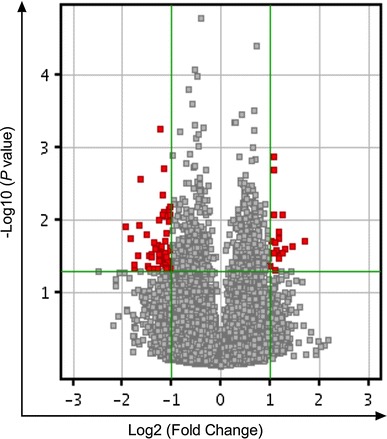
Volcano plot of DEGs. The vertical lines correspond to twofold up and down, respectively, and the horizontal line represents a P value of 0.05. So the red point in the plot represents the differentially expressed genes with statistical significance
Table 4.
Differentially expressed genes at least twofold higher
| Gene symbol | GenBank accession | Description | Fold change | P value |
|---|---|---|---|---|
| Up-regulated genes | ||||
| GCET2 | NM_001008756 | Germinal center expressed transcript 2 | 3.25461 | 0.01955 |
| TMEFF1 | NM_003692 | Transmembrane protein with EGF-like and two follistatin-like domains 1 | 2.48936 | 0.02476 |
| PTTG3 | NR_002734 | Pituitary tumor-transforming 3 on chromosome 8 | 2.39659 | 0.00859 |
| CFTR | NM_000492 | Cystic fibrosis transmembrane conductance regulator isoform 36 | 2.37741 | 0.02794 |
| MS4A6A | NM_022349 | Membrane-spanning 4-domains, subfamily A, member 6A | 2.32408 | 0.02803 |
| FFAR2 | NM_005306 | Free fatty acid receptor 2 | 2.26184 | 0.01446 |
| BX648831 | BX648831 | Poly(A) binding protein, cytoplasmic 4-like | 2.25877 | 0.01799 |
| GPRC6A | NM_148963 | G-protein-coupled receptor, family C, group 6, member A | 2.17761 | 0.02608 |
| SLC25A42 | NM_178526 | Solute carrier family 25, member 42 | 2.13807 | 0.02038 |
| SVEP1 | AK027870 | Sushi, von Willebrand factor type A, EGF and pentraxin domain containing 1 | 2.1106 | 0.00132 |
| NLRP4 | NM_134444 | NLR family, pyrin domain containing 4 | 2.10449 | 0.00205 |
| GLP1R | NM_002062 | Glucagon-like peptide 1 receptor | 2.09506 | 0.02839 |
| LOC643406 | BC031676 | Hypothetical protein LOC643406 | 2.04176 | 0.01908 |
| FLJ14816 | BC113708 | Hypothetical protein FLJ14816 | 2.01485 | 0.04223 |
| Down-regulated genes | ||||
| RPL28P1 | XR_019242 | Ribosomal protein L28 pseudogene 1 | 3.80897 | 0.01208 |
| RPL23A | NM_000984 | Ribosomal protein L23a | 3.35458 | 0.04575 |
| RPL13AP3 | BC067891 | Ribosomal protein L13a pseudogene 3 | 3.0956 | 0.00275 |
| COX19 | NM_001031617 | COX19 cytochrome c oxidase assembly homolog (S. cerevisiae) | 2.85475 | 0.01561 |
| RBMX | NM_002139 | RNA binding motif protein, X-linked | 2.77763 | 0.04326 |
| LOC341412 | CA455253 | Hypothetical LOC341412, pseudo gene | 2.764 | 0.0313 |
| LOC641784 | AW302767 | Similar to ribosomal protein L31, pseudo gene | 2.7233 | 0.04737 |
| FOXP1 | NM_032682 | Forkhead box P1 | 2.63004 | 0.03159 |
| COL27A1 | NM_032888 | Collagen, type XXVII, alpha 1 | 2.62832 | 0.02947 |
| PTMA | NM_002823 | Prothymosin, alpha | 2.58023 | 0.04672 |
| CALCOCO2 | NM_005831 | Calcium binding and coiled-coil domain 2 | 2.53815 | 0.02005 |
| DNAJB6 | NM_005494 | DnaJ (Hsp40) homolog, subfamily B, member 6 | 2.53533 | 0.02531 |
| LOC391560 | XR_018524 | Ribosomal protein L32 pseudogene 7 | 2.43023 | 0.04685 |
| ZNF234 | NM_006630 | Zinc finger protein 234 | 2.37866 | 0.0357 |
| WASF2 | NM_006990 | WAS protein family, member 2 | 2.37554 | 0.02993 |
| AP3S2 | NM_005829 | Adaptor-related protein complex 3, sigma 2 subunit | 2.36803 | 0.01003 |
| KLF2 | NM_016270 | Kruppel-like factor 2 (lung) | 2.36563 | 0.03192 |
| ZC3H11A | NM_014827 | Zinc finger CCCH-type containing 11A | 2.35468 | 0.02414 |
| RPS16P9 | XR_016930 | Ribosomal protein S16 pseudogene 9 | 2.32731 | 0.00056 |
| EIF1B | NM_005875 | Eukaryotic translation initiation factor 1B | 2.28022 | 0.00834 |
| NR4A2 | NM_006186 | Nuclear receptor subfamily 4, group A, member 2 | 2.25709 | 0.03943 |
| LY6G6C | NM_025261 | Lymphocyte antigen 6 complex, locus G6C | 2.19288 | 0.0412 |
| RPS7P5 | AK098605 | Ribosomal protein S7 pseudogene 5 | 2.17098 | 0.00883 |
| RPLP0P2 | NR_002775 | Ribosomal protein, large, P0 pseudogene 2 | 2.15877 | 0.03239 |
| CCDC144A | BC034617 | Coiled-coil domain containing 144A | 2.15257 | 0.01531 |
| GARS | NM_002047 | Glycyl-tRNA synthetase | 2.14073 | 0.04554 |
| LOC388524 | NM_001005472 | Similar to Laminin receptor 1 | 2.13836 | 0.04665 |
| ZNF467 | NM_207336 | Zinc finger protein 467 | 2.12557 | 0.04513 |
| LOC732186 | XR_016076 | Similar to signal sequence receptor gamma subunit, pseudo gene | 2.0591 | 0.01044 |
| ZBTB43 | NM_014007 | Zinc finger and BTB domain containing 43 | 2.05301 | 0.02564 |
| RPL13AP23 | XR_018808 | Ribosomal protein L13a pseudogene 23 | 2.04535 | 0.00653 |
| RPLP1P7 | CH471086 | Ribosomal protein, large, P1 pseudogene 7 | 2.04394 | 0.00846 |
| RPL31P10 | XR_018695 | Ribosomal protein L31 pseudogene 10 | 2.04042 | 0.03652 |
| SNX29 | AK024473 | Sorting nexin 29 | 2.03297 | 0.04401 |
| LOC648361 | XM_001127349 | Similar to 40S ribosomal protein S12, pseudogene | 2.00295 | 0.04577 |
Validation of gene expression results by using quantitative RT-PCR
Four highly differentially expressed genes (i.e., GCET2, CFTR, FOXP1 and SNX29) were selected for quantitative RT-PCR analysis as shown in Fig. 4. These results were in good agreement with the microarray data, confirming the reliability of the microarray results.
Fig. 4.
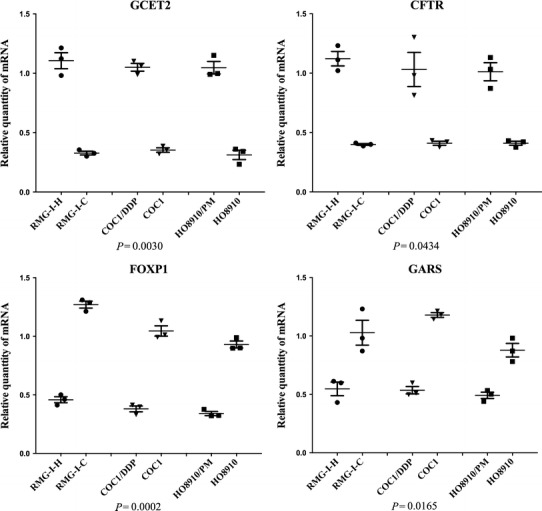
Quantitative real-time PCR validation for 4 selected genes. Quantitative real-time PCR for selected genes (GCET2, NLRP4, FOXP1 and SNX29) found to be differentially expressed in gene microarrays. The relative expression of GCET2 and CFTR was significantly higher in RMG-I-H, COC1/DDP, HO8910/PM than RMG-I-C, COC1, HO8910, respectively. The relative expression of FOXP1 and GARS was significantly lower in RMG-I-H, COC1/DDP, HO8910/PM than RMG-I-C, COC1, HO8910, respectively. (P < 0.05, one-way ANOVA)
Validation of protein expression by immunohistochemical staining
To confirm gene expression results at the protein level, immunohistochemistry for FOXP1 was carried out on all paraffin embedded samples. For metastasis, as shown in Table 5, FOXP1 nuclear positive staining in EOC was detected in 12 of 29 EOC samples (41.4 %), while only 4 of 25 OM samples (16.0 %) showed positive nuclear staining for FOXP1 (P = 0.042). For chemotherapeutic resistance, as shown in Table 6 and depicted in Fig. 5, FOXP1 nuclear positive staining in sensitive group was detected in 17 of 40 sensitive samples (42.5 %), while only 5 of 30 resistant samples (16.7 %) showed positive nuclear staining for FOXP1 (P = 0.021). A Kaplan–Meier survival analysis was applied to further investigate the effect of FOXP1 protein on ovarian cancer patients, as shown in Fig. 6, positive nuclear staining of FOXP1 was an independent risk factor and strongly correlated with prognosis.
Table 5.
FOXP1 protein expression in 29 primary epithelial ovarian cancer (EOC) and 25 omental metastasis (OM) epithelial ovarian cancer
| Cases | Nucleus staining | ||
|---|---|---|---|
| − | + | ||
| EOC | 29 | 17 | 12 |
| OM | 25 | 21 | 4 |
Table 6.
FOXP1 protein expression in 40 chemotherapy-sensitive epithelial ovarian cancers and 30 resistant ovarian epithelial cancers
| Cases | Nucleus staining | ||
|---|---|---|---|
| – | + | ||
| Sensitive | 40 | 23 | 17 |
| Resistant | 30 | 25 | 5 |
Fig. 5.
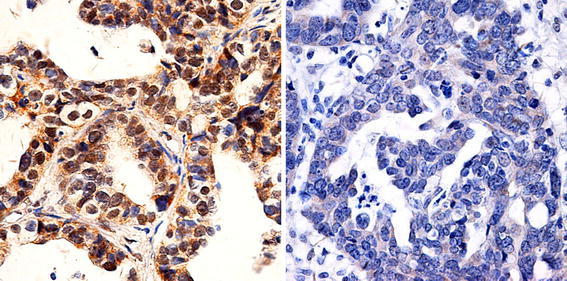
Immunohistochemical staining for FOXP1. Representative immunohistochemical staining for FOXP1. Left panel chemotherapeutic sensitive sample shows a positive nuclear staining for FOXP1. Right panel chemotherapeutic resistant sample displays a negative nuclear staining for FOXP1
Fig. 6.
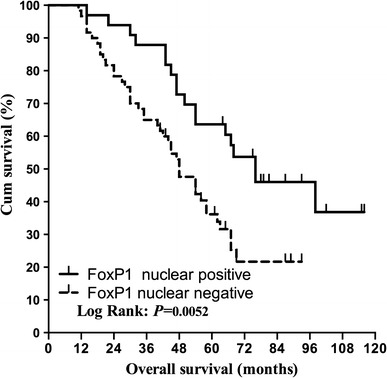
Kaplan–Meier survival analysis of chemotherapic ovarian cancer patients. Kaplan–Meier survival analysis shows that the positive nuclear staining of FOXP1 is an independent risk factor in ovarian cancer patients and strongly correlates with good prognosis
GO function analysis and Signal pathway result of differential genes
Significant bioprocesses of the DEGs, gene expression, biopolymer biosynthetic process, macromolecule biosynthetic process, cAMP-mediated signaling, nucleic acid metabolic process, transcription and so on (Table 7). A total of 176 KEGG pathways were enriched for the 49 DEGs, including 20 significantly enriched pathways (Table 8), such as P450 hydroxylations, HIF-1-alpha transcription factor network, mechanism of acetaminophen activity and toxicity, cystic fibrosis transmembrane conductance regulator (CFTR) and beta 2 adrenergic receptor (B2AR) pathway, alpha6beta4integrin, negative regulation of the PI3K/AKT network.
Table 7.
Classification of the up-regulated and down- regulated genes involved in the significant bioprocesses
| GO Term | P value | Count in selection | % Count in selection | Count in total | % Count in total |
|---|---|---|---|---|---|
| Gene expression | 9.36E−04 | 11 | 39.285713 | 2,187 | 14.157172 |
| Biopolymer biosynthetic process | 0.001659173 | 10 | 35.714287 | 1,972 | 12.765407 |
| Macromolecule biosynthetic process | 0.0031013 | 10 | 35.714287 | 2,141 | 13.859399 |
| cAMP-mediated signaling | 0.00382362 | 2 | 7.142857 | 51 | 0.33013982 |
| Nucleobase, nucleoside, nucleotide and nucleic acid metabolic process | 0.00942933 | 10 | 35.714287 | 2,495 | 16.150957 |
| Cyclic-nucleotide-mediated signaling | 0.010541212 | 2 | 7.142857 | 86 | 0.55670637 |
| Transcription | 0.014451807 | 7 | 25 | 1,483 | 9.599948 |
| Biosynthetic process | 0.014984685 | 10 | 35.714287 | 2,668 | 17.270844 |
| G-protein-coupled receptor activity | 0.016115764 | 4 | 14.285714 | 546 | 3.5344381 |
| Translation | 0.021661116 | 3 | 10.714286 | 332 | 2.1491456 |
| Nucleic acid binding | 0.030367257 | 10 | 35.714287 | 2,970 | 19.22579 |
| Biopolymer metabolic process | 0.030960111 | 12 | 42.857143 | 3,891 | 25.187727 |
| Receptor activity | 0.036230754 | 6 | 21.428572 | 1,398 | 9.049715 |
| G-protein-coupled receptor protein signaling pathway | 0.036383796 | 4 | 14.285714 | 702 | 4.5442777 |
| Second-messenger-mediated signaling | 0.042707212 | 2 | 7.142857 | 182 | 1.178146 |
| Ribonucleoprotein complex | 0.046174083 | 3 | 10.714286 | 447 | 2.8935785 |
| Rhodopsin-like receptor activity | 0.04668641 | 3 | 10.714286 | 449 | 2.9065251 |
| Structural constituent of ribosome | 0.0483463 | 2 | 7.142857 | 195 | 1.2622993 |
| Macromolecule metabolic process | 0.049876012 | 13 | 46.42857 | 4,646 | 30.07509 |
Table 8.
Analysis of the differential gene pathways
| Pathway | Number of entities | Matched with technology | Matched with entity list | P value |
|---|---|---|---|---|
| P450 Hydroxylations | 19 | 4 | 2 | 0.002811053 |
| HIF-1-alpha transcription factor network | 88 | 73 | 6 | 0.002937696 |
| Mechanism of acetaminophen activity and toxicity | 12 | 5 | 2 | 0.004168975 |
| Hypoxic and oxygen homeostasis regulation of HIF-1-alpha | 111 | 86 | 6 | 0.006581206 |
| Cystic fibrosis transmembrane conductance regulator (CFTR) and beta 2 adrenergic receptor (B2AR) pathway | 14 | 3 | 1 | 0.006656855 |
| De novo synthesis of IMP | 32 | 4 | 1 | 0.011070482 |
| Cytochrome p450 | 54 | 9 | 2 | 0.01444615 |
| Phase 1 functionalization | 87 | 9 | 2 | 0.01444615 |
| il12 and stat4 dependent signaling pathway in th1 development | 13 | 10 | 2 | 0.015267268 |
| alpha6beta4integrin | 53 | 50 | 4 | 0.01597487 |
| IL4-mediated signaling events | 84 | 52 | 4 | 0.018223463 |
| Purine metabolism | 100 | 9 | 1 | 0.022020191 |
| Xenobiotics | 60 | 15 | 2 | 0.0333969 |
| Stathmin and breast cancer resistance to antimicrotubule agents | 18 | 2 | 1 | 0.03385132 |
| Negative regulation of the PI3 K/AKT network | 12 | 2 | 1 | 0.03385132 |
| TCR | 140 | 125 | 6 | 0.035289083 |
| Gap-filling DNA repair synthesis and ligation in GG-NER | 7 | 2 | 1 | 0.038461793 |
| Gap-filling DNA repair synthesis and ligation in TC-NER | 7 | 2 | 1 | 0.038461793 |
| FOXA1 transcription factor network | 53 | 40 | 3 | 0.04229567 |
| Nucleotide metabolism | 198 | 22 | 1 | 0.049933493 |
Establishment of regulatory network for the DEGs
In order to further investigate the global expression occurring and to define how individual up- or down-regulated genes interact with each other to have a coordinated role, we identified potential networks for these DEGs (Fig. 7). Among the 49 DEGs, 20 were involved in the establishment of regulation network, of which 4 were up-regulated and 16 were down-regulated. A total of 21 transcription factors (TFs) were predicted, in which UBC and EP200 are the most connected predicted hub genes.
Fig. 7.
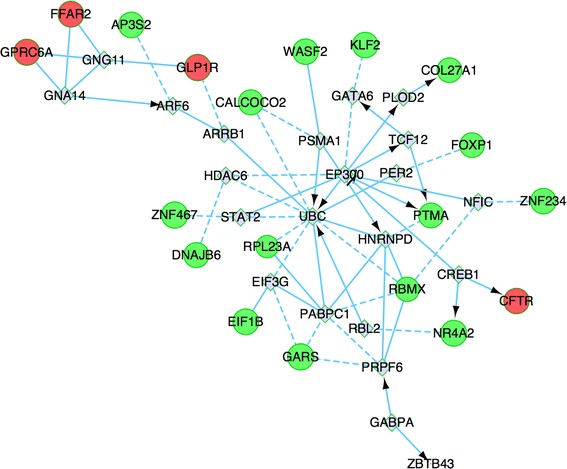
Interaction network of the differentially expressed gene. Genes with more links are shown in bigger size. Proteins shown in red are encoded by up-regulated genes, while those in green are encoded by down-regulated genes, the gray represents the predicted genes. Arrow line represents definite control relationship, dotted line represents predicted control relationship, solid line represents inhibition
Discussion
Ovarian cancer has the highest mortality rate of all gynecologic cancers, and 75 % of patients diagnosed with ovarian cancer are already at an advanced stage. Chemotherapy is important in treating and preventing the recurrence of ovarian cancer; however, resistance is an obstacle to overcome and finding new treatment strategies has become increasingly valuable. High-throughput technologies for assaying gene expression, such as high-density oligonucleotide and cDNA microarrays, may offer the potential to identify clinically relevant genes highly differentially expressed between different cell lines. Thus, this study showed the first communication of an investigation that involved the genome-wide examination of differences in gene expression between ovarian cancer cell lines and their sub-lines with enhanced metastasis and chemotherapic resistance. We identified 49 genes that were expressed differentially between Group A, B, C and Group 1, 2, 3, and the average change in expression level between the two groups was at least twofold. The known functions of some of these genes can provide insights with the highly metastasis and chemotherapic resistance for ovarian cancer, although others are still useful for a further research.
GCET2 is found to be the most up-regulated genes in the more enhanced metastasis and chemoresistance cell group, and it is also known as human germinal center associated lymphoma (HGAL) gene, is specifically expressed in germinal center B-lymphocytes and germinal center-derived B cell lymphomas [12], but its function is largely unknown. The GCET2 gene is located on chromosome 3q13 and encodes a 178-amino acid (aa) protein with 51 % identity and 62 % similarity to the murine M17 protein [13]. GCET2 is a cytoplasmatic protein that may also associate with cell membrane. GCET2 expression is associated with improved survival in diffuse large B cell lymphoma (DLBCL) and classic Hodgkin lymphoma patients [14]. In vitro studies in human lymphocytes demonstrated that HGAL increased the binding of myosin to F-actin and inhibits the ability of myosin to translocate actin by reducing the maximal velocity of myosin head/actin movement [15]. In vitro HGAL enhances BCR signaling by binding and increasing Syk activation, in vivo older HGAL transgenic animals progressively developed polyclonal lymphoid hyperplasia and reactive AA amyloidosis [16], these finding suggests that GCET2 may play a role in humoral immune responses. No articles about expression and function of GCET2 on ovarian tissue have been published until now, and our findings make a possible insight of this gene in the study of ovarian cancer, especially about the aspects of metastasis and chemoresistance.
Cystic fibrosis transmembrane conductance regulator (CFTR, ABC35 or ABCC7) was found among the most up-regulated genes in more metastasis and chemoresistance cell line group, and it participates in the beta-adrenergic-dependent CFTR expression pathway. Loss of function mutations of this gene causes the autosomal recessive lethal disease cystic fibrosis (CF) and congenital bilateral aplasia of the vas deferens. There is an increasing interest in the association of cancer incidence with the genetic variations in the CFTR gene. Large cohort studies in North American and European patients with CF found that there was a marked increase in the risk of malignancies affecting the gastrointestinal tract, even to 17 times higher risk of digestive cancer with most cases arising in the bowel [17]. Meanwhile, mutations and low-penetrance polymorphisms in the CFTR gene have been found in patients with various cancers, including pancreatic cancer [18], breast cancer [19], cervical cancer [20], melanoma [21], prostate cancer [22] and lung cancer [23, 24]. On the other hand, CFTR has been suggested to interact with various cancer-related kinases [25]. It encodes a member of the ATP-binding cassette (ABC) transporter superfamily. ABC proteins transport various molecules across extracellular and intracellular membranes. ABC genes are divided into seven distinct subfamilies (ABC1, MDR/TAP, MRP, ALD, OABP, GCN20, White). Meanwhile, CFTR is a member of the MRP subfamily that is involved in multidrug resistance. The encoded protein is a cAMP-activated Cl− channel lining the luminal/apical surfaces of epithelial cells in airway, gut, and exocrine glands, and there is a functional coupling between CFTR and MRP2 that may be mediated by PDZ protein [24]. Taken together, our gene expression profile that show a significant up-regulated result of CFTR in more metastasis and chemoresistant ovarian cancer cell lines are consistent with previous findings, a further research on the mechanism of CFTR on ovarian cancer or selective inhibition of CFTR or its pathway may give a insight in therapeutic effects against metastatic and chemoresistant of ovarian cancer.
RBMX gene, also known as HnRNP G, is a member of heterogeneous nuclear ribonucleoprotein (hnRNP) family and can collaborate with hTra2-beta1 (human transformer-2-beta1) as sequence-specific transacting factors to exert antagonistic effects on alternative splicing which is recognized as a pivotal mechanism in regulation of gene expression and associated to tumorigenesis and metastasis of a wide variety of human cancers [26]. It is proposed that the ratio of hnRNP G/hTra2-beta1 influenced cellular splicing preference [27, 28]. Some researches revealed that hnRNP G-protein showed as tumor suppressor in endometrial carcinoma [27] and oral squamous cancer [29], its activity was elicited by transactivating tumor suppressor Txnip gene [30]. A recent research showed that high frequency of hnRNP G-protein reduction and loss of expression in precancerous and human oral squamous cell carcinoma tissue specimens, suggesting that reduction in hnRNP G may play an important role in the early pathogenesis of oral squamous cell carcinomas [31].
GPRC6A encodes an orphan G-protein-coupled receptor, mediates the non-genomic effects of testosterone and other anabolic steroids in multiple tissue, and it is a potential target for developing antagonists and agonists that would have broad applications in health and disease [32], including cancer. A genome-wide association study on prostate cancer identified GPRC6A was one of the five novel genetic loci associated with prostate cancer in Japanese and Chinese Han population [33, 34], and the same result was verified by a genome-wide testing of putative functional exonic variants in a multiethnic population [35]. GPRC6A is expressed at higher levels in human prostate cancer cells and prostate cancer tissues and small interfering RNA knockdown of GPRC6A attenuates these response in human prostate cancer cell lines [36]. GPRC6A is also coupled to signaling pathways, such as phosphatidylinositol 3-kinase that are known to be deregulated in prostate cancer [32]. On all accounts, nearly all researches about GPRC6A associated with cancer focused on prostate cancer, no investigation about this gene on ovarian cancer has been published.
FOXP1, as one of the down-regulated genes, drew our attention for a further research. FOXP1 is a FOX family member consisting of the winged-helix DNA-binding domain and the N-terminal transcriptional repression domain, and it is widely expressed and plays a key role in the development of various human tissues [37, 38]. FOXP1 represses its target genes by forming homodimers or heterodimers with FOXP2 and FOXP4 [39], it has been suggested to be both a tumor suppressor candidate and potential oncogene, because of its differential expression levels in distinctive types of tumors, including B cell lymphomas [40], breast cancer [41, 42], endometrial cancer [43], prostate cancer [44], non-small cell lung cancer [38] and renal cell carcinoma [45], the loss of FOXP1 in breast cancer has been associated with shorter survival times [42]. Until now, no article about FOXP1 expression in ovarian cancer has been published, and we made the first investigation of FOXP1 protein expression in ovarian tissue and found that nuclear staining of FOXP1 decreased as the metastasis increased, a significant decrease in FOXP1 expression in the resistance group, nuclear FOXP1 expression were independent risk factors strongly correlated with prognosis of ovarian cancer, above all, FOXP1 may serve as a good marker for late stage ovarian cancer and chemoresistance EOC patients, high expression of FOXP1 in nucleus is associated with improved survival in patients with ovarian cancer.
There are some pseudogenes which shows significant expression difference in enhanced metastasis and chemoresistant ovarian cancer cell lines, in which BC031676 and BC113708 are up-regulated, and RPL28P1, RPL23A, RPL13AP3, LOC341412, LOC641784, LOC391560, RPS16P9, LOC732186, RPL13AP23, RPLP1P7, RPL31P10, LOC648361 are down-regulated, and most of them are ribosomal protein pseudogenes. Pseudogenes are DNA sequences similar to genes encoding functional proteins but are presumed to be nonfunctional due to mutations and truncation by premature stop codons [46]. Ribosomal protein (RP) pseudogenes constitute the largest family of pseudogenes (approximately 2000 RP processed pseudogenes), and they are constitutively expressed at reasonably stable levels and are very highly conserved [47]. Although pseudogenes have long been considered as nonfunctional genomic sequences, during recent two decades, especially with the broad applications of next-generation sequencing technologies, emerging evidences have confirmed that some pseudogenes have acquired diverse functions in regulating development and diseases, especially in cancers [48]. Some pseudogenes are specifically expressed in certain cancers or diseases. It has been shown that the pseudogene of PTEN, PTENP1, was selectively lost in some human cancer cells, resulting in decreased expression of PTEN and abnormal proliferation of cancer cells [49]. The expression of MYLKP1, a duplicated pseudogene of MYLK, can decrease the stability of MYLK mRNA at the posttranscriptional level and stimulate cell proliferation [50]. Recently, a study provided a systematic approach to analyze expressed pseudogenes, enabling comparisons of cancer versus benign tissues in multiple solid tumors, which overcome the limitations of previous analyses of pseudogene expression. They observed 218 pseudogenes expressed only in cancer samples, of which 178 were observed in multiple cancers, and 40 were found to have highly specific expression in a single cancer type only, finally they described ATP8A2-J and CXADR-J pseudogenes preferentially associated with distinct subsets of breast cancer and prostate cancer patients, respectively [51]. Besides cancers, pseudogenes also involve in the development of other diseases, such as HMGA1-p [52]. Although the regulatory functions of pseudogenes seem to be striking, the functional studies of pseudogenes are still in its early stage. The pseudogenes in our study should not be useless, their functions and relationships with ovarian cancer, especially the enhanced metastasis and chemoresistance should be investigated in near further.
In conclusion, this study has identified potential DEGs responsible for enhanced metastasis and chemoresistance in ovarian cancer cell lines. Among the 49 DEGs, 14 genes were up-regulated and 35 genes were down-regulated. Prospective investigations using a combination of genomic and proteomic approaches are required to validate the functionality of these targets identified.
Acknowledgments
This work was supported by the National Natural Science Foundation of China (Grant Nos.: 81072118, 81172491, 81101527), the Education Department Doctor Project Fund (Grant Nos.: 20112104110016, 20112104120019) and the Free Researchers’ Plan of Shengjing Hospital Affiliated to China Medical University (Grant No. 200807).
Conflict of interest
The authors declare no conflict of interest.
Contributor Information
Liancheng Zhu, Email: zhulccmu@gmail.com.
Zhenhua Hu, Email: huzh5062012@163.com.
Juanjuan Liu, Email: juanjuanliu_lg@yahoo.com.cn.
Jian Gao, Email: tbagd0519@sina.com.
Bei Lin, Phone: +86-24-96615-1-41511, Email: linbei88@hotmail.com.
References
- 1.Liu CM. Cancer of the ovary. N Engl J Med. 2005;352:1268–9; author reply-9. [PubMed]
- 2.Iwamori M, Tanaka K, Kubushiro K, Lin B, Kiguchi K, Ishiwata I, et al. Alterations in the glycolipid composition and cellular properties of ovarian carcinoma-derived RMG-1 cells on transfection of the alpha1,2-fucosyltransferase gene. Cancer Sci. 2005;96:26–30. doi: 10.1111/j.1349-7006.2005.00005.x. [DOI] [PMC free article] [PubMed] [Google Scholar]
- 3.Lin B, Hao YY, Wang DD, Zhu LC, Zhang SL, Saito M, et al. Transfection of alpha1, 2-fucosyltransferase gene increases the antigenic expression of Lewis y in ovarian cancer cell line RMG-I. Zhongguo yi xue ke xue yuan xue bao Acta Academiae Medicinae Sinicae. 2008;30:284–289. [PubMed] [Google Scholar]
- 4.Liu JJ, Lin B, Hao YY, Li FF, Liu DW, Qi Y, et al. Lewis(y) antigen stimulates the growth of ovarian cancer cells via regulation of the epidermal growth factor receptor pathway. Oncol Rep. 2010;23:833–841. doi: 10.3892/or_00000730. [DOI] [PubMed] [Google Scholar]
- 5.Yan LM, Lin B, Zhu LC, Hao YY, Qi Y, Wang CZ, et al. Enhancement of the adhesive and spreading potentials of ovarian carcinoma RMG-1 cells due to increased expression of integrin alpha5beta1 with the Lewis Y-structure on transfection of the alpha1,2-fucosyltransferase gene. Biochimie. 2010;92:852–857. doi: 10.1016/j.biochi.2010.02.012. [DOI] [PubMed] [Google Scholar]
- 6.Gao S, Liu Q, Wang X, Lin B, Zhang S. Effects of Lewis Y antigen on the gene expression of multiple drug resistance-associated proteins in human ovarian cancer RMG-I-H cells. Med Oncol. 2010;27:960–967. doi: 10.1007/s12032-009-9317-6. [DOI] [PubMed] [Google Scholar]
- 7.Shenhua X, Lijuan Q, Hanzhou N, Xinghao N, Chihong Z, Gu Z, et al. Establishment of a highly metastatic human ovarian cancer cell line (HO-8910PM) and its characterization. J Exp Clin Cancer Res CR. 1999;18:233–239. [PubMed] [Google Scholar]
- 8.Gao J, Hu Z, Liu D, Liu J, Liu C, Hou R, et al. Expression of Lewis y antigen and integrin alphav, beta3 in ovarian cancer and their relationship with chemotherapeutic drug resistance. J Exp Clin Cancer Res CR. 2013;32:36. doi: 10.1186/1756-9966-32-36. [DOI] [PMC free article] [PubMed] [Google Scholar]
- 9.Hu Z, Gao S, Gao J, Hou R, Liu C, Liu J, et al. Elevated levels of Lewis y and integrin alpha5beta1 correlate with chemotherapeutic drug resistance in epithelial ovarian carcinoma. Int J Mol Sci. 2012;13:15588–15600. doi: 10.3390/ijms131215588. [DOI] [PMC free article] [PubMed] [Google Scholar]
- 10.Koon HB, Ippolito GC, Banham AH, Tucker PW. FOXP1: a potential therapeutic target in cancer. Expert Opin Ther Targets. 2007;11:955–965. doi: 10.1517/14728222.11.7.955. [DOI] [PMC free article] [PubMed] [Google Scholar]
- 11.Diaz-Montana JJ, Diaz-Diaz N. Development and use of the Cytoscape app GFD-Net for measuring semantic dissimilarity of gene networks. F1000 Res. 2014;3:142. doi: 10.12688/f1000research.4573.1. [DOI] [PMC free article] [PubMed] [Google Scholar]
- 12.Pan Z, Shen Y, Ge B, Du C, McKeithan T, Chan WC. Studies of a germinal centre B-cell expressed gene, GCET2, suggest its role as a membrane associated adapter protein. Br J Haematol. 2007;137:578–590. doi: 10.1111/j.1365-2141.2007.06597.x. [DOI] [PMC free article] [PubMed] [Google Scholar]
- 13.Schenten D, Egert A, Pasparakis M, Rajewsky K. M17, a gene specific for germinal center (GC) B cells and a prognostic marker for GC B-cell lymphomas, is dispensable for the GC reaction in mice. Blood. 2006;107:4849–4856. doi: 10.1182/blood-2005-10-4154. [DOI] [PMC free article] [PubMed] [Google Scholar]
- 14.Natkunam Y, Lossos IS, Taidi B, Zhao S, Lu X, Ding F, et al. Expression of the human germinal center-associated lymphoma (HGAL) protein, a new marker of germinal center B-cell derivation. Blood. 2005;105:3979–3986. doi: 10.1182/blood-2004-08-3112. [DOI] [PMC free article] [PubMed] [Google Scholar]
- 15.Lu X, Kazmierczak K, Jiang X, Jones M, Watt J, Helfman DM, et al. Germinal center-specific protein human germinal center associated lymphoma directly interacts with both myosin and actin and increases the binding of myosin to actin. FEBS J. 2011;278:1922–1931. doi: 10.1111/j.1742-4658.2011.08109.x. [DOI] [PMC free article] [PubMed] [Google Scholar]
- 16.Romero-Camarero I, Jiang X, Natkunam Y, Lu X, Vicente-Duenas C, Gonzalez-Herrero I, et al. Germinal centre protein HGAL promotes lymphoid hyperplasia and amyloidosis via BCR-mediated Syk activation. Nat Commun. 2013;4:1338. doi: 10.1038/ncomms2334. [DOI] [PMC free article] [PubMed] [Google Scholar]
- 17.Maisonneuve P, Marshall BC, Knapp EA, Lowenfels AB. Cancer risk in cystic fibrosis: a 20-year nationwide study from the United States. J Natl Cancer Inst. 2013;105:122–129. doi: 10.1093/jnci/djs481. [DOI] [PubMed] [Google Scholar]
- 18.McWilliams R, Highsmith WE, Rabe KG, de Andrade M, Tordsen LA, Holtegaard LM, et al. Cystic fibrosis transmembrane regulator gene carrier status is a risk factor for young onset pancreatic adenocarcinoma. Gut. 2005;54:1661–1662. doi: 10.1136/gut.2005.074534. [DOI] [PMC free article] [PubMed] [Google Scholar]
- 19.Zhang JT, Jiang XH, Xie C, Cheng H, Da Dong J, Wang Y, et al. Downregulation of CFTR promotes epithelial-to-mesenchymal transition and is associated with poor prognosis of breast cancer. Biochim Biophys Acta. 2013;1833:2961–2969. doi: 10.1016/j.bbamcr.2013.07.021. [DOI] [PubMed] [Google Scholar]
- 20.Peng X, Wu Z, Yu L, Li J, Xu W, Chan HC, et al. Overexpression of cystic fibrosis transmembrane conductance regulator (CFTR) is associated with human cervical cancer malignancy, progression and prognosis. Gynecol Oncol. 2012;125:470–476. doi: 10.1016/j.ygyno.2012.02.015. [DOI] [PubMed] [Google Scholar]
- 21.Warren N, Holmes JA, Al-Jader L, West RR, Lewis DC, Padua RA. Frequency of carriers of cystic fibrosis gene among patients with myeloid malignancy and melanoma. BMJ (Clinical research ed) 1991;302:760–761. doi: 10.1136/bmj.302.6779.760. [DOI] [PMC free article] [PubMed] [Google Scholar]
- 22.Qiao D, Yi L, Hua L, Xu Z, Ding Y, Shi D, et al. Cystic fibrosis transmembrane conductance regulator (CFTR) gene 5T allele may protect against prostate cancer: a case-control study in Chinese Han population. J Cyst Fibros. 2008;7:210–214. doi: 10.1016/j.jcf.2007.07.011. [DOI] [PubMed] [Google Scholar]
- 23.Li Y, Sun Z, Wu Y, Babovic-Vuksanovic D, Li Y, Cunningham JM, et al. Cystic fibrosis transmembrane conductance regulator gene mutation and lung cancer risk. Lung Cancer (Amsterdam, Netherlands) 2010;70:14–21. doi: 10.1016/j.lungcan.2010.01.005. [DOI] [PMC free article] [PubMed] [Google Scholar]
- 24.Li C, Schuetz JD, Naren AP. Tobacco carcinogen NNK transporter MRP2 regulates CFTR function in lung epithelia: implications for lung cancer. Cancer Lett. 2010;292:246–253. doi: 10.1016/j.canlet.2009.12.009. [DOI] [PMC free article] [PubMed] [Google Scholar]
- 25.Pagano MA, Tibaldi E, Gringeri E, Brunati AM. Tyrosine phosphorylation and liver regeneration: a glance at intracellular transducers. IUBMB Life. 2012;64:27–35. doi: 10.1002/iub.576. [DOI] [PubMed] [Google Scholar]
- 26.Fischer DC, Noack K, Runnebaum IB, Watermann DO, Kieback DG, Stamm S, et al. Expression of splicing factors in human ovarian cancer. Oncol Rep. 2004;11:1085–1090. [PubMed] [Google Scholar]
- 27.Ouyang YQ, zur Hausen A, Orlowska-Volk M, Jager M, Bettendorf H, Hirschfeld M, et al. Expression levels of hnRNP G and hTra2-beta1 correlate with opposite outcomes in endometrial cancer biology. Int J Cancer J Int du Cancer. 2011;128:2010–2019. doi: 10.1002/ijc.25544. [DOI] [PubMed] [Google Scholar]
- 28.Nasim MT, Chernova TK, Chowdhury HM, Yue BG, Eperon IC. HnRNP G and Tra2beta: opposite effects on splicing matched by antagonism in RNA binding. Hum Mol Genet. 2003;12:1337–1348. doi: 10.1093/hmg/ddg136. [DOI] [PubMed] [Google Scholar]
- 29.Shin KH, Kang MK, Kim RH, Christensen R, Park NH. Heterogeneous nuclear ribonucleoprotein G shows tumor suppressive effect against oral squamous cell carcinoma cells. Clin Cancer Res. 2006;12:3222–3228. doi: 10.1158/1078-0432.CCR-05-2656. [DOI] [PubMed] [Google Scholar]
- 30.Shin KH, Kim RH, Kim RH, Kang MK, Park NH. hnRNP G elicits tumor-suppressive activity in part by upregulating the expression of Txnip. Biochem Biophys Res Commun. 2008;372:880–885. doi: 10.1016/j.bbrc.2008.05.175. [DOI] [PMC free article] [PubMed] [Google Scholar]
- 31.Shin KH, Kim RH, Yu B, Kang MK, Elashoff D, Christensen R, et al. Expression and mutation analysis of heterogeneous nuclear ribonucleoprotein G in human oral cancer. Oral Oncol. 2011;47:1011–1016. doi: 10.1016/j.oraloncology.2011.07.012. [DOI] [PMC free article] [PubMed] [Google Scholar]
- 32.Pi M, Parrill AL, Quarles LD. GPRC6A mediates the non-genomic effects of steroids. J Biol Chem. 2010;285:39953–39964. doi: 10.1074/jbc.M110.158063. [DOI] [PMC free article] [PubMed] [Google Scholar]
- 33.Takata R, Akamatsu S, Kubo M, Takahashi A, Hosono N, Kawaguchi T, et al. Genome-wide association study identifies five new susceptibility loci for prostate cancer in the Japanese population. Nat Genet. 2010;42:751–754. doi: 10.1038/ng.635. [DOI] [PubMed] [Google Scholar]
- 34.Long QZ, Du YF, Ding XY, Li X, Song WB, Yang Y, et al. Replication and fine mapping for association of the C2orf43, FOXP4, GPRC6A and RFX6 genes with prostate cancer in the Chinese population. PLoS One. 2012;7:e37866. doi: 10.1371/journal.pone.0037866. [DOI] [PMC free article] [PubMed] [Google Scholar]
- 35.Haiman CA, Han Y, Feng Y, Xia L, Hsu C, Sheng X, et al. Genome-wide testing of putative functional exonic variants in relationship with breast and prostate cancer risk in a multiethnic population. PLoS Genet. 2013;9:e1003419. doi: 10.1371/journal.pgen.1003419. [DOI] [PMC free article] [PubMed] [Google Scholar]
- 36.Pi M, Quarles LD. GPRC6A regulates prostate cancer progression. Prostate. 2012;72:399–409. doi: 10.1002/pros.21442. [DOI] [PMC free article] [PubMed] [Google Scholar]
- 37.Green MR, Gandhi MK, Courtney MJ, Marlton P, Griffiths L. Relative abundance of full-length and truncated FOXP1 isoforms is associated with differential NFkappaB activity in Follicular Lymphoma. Leuk Res. 2009;33:1699–1702. doi: 10.1016/j.leukres.2009.05.004. [DOI] [PubMed] [Google Scholar]
- 38.Feng J, Zhang X, Zhu H, Wang X, Ni S, Huang J. High expression of FoxP1 is associated with improved survival in patients with non-small cell lung cancer. Am J Clin Pathol. 2012;138:230–235. doi: 10.1309/AJCPDHQFNYJZ01YG. [DOI] [PubMed] [Google Scholar]
- 39.Santos ME, Athanasiadis A, Leitao AB, DuPasquier L, Sucena E. Alternative splicing and gene duplication in the evolution of the FoxP gene subfamily. Mol Biol Evol. 2011;28:237–247. doi: 10.1093/molbev/msq182. [DOI] [PMC free article] [PubMed] [Google Scholar]
- 40.Hoeller S, Schneider A, Haralambieva E, Dirnhofer S, Tzankov A. FOXP1 protein overexpression is associated with inferior outcome in nodal diffuse large B-cell lymphomas with non-germinal centre phenotype, independent of gains and structural aberrations at 3p14.1. Histopathology. 2010;57:73–80. doi: 10.1111/j.1365-2559.2010.03600.x. [DOI] [PubMed] [Google Scholar]
- 41.Ijichi N, Ikeda K, Horie-Inoue K, Inoue S. FOXP1 and estrogen signaling in breast cancer. Vitam Horm. 2013;93:203–212. doi: 10.1016/B978-0-12-416673-8.00006-X. [DOI] [PubMed] [Google Scholar]
- 42.Bates GJ, Fox SB, Han C, Launchbury R, Leek RD, Harris AL, et al. Expression of the forkhead transcription factor FOXP1 is associated with that of estrogen receptor-beta in primary invasive breast carcinomas. Breast Cancer Res Treat. 2008;111:453–459. doi: 10.1007/s10549-007-9812-4. [DOI] [PubMed] [Google Scholar]
- 43.Giatromanolaki A, Koukourakis MI, Sivridis E, Gatter KC, Harris AL, Banham AH. Loss of expression and nuclear/cytoplasmic localization of the FOXP1 forkhead transcription factor are common events in early endometrial cancer: relationship with estrogen receptors and HIF-1alpha expression. Mod Pathol. 2006;19:9–16. doi: 10.1038/modpathol.3800494. [DOI] [PubMed] [Google Scholar]
- 44.Takayama K, Horie-Inoue K, Ikeda K, Urano T, Murakami K, Hayashizaki Y, et al. FOXP1 is an androgen-responsive transcription factor that negatively regulates androgen receptor signaling in prostate cancer cells. Biochem Biophys Res Commun. 2008;374:388–393. doi: 10.1016/j.bbrc.2008.07.056. [DOI] [PubMed] [Google Scholar]
- 45.Toma MI, Weber T, Meinhardt M, Zastrow S, Grimm MO, Fussel S, et al. Expression of the Forkhead transcription factor FOXP1 is associated with tumor grade and Ki67 expression in clear cell renal cell carcinoma. Cancer Invest. 2011;29:123–129. doi: 10.3109/07357907.2010.535059. [DOI] [PubMed] [Google Scholar]
- 46.Pink RC, Wicks K, Caley DP, Punch EK, Jacobs L, Carter DR. Pseudogenes pseudo-functional or key regulators in health and disease. RNA (New York, NY) 2011;17:792–798. doi: 10.1261/rna.2658311. [DOI] [PMC free article] [PubMed] [Google Scholar]
- 47.Balasubramanian S, Zheng D, Liu YJ, Fang G, Frankish A, Carriero N, et al. Comparative analysis of processed ribosomal protein pseudogenes in four mammalian genomes. Genome Biol. 2009;10:R2. doi: 10.1186/gb-2009-10-1-r2. [DOI] [PMC free article] [PubMed] [Google Scholar]
- 48.Li W, Yang W, Wang XJ. Pseudogenes: pseudo or real functional elements? J Genet Genom. 2013;40:171–177. doi: 10.1016/j.jgg.2013.03.003. [DOI] [PubMed] [Google Scholar]
- 49.Poliseno L, Salmena L, Zhang J, Carver B, Haveman WJ, Pandolfi PP. A coding-independent function of gene and pseudogene mRNAs regulates tumour biology. Nature. 2010;465:1033–1038. doi: 10.1038/nature09144. [DOI] [PMC free article] [PubMed] [Google Scholar]
- 50.Han YJ, Ma SF, Yourek G, Park YD, Garcia JG. A transcribed pseudogene of MYLK promotes cell proliferation. FASEB J. 2011;25:2305–2312. doi: 10.1096/fj.10-177808. [DOI] [PMC free article] [PubMed] [Google Scholar]
- 51.Kalyana-Sundaram S, Kumar-Sinha C, Shankar S, Robinson DR, Wu YM, Cao X, et al. Expressed pseudogenes in the transcriptional landscape of human cancers. Cell. 2012;149:1622–1634. doi: 10.1016/j.cell.2012.04.041. [DOI] [PMC free article] [PubMed] [Google Scholar]
- 52.Chiefari E, Iiritano S, Paonessa F, Le Pera I, Arcidiacono B, Filocamo M, et al. Pseudogene-mediated posttranscriptional silencing of HMGA1 can result in insulin resistance and type 2 diabetes. Nature Commun. 2010;1:40. doi: 10.1038/ncomms1040. [DOI] [PubMed] [Google Scholar]