

Abstract
Study Objectives:
We examined the 1-y stability of four insomnia symptom profiles: sleep onset insomnia; sleep maintenance insomnia; combined onset and maintenance insomnia; and neither criterion (i.e., insomnia cases that do not meet quantitative thresholds for onset or maintenance problems). Insomnia cases that exhibited the same symptom profile over a 1-y period were considered to be phenotypes, and were compared in terms of clinical and demographic characteristics.
Design:
Longitudinal.
Setting:
Urban, community-based.
Participants:
Nine hundred fifty-four adults with Diagnostic and Statistical Manual of Mental Disorders, Fifth Edition based current insomnia (46.6 ± 12.6 y; 69.4% female).
Interventions:
None.
Measurements and results:
At baseline, participants were divided into four symptom profile groups based on quantitative criteria. Follow-up assessment 1 y later revealed that approximately 60% of participants retained the same symptom profile, and were hence judged to be phenotypes. Stability varied significantly by phenotype, such that sleep onset insomnia (SOI) was the least stable (42%), whereas combined insomnia (CI) was the most stable (69%). Baseline symptom groups (cross-sectionally defined) differed significantly across various clinical indices, including daytime impairment, depression, and anxiety. Importantly, however, a comparison of stable phenotypes (longitudinally defined) did not reveal any differences in impairment or comorbid psychopathology. Another interesting finding was that whereas all other insomnia phenotypes showed evidence of an elevated wake drive both at night and during the day, the “neither criterion” phenotype did not; this latter phenotype exhibited significantly higher daytime sleepiness despite subthreshold onset and maintenance difficulties.
Conclusions:
By adopting a stringent, stability-based definition, this study offers timely and important data on the longitudinal trajectory of specific insomnia phenotypes. With the exception of daytime sleepiness, few clinical differences are apparent across stable phenotypes.
Citation:
Pillai V, Roth T, Drake CL. The nature of stable insomnia phenotypes. SLEEP 2015;38(1):127–138.
Keywords: insomnia, nonrestorative sleep, phenotype, prospective, sleep maintenance, sleep onset
INTRODUCTION
Though conceptualizations and diagnostic criteria continue to evolve, the emerging consensus across all current nosologies is that insomnia is a disorder characterized by at least one nocturnal sleep symptom, as well as one daytime or waking symptom that is attributable to poor sleep.1–3 The sleep related symptoms of insomnia include sleep onset difficulties, sleep maintenance difficulties, or some combination thereof, which occur despite adequate opportunity and circumstance for sleep. Nonrestorative sleep (NRS) is typically included in this symptom complex, though some data suggest epidemiological and clinical differences between this symptom and other nocturnal symptoms of insomnia.4,5 This inherent heterogeneity in the phenomenology of insomnia has prompted the recognition of potential subtypes or phenotypes, such as sleep onset insomnia (SOI) and sleep maintenance insomnia (SMI), in both clinical and research settings.6–10 However, there have been few attempts to ascertain whether different clinical presentations truly represent distinct phenotypes of the disorder, or simply the current expression of insomnia disorder. Reliable longitudinal data on the symptom profiles of individuals with an established diagnosis of insomnia are needed to shed light on the validity of presumed phenotypes, help determine their within-person stability, and, potentially, offer insight into the clinical utility of such distinctions.
Presently, pharmacological interventions represent the first line of treatment for insomnia in medical settings.11 Clinical trials for hypnotic drugs routinely select participants based on phenotypes such as SOI or SMI. Further, in its labeling of these drugs, the US Food and Drug Administration differentially indicates certain drugs for sleep onset difficulties (e.g., zaleplon, ramelteon), others for sleep maintenance problems (doxepin, 3 mg and 6 mg), and some for both (e.g., eszopiclone, zolpidem ER).12,13 The American Academy of Sleep Medicine makes similar distinctions regarding the use of pharmacological agents in its standards of practice parameters in the treatment of insomnia.14 With respect to behavioral treatments, certain interventions such as relaxation training are targeted more toward sleep onset difficulties, whereas others including sleep restriction aim to improve both sleep onset and maintenance.15 Attempts to distinguish between putative phenotypes are also apparent in comorbidity research, with several studies concluding, for instance, that the SOI phenotype is more closely related to depression and anxiety than are others.7,9 The implication here is that the identification of specific insomnia phenotypes can guide preventive efforts focused on their unique clinical correlates.
All of the aforementioned clinical practices and research aims are predicated on the assumption that presenting insomnia symptoms at any given time represent stable phenotypes with valid boundaries. However, nearly all extant data on insomnia phenotypes are cross-sectional, and therefore offer only a state level snapshot of any distinct clinical or demographic characteristics.7,8,10 To the best of our knowledge, only two studies have explored the longitudinal trajectories of insomnia phenotypes. Hohagen et al.16 divided a sample of more than 300 patients seeking treatment for sleep disturbance in primary care settings across the Mannheim area of Germany into symptom-based groups (e.g., an SOI group that complained exclusively of sleep onset latencies (SOLs) greater than 30 min; an SMI group that reported only sleep maintenance difficulties with nocturnal awakenings greater than 30 min; as well as combinations of the aforementioned groups). Upon reassessment 4 mo later, they found that 49% of the SOI group and 83% of the SMI group endorsed a different phenotype, thus pointing to limited overall temporal stability. Though this study is an important landmark in the field, a number of methodological shortcomings limit the scope of reported findings. Inclusion in the study was based on four questions: “Do you have any sleep problem?”; “How long does it take you to fall asleep?”; “Do you wake up at night and then have difficulty falling asleep again?”; and “Do you wake up considerably earlier than desired?” Thus, there were no data on the frequency of sleep complaints (e.g., days/w), or on the presence of any resulting daytime impairments or distress. Similarly, the chronicity criterion used to validate sleep symptoms in this study was only 4 w. Recent longitudinal data17 show that the presence of sleep disturbance for 1 mo is not a reliable indicator of insomnia syndrome, as approximately 50% of such cases remit the following month; indeed, current diagnostic systems stipulate that symptoms last for at least 3 mo to earn an insomnia diagnosis.18 The results of this study may therefore be more applicable to sleep disturbance than to insomnia per se. Finally, though stability varied significantly across pheno-types, no explanations for this finding could be gleaned because there were few additional data regarding the clinical and demographic characteristics of different phenotypes.
A more recent study on the natural course of insomnia symptoms in two adult cohorts from Scotland had many of the same limitations with regard to diagnostic validity.19 During three of the five waves of data collection in this study, sleep disturbance was assessed based on two questions: “How often do you have trouble getting to sleep?” and “How often are you bothered by waking earlier than you would like to, or waking up in the middle of the night?” No quantitative criteria were applied to any reported sleep disturbances (e.g., SOL or total wake time after sleep onset [WASO]), rendering it difficult to compare these data with those from other studies. Further, although the SOI phenotype was the most stable of all reported phenotypes in the study by Hohagen et al., too few participants from the Scotland cohort consistently reported the SOI phenotype to avail reliable data on its temporal stability. Analyses pointed instead to three classes of insomnia symptoms: “episodic maintenance,” marked by discrete periods of sleep maintenance difficulties; a “developing” class of participants who experienced both sleep onset and maintenance difficulties as they aged; and a “chronic mixed” class who endorsed persistent problems with both sleep onset and maintenance.
Another systemic problem with previous findings is the limited or inconsistent application of empirically based quantitative criteria to define phenotypes. Though not required for a formal diagnosis of insomnia, quantitative thresholds for sleep symptoms are enumerated in the text of current diagnostic manuals.18,20 Based on a review of prior studies, Lichstein and colleagues found that a cutoff of 31 min for self-reported sleep disturbances such as SOL and WASO achieved the best sensitivity and specificity in diagnosing insomnia.21 However, with a few exceptions,8,22 most prior studies have not included such quantitative cutoffs, relying instead on subjective/qualitative complaints (e.g., “Do you have difficulty falling asleep at night?”).5,7,9,10 Quantitative criteria are especially vital to research to facilitate data comparison across studies and to enrich diagnostic assessment in the absence of a systematic clinical interview.
In summary, because of insufficient data, contradictory findings, and a lack of standardization in the assessment of key variables, it is largely unclear whether specific insomnia symptoms represent stable, trait level phenotypes. The current study seeks to fill this gap in the literature by analyzing prospective data from a large sample of adults with an established diagnosis of insomnia from the Evolution of Pathways to Insomnia Cohort.23 Extensive data on the nature and duration of sleep parameters, demographic characteristics, and daytime impairments such as sleepiness and depressive symptoms were obtained both at baseline as well as at a follow-up assessment 1 y hence. We examined whether these factors influenced the stability of baseline symptoms, and whether stable symptoms thus judged to be insomnia phenotypes differed significantly from one another on these variables. No a priori hypotheses were proposed given the paucity of extant empirical findings.
METHOD
Participants
The current data derive from an ongoing prospective investigation of a large community-based sample from southeastern Michigan; a detailed description of recruitment strategies and sample characteristics appears elsewhere.23 Briefly stated, we began recruitment by mailing invitation letters to a randomly generated list of individuals (n = 36,002) from a major Health Maintenance Organization database. A total of 7,608 of these individuals (21%) completed a web-delivered survey to assess eligibility for the current study (see Figure 1). Approximately 34% (n = 2,590) of these participants met criteria for current/ lifetime insomnia, and were invited to participate in the study. The study invitation appeared on the subsequent webpage of the online portal, followed by the baseline questionnaires (Time 1). Approximately 46% of eligible survey takers (n = 1,205) declined to participate, while the remainder (n = 1,385) completed the Time 1 assessment battery. Finally, 79% of this final sample (1,099/1,385) completed a follow-up assessment (Time 2) 1 y later.
Figure 1.

Flow of participants through the study.
Procedure and Measures
All study protocols were approved by the Henry Ford Hospital institutional review board. Participants completed the Time 1 assessment immediately after taking the diagnostic survey. Investigators sent email reminders to all participants approximately 1 mo prior to the Time 2 assessment. Both assessments took approximately 30 min to complete, and included the following measures.
Insomnia
Insomnia diagnoses based on the Diagnostic and Statistical Manual of Mental Disorders, Fifth Edition (DSM-5)18 were established using the following questions: “Have you experienced difficulty falling asleep?”; “Have you experienced difficulty staying asleep?”; “Have you experienced difficulty with nonrestorative sleep?” To meet diagnostic criteria, participants had to report experiencing one or more of these symptoms for at least 3 nights a week for a duration of 3 mo or longer. Further, they had to endorse daytime impairment or distress as measured by the following question: “To what extent do you consider your sleep problems to interfere with your daily functioning?” Responses were coded on a four-point Likert-type scale ranging from 0 (“not at all”) to 4 (“very much”), such that participants who reported a score of 2 (somewhat) or higher met that particular criterion.
Participants also self-reported the extent of sleep disturbance during the previous month: SOL, i.e., “On average (including weekends and weekdays), how long did it take you to fall asleep”; and WASO, i.e., “On average (including weekdays and weekends), how long are you awake during the night.” Total sleep time (TST) was assessed over an average weekday (“Thinking about your average weekday, how long did you actually sleep each night”), given the tendency of individuals with insomnia to engage in compensatory sleep (“sleeping in”) on the weekends.24 The chronicity of sleep problems was assessed via the following question: “how long have you had your sleep problem?” Any prescription/over-the-counter (OTC) medication use was assessed using the following questions: “In the past month, have you taken any prescription medications to help you sleep”; “In the past month, have you taken any OTC medications to help you sleep.” For each endorsed item, participants also reported the frequency of use: “On average, how many times per month do you take this medication.” Finally, participants self-reported which of the endorsed sleep symptoms they found “most bothersome.”
Insomnia Phenotypes
Insomnia cases were categorized as a particular phenotype if: (1) DSM-5 based diagnostic criteria were met at both baseline and follow-up assessments; (2) the same symptom or symptom complex was endorsed at both baseline and follow-up assessments; and (3) endorsed symptoms met previously validated quantitative criteria.8,21 Four phenotypes were defined: (1) SOI: SOL ≥ 31 min and WASO < 31 min; (2) SMI: SOL < 31 min and WASO ≥ 31 min; combined insomnia (CI): SOL ≥ 31 min and WASO ≥ 31 min; and neither criterion (NC): SOL < 31 min and WASO < 31 min. Thus, the SOI and SMI phenotypes only met quantitative criteria for SOL and WASO, respectively, the CI phenotype met quantitative criteria for both, and the NC phenotype met neither criterion. Note that the aforementioned phenotypes are distinguished in the remainder of this report from cross-sectional symptom-based groups: sleep onset symptoms (SOS); sleep maintenance symptoms (SMS); combined symptoms (CS); and neither symptom (NS).
Daytime Impairment
Participants completed the 16-item version of the Quick Inventory of Depressive Symptomatology (QIDS). The QIDS assesses the presence and persistence of depressive symptom-atology on a four-point (0 to 3) Likert-type scale. In a recent validation study, the QIDS exhibited excellent psychometric properties and concurrent validity.25 To minimize collinearity with insomnia, the sleep disturbance items from the QIDS were excluded from the scale. Participants self-reported anxiety levels using the Beck Anxiety Inventory (BAI),26 a 21-item questionnaire that assesses the severity of common anxiety symptoms on a four-point Likert-type scale. The Epworth Sleepiness Scale (ESS)27 was used to assess levels of daytime sleepiness, with overall scores of 10 or greater indicating excessive or clinically significant sleepiness. Finally, daytime impairments per Research Diagnostic Criteria (RDC)1 for insomnia were also assessed. Examples of RDC daytime impairment items are: “attention, concentration, or memory impairment”; “mood disturbance/irritability”; “daytime fatigue.” All such items were scored on a four-point Likert-type scale from 0 (none) to 3 (severe), and were summed to produce an overall daytime impairment score.
Comorbid Sleep Disorders
The Berlin Apnea Questionnaire (BAQ) was used to assess risk for obstructive sleep apnea (OSA).28 The BAQ identifies respondents at risk for OSA based on three categories of symptoms: snoring; daytime sleepiness and fatigue; obesity and hypertension. In a validation study, the BAQ achieved high sensitivity (86%) in identifying patients with OSA with a polysomnography-based apnea-hypopnea index greater than 5.29 Restless legs syndrome (RLS) was assessed using an empirically validated question set developed by the International RLS Study Group.30 Specifically, participants were identified to be at risk for RLS if they met the following diagnostic criteria: (1) urge to move the legs/uncomfortable or unpleasant feelings in the legs; (2) these symptoms occur during periods of rest/inactivity, such as while sitting or lying down; (3) these symptoms improve with walking; (4) these symptoms only occur during the evening/night.
Data Analysis
All statistical analyses were conducted using IBM SPSS Statistics for Windows – Version 19 (Armonk, NY).31 Univariate between-group comparisons for continuous measures were accomplished via independent samples t-tests, and by chi-square tests of independence for all categorical outcomes. Analysis of covariance (ANCOVA; continuous outcome) and logistic regression (dichotomous outcome) analyses were used as appropriate for estimating more complex models involving multiple factors or covariates. Given the extensive array of variables, covariates were selected for inclusion in omnibus models per recommendations outlined by Mickey and Greenland.32 Specifically, only those variables that were related to the dependent variable in univariate analyses at a significance level of P < 0.20 were retained in the final model.
RESULTS
A total of 431 participants from the initial sample did not meet criteria for a current insomnia diagnosis, and were hence excluded from all analyses (these participants endorsed a lifetime history of insomnia, but no longer met criteria). Baseline characteristics for the remaining sample of current patients with current insomnia (n = 954) appear in Table 1. The median duration of sleep problems in this group was 36 mo (mean = 72.8 ± 91.9 mo), suggesting that participants generally experienced chronic sleep symptoms. Consistent with the sex disparity in the prevalence of insomnia in the general population,33 female participants (∼69%) were over-represented in this sample. As for other demographic variables, the proportion of African Americans in the current sample (∼29%) was high with respect to representative census data for the United States (13%) but comparable to that for southeastern Michigan (25%).34 With regard to comorbid sleep disturbance, the proportion of participants at risk for OSA (∼31%) was comparable to the estimated prevalence of OSA (29–67%) in patients with insomnia in the general population.35 Similarly, the prevalence of RLS (∼7%) in the current sample was similar to population-based estimates (7–10%).36 A total of 320 participants from the initial sample of individuals with insomnia no longer met diagnostic criteria at follow-up, resulting in a remission rate of approximately 44% (320/736), which is consistent with existing data on the natural course of insomnia.37
Table 1.
Sample characteristics stratified by baseline insomnia symptom profile.

Stability of Insomnia Symptom Profiles
The baseline distribution of insomnia symptoms per quantitative criteria was as follows: 143 participants (15%) met SOS criteria; 194 (∼20%) met SMS criteria; 464 (∼49%) met CS criteria; and 153 (16%) met NS criteria. Baseline demographic and clinical characteristics for these groups appear in Table 1. Approximately 60% (n = 250) of participants whose insomnia persisted through Time 2 reported the same symptom profile as they did at Time 1; in other words, 60% of persistent insomnia cases exhibited a particular phenotype (see Figure 2). Stability varied as a function of baseline symptoms such that the baseline SOS group was the least likely (∼42%) to endorse the same symptoms at follow-up, whereas the CS group was the most likely (∼69%). Chi-square analyses testing the independence between symptom profile and stability were statistically significant (χ2 = 17.49, P < 0.01). Examination of the individual cells suggested that this effect was driven primarily by the SOS and CS groups; there were significantly more unstable cases of the SOS group (z = 2.3, P < 0.05) and significantly fewer unstable cases of the CS group (z = -2.0, P < 0.05) than expected per the null hypothesis. Thus, participants in the SOS group were significantly more likely to switch to a different symptom profile at Time 2 than to endorse the same one, whereas the opposite was true for the CS group.
Figure 2.

Distribution of symptoms among persistent insomnia cases at Time 2 by Time 1 symptom profile (n = 416). SOS, sleep onset symptoms; SMS, sleep maintence symptoms; CS, combined symptoms; NS, neither symptom.
Predictors of Symptom-Profile Stability
Between-group comparisons between the stable and unstable symptom profiles (collapsed across the four symptom profiles) revealed statistically significant differences in BAI scores and chronicity of sleep problems. Participants with a stable pheno-type (BAI: mean = 12.7 ± 10.5) reported significantly higher BAI scores (t = 2.18, P < 0.05) than those without one (BAI: mean = 10.6 ± 8.7). Chronicity of sleep problems was also significantly higher (t = 2.33, P < 0.05) among the stable pheno-types (mean = 81.5 mo ± 101.6) than the nonstable phenotypes (mean = 60.3 mo ± 72.2). There were no other group differences (see Table 2).
Table 2.
The stability of insomnia symptom profiles among persistent insomnia cases (n = 416).

To examine the independent effects of these variables (BAI scores, chronicity, symptom profile) on phenotype stability, we ran a logistic regression model with stability as the dependent variable, baseline symptom profile as the independent variable, and the following covariates: adjusted QIDS scores (P < 0.20 in univariate analysis), daytime impairment (P < 0.20 in univariate analysis), BAI scores, and chronicity of sleep problems. A test of the overall model with all predictors against a constant-only model was statistically significant (χ2 = 19.54, P < 0.01), indicating that this model reliably distinguished between stable and unstable cases. Similarly, the Hosmer-Lemeshow test revealed that this model fit the data well (χ2 = 9.61, P = 0.29). Baseline symptom profile was a significant predictor (P < 0.01). None of the other variables were significantly predictive of stability. Thus, type of symptom profile at baseline (i.e., SOS/SMS/CS/NRS) remained a significant predictor of symptom stability, even after controlling for anxiety symptoms and chronicity of sleep problems.
Insomnia Persistence at Follow-up as a Function of Baseline Symptom Profiles
Next, we examined whether specific baseline insomnia symptom profiles were differentially predictive of overall insomnia persistence (i.e., having insomnia at both baseline and follow-up). The prevalence of follow-up insomnia (i.e., persistent insomnia) was highest for the CS group (62.6%) and lowest for the NS group (42.4%), with the SMS (54.8%) and SOS (54.5%) groups falling in the middle. To examine whether this effect was driven by any underlying covariates, we ran a logistic regression model with follow-up insomnia as the dependent variable, and these covariates: age, sex, daytime impairment, and frequency of symptoms. A test of the overall model with all predictors against a constant-only model was statistically significant (χ2 = 100.25; P < 0.01), indicating that this model reliably distinguished between insomnia persistence and remission. Similarly, the Hosmer-Lemeshow test revealed that our model fit the data well (χ2 = 8.52, P = 0.39). Age (odds ratio [OR] = 1.03; 95% confidence interval: 1.02–1.04; P < 0.01), frequency of symptoms (OR = 1.24; 95% confidence interval: 1.10–1.39; P < 0.01), and degree of daytime impairment (OR = 1.08; 95% confidence interval: 1.06–1.11; P < 0.01) were significantly and positively associated with insomnia persistence. Sex was also a significant predictor (OR = 1.43; 95% confidence interval: 1.01–2.01; P < 0.01), such that women had significantly higher odds for insomnia persistence.
With respect to symptom profile, the SOS and CS groups were significantly associated with insomnia persistence, such that the odds of persistence for insomnia cases with these phenotypes were almost twice that for other cases (SOS: OR = 1.79; 95% confidence interval: 1.02–3.13; P < 0.05; CS: OR = 1.93; 95% confidence interval: 1.22–3.05; P < 0.01).
Insomnia Phenotype
The primary endpoint of the current study was to examine the stability of baseline symptom profiles as outlined previously. To further enrich these findings, however, we subsequently compared stable phenotypes (i.e., insomnia cases with the same symptom profile at baseline and follow-up) on various demographic and clinical measures.
Demographics
Characteristics of persistent insomnia cases stratified by phenotype appear in Table 3. An analysis of variance model with age as the outcome and phenotype as the independent variable revealed a statistically significant main-effect for age (F = 5.31; P < 0.01; partial η2 = 0.06). Post hoc analyses indicated that the SOI phenotype was significantly younger than the SMI (P < 0.05) and CI phenotypes (P < 0.05). Further, the SMI group was significantly older than the CI group (P < 0.01). The conditional distribution of race across phenotype revealed too few cases for “Asian” and “Other” in a number of cells for reliable chi-square analyses. The following analyses therefore assessed the independence between phenotype and race for the two most prevalent categories of the race variable: “Caucasian” and “African American (AA).” Analyses (χ2 = 17.83, P < 0.01) revealed a significantly higher proportion of AA in the CI phenotype group (z-residual = 2.0; P < 0.05), given the distribution of race in the overall sample; the same group had a significantly lower prevalence of the NC phenotype (z-residual = -2.4; P < 0.05). There was also significant sex disparity across phenotypes (χ2 = 16.55, P < 0.01), such that there were significantly more men in the NC group (z-residual = 2.6; P < 0.05) than expected given the sex composition of the overall sample. Marital status was unrelated to phenotype.
Table 3.
Persistent insomnia cases stratified by phenotype (n = 250).

Daytime Sleepiness
Preliminary analyses identified a significant association between ESS scores and race; a significant relationship did not emerge between ESS scores and any of the other variables. Hence, we ran an ANCOVA model with race as a covariate and phenotype as the independent variable. The overall model was statistically significant (Omnibus F = 5.55; P < 0.01; Adj. R2 = 0.07). Both race (F = 11.64; P < 0.01; partial η2 = 0.05) and phenotype (F = 4.89; P < 0.01; partial η2 = 0.06) were significantly related to daytime sleepiness. Post hoc tests revealed a significant difference between AAs (9.8 ± 5.1) and Caucasian Americans (8.1 ± 4.3) on the ESS. With respect to phenotype (see Table 3), post hoc analyses suggested that the NC phenotype had significantly higher ESS scores than both the SOI (P < 0.01) and CI phenotypes (P < 0.01). Further, the SMI phenotype reported significantly higher ESS scores than the SOI phenotype (P < 0.05). The SMI and NC phenotypes did not differ significantly. There was not a significant interaction between race and phenotype.
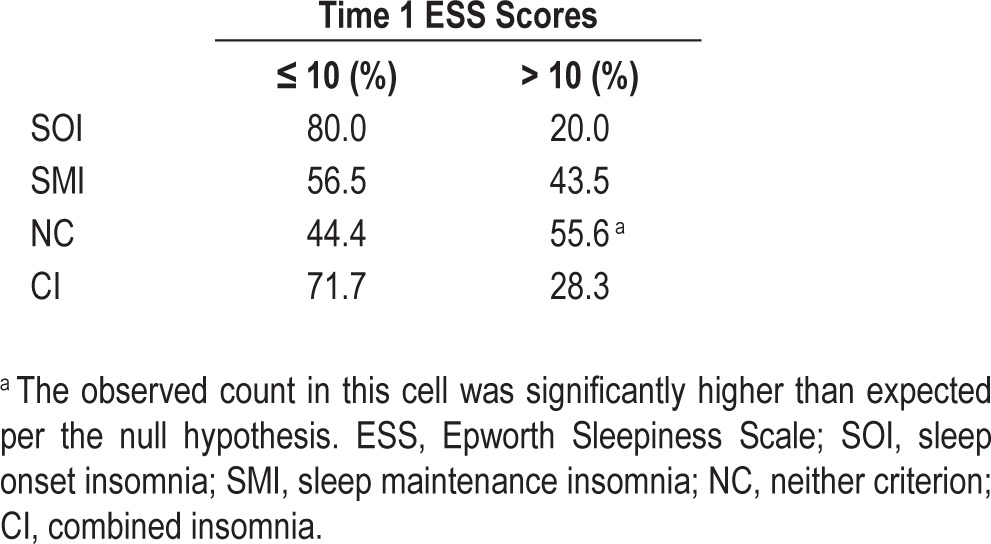
To further explore this finding, we assessed bivariate correlations between ESS scores and TST in each of the four phenotypes and in the overall sample. ESS scores were significantly correlated with TST in the NC group (Pearson r = -0.63; P < 0.01). Importantly, a significant association between TST and ESS scores did not emerge in the overall sample or in any of the other phenotypes (Overall sample: r = -0.03, P = 0.62; SOI: r = -0.26, P = 0.21; SMI: r = 0.03, P = 0.83; CI: r = 0.06, P = 0.42). To examine the clinical significance of these effects, we also examined the proportion of individuals who endorsed pathological levels of sleepiness per phenotype. Percentage of individuals who reported clinically significant or excessive daytime sleepiness (ESS > 10)38 was highest in the NC group (∼56%); see Table 4. Chi-square analyses (χ2 = 11.89, P < 0.01) testing the independence between phenotype and excessive sleepiness were statistically significant. Examination of standardized residuals within individual cells indicated that this effect was driven entirely by the NC phenotype; participants in this phenotype were significantly more likely to report excessive daytime sleepiness (z-residual = 2.0; P < 0.05).
Table 4.
Excessive daytime sleepiness across phenotypes (n = 255).
Sleep Disturbance
Frequency of sleep disturbance (operationalized as the response to the question, “How many days per week did you experience sleep problems?”) also varied as a function of phenotype. Accordingly, we ran an ANCOVA model with frequency as the dependent variable, phenotype as the independent variable, and age and adjusted QIDS scores as covariates. The overall model was statistically significant (Omnibus F = 4.95; P < 0.01; partial η2 = 0.09; Adj. R2 = 0.07). Adjusted QIDS scores and age were unrelated to frequency in the overall model. Importantly, there was a significant main effect of phenotype (F = 5.48; P < 0.05; partial η2 = 0.06). Post hoc analyses suggested the SMI phenotype (Table 3) reported significantly greater frequency than each of the other groups (P < 0.01).
Finally, with regard to the most bothersome sleep complaint (χ2 = 39.65, P < 0.01), analyses revealed as expected that the SOI and SMI phenotypes were significantly more likely to endorse sleep onset difficulties (48.0%; z-residual = 2.6; P < 0.05) and sleep maintenance difficulties (67.4%; z-residual = 2.3; P < 0.05) respectively. No particular symptom was significantly more likely to be endorsed than others in the CI phenotype. Critically, however, the NC phenotype was significantly more likely to endorse “NRS” as the most bothersome complaint (55.6%; z-residual = 2.1; P < 0.05).
Medication Use
There were no significant group differences in frequency of medication use (days/month). Similarly, prevalence (yes/no) of medication use did not vary significantly between groups, although an examination of cell counts suggested insufficient power to detect statistical significance.
Comorbid Sleep Disorders
The conditional distribution of OSA cases per phenotype revealed that the SOI phenotype had the lowest prevalence of probable OSA (16%). Prevalence rates in the SMI (39.1%) and NC (40.7%) groups were comparable, with lower rates in the CI group (30.9%). Chi-square analyses testing the independence of phenotype and OSA prevalence did not achieve statistical significance (χ2 = 6.00, P = 0.11). Because this null effect may be related to the low cell count for positive cases of OSA in the SOI phenotype, analyses were repeated with just the SMI, CI, and NC groups; no significant group differences emerged.
Given the low overall prevalence of RLS in the current sample, especially in the NC phenotype, valid chi-square analyses could not be conducted on all four phenotypes. As such, we only compared the SOI, SMI, and CI groups. Analyses did not reveal any significant group differences in the prevalence of RLS across the three aforementioned phenotypes.
Functional Impairment
ANCOVA models were used to compare the four phenotypes on various RDC-based indices of daytime impairment. No significant group differences emerged between phenotypes on any of the tested domains of daytime impairment. Similarly, adjusted QIDS scores and BAI scores did not differ significantly between groups.
Sensitivity Analyses
As noted, of the 954 insomnia cases at Time 1, 416 persisted at Time 2. However, an examination of the overall sample (n = 1,099) at Time 2 revealed 108 incident cases, resulting in a total of 524 insomnia cases (see Figure 1). The distribution of symptoms in this group was nearly identical to that for Time 1 individuals with insomnia: 14.8% reported SOS; 23.7% reported SMS; 46.0% reported CS; and 15.5% reported NS.
Finally, to assess the utility of phenotypes defined qualitatively, the baseline sample was also stratified based purely on qualitative, subjective complaints (i.e., “yes/no” responses to sleep symptom questions). This strategy proved highly nonspecific, because most participants endorsed experiencing all insomnia symptoms: difficulty falling asleep: 80.2%; difficulty staying asleep: 90.7%; NRS: 95.0%.
Cross-sectional Analyses of Baseline Insomnia Symptom Profiles
To contrast insomnia phenotypes from baseline insomnia symptoms, we repeated the aforementioned between-group phenotype analyses for baseline symptom profiles. To conserve space, only the statistically significant findings are reported here; full analyses with details regarding covariates and model fit are described in the supplemental material and are also summarized in Table 1.
Demographics
There were significantly more men (z-residual = 2.7; P < 0.05) in the NS group than expected per the sex distribution in the overall sample (χ2 = 12.39, P < 0.01). Further, AA were significantly less likely to fall in the NS group (z-residual = -2.8; P < 0.05), and significantly more likely to fall in the CS group (z-residual = 3.3; P < 0.05) than expected per the null hypothesis (χ2 = 33.07, P < 0.01). Marital status also varied across groups (χ2 = 46.77, P < 0.01), such that the SOS group was significantly less likely (z-residual = -2.0; P < 0.05) to be married than unmarried, whereas the opposite was true for the SMS group (z-residual = 2.6; P < 0.05). Finally, groups differed significantly on age (F = 12.04; P < 0.01; partial η2 = 0.04), with post hoc analyses suggesting that the SOS group was significantly younger than all other groups, and that the SMS group was significantly older than the SOS and CS groups (P < 0.01).
Medication Use
Prevalence (yes/no) of prescription medication use varied significantly between groups (χ2 = 11.01, P < 0.05), such that the SMS group was significantly less likely to report prescription medication use (z-residual = -2.1; P < 0.05). However, the relationship between symptom profile and prescription medication use was reduced to nonsignificance, when age and TST were included as covariates in analyses.
Comorbid Sleep Disorders
The prevalence of OSA varied significantly between groups (χ2 = 15.08, P < 0.01), such that the risk for OSA was significantly lower in the SOS group (z-residual = -2.2; P < 0.05).
Daytime Impairment
There was a significant between-group effect (F = 6.31; P < 0.01; partial η2 = 0.02) for daytime sleepiness, such that the NS group had significantly higher ESS scores than both the SOS (P < 0.01) and CS groups (P < 0.01). Further, the SMS group reported significantly higher ESS scores than the CS group (P < 0.05). The CS group reported significantly higher levels of RDC daytime impairment (F = 5.17; P < 0.01; partial η2 = 0.02; P < 0.01), adjusted QIDS scores (F = 2.67; P < 0.05; partial η2 = 0.01), and BAI scores (F = 4.36; P < 0.01; partial η2 = 0.01; P < 0.05) than all other groups.
DISCUSSION
Allusions to insomnia phenotypes can be traced all the way back to Nathaniel Kleitman's classic text, Sleep and Wakefulness, where he distinguished between initial or “predormitional” insomnia of sleep onset and “lacunary” or “intermittent” insomnia as that characterized by middle of the night awakenings (p. 275).39 However, few attempts have been made to systematically examine whether these symptoms represent stable, orthogonal phenotypes of the disorder; and if so, whether these phenotypes have distinct clinical correlates. The current study therefore examined the 1-y stability of baseline symptom profiles in a sample of adults with insomnia. Insomnia cases that exhibited the same symptom profile at baseline and follow-up were judged to be phenotypes, and were compared in terms of clinical and demographic characteristics.
Insomnia Phenotypes
Of the persistent insomnia cases, approximately 60% reported the same symptom profile at follow-up as they did at baseline. SOI was the least stable (∼40%) and CI was the most stable (∼70%) phenotype. Nevertheless, the distribution of symptoms across all insomnia cases identified at follow-up, including incident cases, was nearly identical to that at baseline. This was an intriguing finding because it suggests that although insomnia symptoms may vary over time within-person, the distribution of symptoms across a cross-section of insomniacs is preserved.
Type of phenotype was significantly predictive of symptom stability, even after controlling for chronicity of sleep problems, anxiety, and daytime impairment. Between-group differences between phenotypes were identified with respect to age, sex, racial composition, and daytime sleepiness. Importantly, phenotype differences varied depending on whether they were operationalized based on trait-like stability or on the cross-sectional definitions used in prior studies.
The NC Phenotype
In many respects, the NC phenotype was the most anomalous of all insomnia phenotypes. Despite significantly shorter SOLs and WASOs than the SOI and SMI phenotypes, respectively, the NC phenotype reported significantly higher levels of daytime sleepiness than all other phenotypes. It was the only phenotype with mean ESS scores in the clinically significant range (10.7 ± 4.0), with a median score of 11. This finding starkly contrasts a growing literature on insomnia as a 24-h disorder characterized by both nocturnal and daytime hyperarousal.40,41 Elevated levels of daytime sleepiness are not typically seen in the insomnia population; instead, fatigue, dysphoric mood, and general malaise are more commonly reported.20,42 Indeed, in a recent study of patients in a sleep disorders clinic, daytime alertness (ESS score < 9), along with quantitative sleep disturbance indices, showed high diagnostic specificity for insomnia.43
More objective assays of daytime sleepiness, such as the multiple sleep latency test (MSLT) also corroborate the hyper-arousal hypothesis. In a recent 8-mo clinical trial of zolpidem,44 individuals with insomnia exhibited significantly higher mean MSLTs than healthy controls at baseline. Importantly, in most patients with insomnia who had an elevated MSLT (> 11 min) at baseline, a follow-up MSLT 8 mo later was also similarly elevated in both the treatment group as well as the placebo group. These findings suggest that daytime hyperarousal is a stable correlate of insomnia, and is largely independent of the quality and duration of nocturnal sleep. Our data echo these findings for all phenotypes except the NC phenotype. A significant relationship did not emerge between habitual nocturnal sleep duration and daytime sleepiness for the SOI, SMI, or CI pheno-types. However, a robust inverse correlation (Pearson r = -0.63; P < 0.01) could be discerned between habitual nocturnal sleep time and daytime sleepiness in the NC phenotype, a finding more germane to normal sleepers.38 A number of intriguing questions therefore arise: What makes the NC phenotype more sleepy than other individuals with insomnia? Does this group truly represent an insomnia phenotype?
Admittedly, the NC phenotype in the current study was a category of exclusion much like NRS is a diagnosis of exclusion in many nosologies.2,3 By definition, any sleep disturbance participants with this phenotype reported did not meet quantitative thresholds for SOI or SMI. Further, analyses showed that 97% of individuals with the NC phenotype endorsed NRS as a symptom of their insomnia, and as a group rated NRS as the most bothersome sleep complaint. Thus, one possibility is that the NC phenotype in the current study represents NRS insomnia. The prevalence of the NC phenotype in the current study (6.5%) was nearly identical to that of NRS in a large epidemiological survey of individuals with insomnia (6.5% to 7.3%, depending on nosology33). Further, in a large population-based study of insomnia patients from 28 sleep centers across the United States,45 participants with an NRS-only complaint reported comparable levels of daytime impairment as did those with SOI, SMI, and CI. Consistent with these data, levels of daytime impairment did not differ significantly across pheno-types in the current study, suggesting that this phenotype can occur independently of other insomnia phenotypes and still exert a comparable burden on functioning. Finally, the 1-y stability (54%) of the NC phenotype was the second highest after the CI phenotype. Prior studies show that the NRS phenotype has high stability (78%) over relatively short (3-mo) assessment periods, with stability rates hovering closer (32%) to that found in the current study over longer follow-ups (∼5 y)5.
An alternative explanation is that the NC phenotype simply captured chronically sleep deprived individuals without insomnia. However, it is important to remember that though their symptoms did not meet quantitative thresholds, individuals with this phenotype did report difficulty falling and staying asleep. Further, though insomnia is a disorder marked by nocturnal and daytime wake drive, MSLT latencies for individuals with insomnia follow a normal distribution occupying the full range of the instrument (2–20 min).44 These data suggest that a proportion of individuals with insomnia are in fact sleepy. Therefore, invalidating the insomnia diagnosis of patients with an NC phenotype is problematic.
Note that the aforementioned conundrums in the identification and conceptualization of this phenotype are a direct reflection of the state of the science on NRS. There are currently no subjective or objective parameters for establishing a positive validation of NRS; it can only be identified by excluding competing possibilities.45,46 The current study, however, makes an important contribution to this literature by pointing out that: (1) a significant proportion of insomnia cases do not meet quantitative criteria for sleep onset and maintenance difficulties; (2) levels of daytime impairment are as high in these cases as others who do satisfy those criteria; (3) these individuals rate NRS as their chief complaint, and, importantly, report alarmingly high levels of daytime sleepiness. These data also indicate that insomnia treatments must go beyond traditional targets such as onset and maintenance, and address all clinical aspects including NRS.
The CI Phenotype
Consistent with prior data,19 this phenotype was the most prevalent (∼61%) of the identified insomnia phenotypes. When operationalized cross-sectionally per baseline data, this group appeared to suffer more impairment and morbidity than all other groups. They reported significantly greater daytime impairment, higher levels of comorbid anxiety, and higher levels of depressive symptoms. However, none of these effects persisted when a CI phenotype was defined based on combined onset and maintenance difficulties at both Time 1 and Time 2. Importantly, there were no significant differences between any of the phenotypes in relation to comorbid depression and anxiety.
With respect to demographic characteristics, AA in the current sample were significantly more likely to report CI, a finding also reported in the only prior study8 on racial differences in phenotypes. Research on racial/ethnic differences in overall insomnia, however, has yielded mostly mixed findings. Some studies suggest that AAs are less likely to report insomnia symptoms than are CA47,48, whereas others point out that the prevalence of insomnia among AAs is either no different or significantly higher depending on nosology.33 Thus, a more nuanced research approach may be warranted in future studies to account for these potential moderators and resolve current inconsistencies.
The SOI Phenotype
Though exclusive sleep onset difficulties were the least stable of all insomnia symptoms, they still conferred a significant risk for insomnia persistence. Specifically, the odds of insomnia persistence for baseline insomnia cases with a sleep onset-only complaint were nearly twice that for other cases. Though this finding may seem paradoxical at first glance, the composition of this group at the follow-up assessment offers a viable explanation. Figure 2 shows that in addition to sleep onset difficulties, a significant proportion of this group also exhibited combined insomnia symptoms (30%) at Time 2. Thus, relative to sleep maintenance, sleep onset difficulties may serve as a “gateway” symptom to the more chronic and phenomenologically diffuse form of insomnia disorder. These data are thus consistent with the Scotland cohort study,19 which was unable to identify an SOI phenotype per se, because this clinical presentation is especially likely to be adulterated with other symptoms in the long term.
The SMI Phenotype
Relative to the SOI phenotype, fairly reliable data emerged in support of a stable SMI phenotype of insomnia disorder. This phenotype showed a 1-y stability of 54%, and was significantly older than the SOI and CI phenotypes. Further, the average weekly frequency of insomnia symptoms was significantly higher (median: 6 days/w) for this phenotype than all other phenotypes. The prevalence of the SMI phenotype in the current sample was lower than that reported in a prior community-based study8. Note, however, that their sample was significantly older than the current sample, and, as such, the higher prevalence of SMI may be a function of the well-established age-related reduction in sleep consolidation. Overall, this group appears to represent a relatively stable insomnia phenotype, characterized by chronic sleep continuity problems associated with age and comorbid sleep disorders.
Limitations and Future Directions
In the current study, insomnia symptoms were operationalized based on self-report, and were not verified via more objective methods, such as actigraphy or polysomnography. Such methods can further elucidate the insomnia phenotypes discussed here. Early morning awakenings are often assessed as part of an insomnia diagnosis, but were not included in the current study. However, there are currently no quantitative criteria to identify this particular symptom, and, further, it can be subsumed under sleep maintenance given that it essentially reflects the inability to sustain sleep for a desired duration.8,21 We were also unable to determine whether and what proportion of the sample received active treatment for their insomnia between baseline and follow-up. For instance, treatment may have contributed to the reduced SOLs and/or WASOs reported by the NC group. However, any effects of treatment will have likely affected all groups equally, as evidenced by the fact that medication use, a proxy for treatment, did not vary significantly between phenotypes. Similarly, because participants with chronic medical conditions were not excluded from the current sample, medical comorbidities may have potentially contaminated reported findings. Importantly, however, medical comorbidities are the norm and not the exception among individuals with insomnia in the general population.49 As such, we believe the current study has high external validity. Finally, the low incidence of depression and anxiety at the Time 2 follow-up assessment in the current study did not afford the requisite power to examine any differential longitudinal outcomes of insomnia phenotypes. Although there were no cross-sectional differences in comorbid depression and anxiety in the current sample, larger cohorts with longer follow-up periods can help examine whether the risk for incident psychopathology varies by phenotype.
The aforementioned limitations notwithstanding, we believe the current study offers novel and timely data on the stability of insomnia phenotypes. Perhaps the most provocative result was that differences between insomnia phenotypes thus far reported in the literature were only apparent in the current study when phenotypes were defined cross-sectionally. A more rigorous, stability-based operationalization of phenotypes did not reveal support for any clinically significant differences between phenotypes, except with regard to daytime sleepiness. Our data also point out that relying on subjective complaints in the absence of quantitative criteria leads to a diffuse, imperfect classification of phenotypes. Thus, we believe this study offers many clear and empirically grounded directives for future research on insomnia phenotypes.
DISCLOSURE STATEMENT
This study was supported by an NIMH Grant (R01 MH082785) and an investigator initiated research award from Merck & Co, both to Dr. Christopher L. Drake. Dr. Roth has served as consultant for Abbott, Accadia, AstraZenca, Aventis, AVER, Bayer, BMS, Cypress, Ferrer, Glaxo Smith Kline, Impax, Intec, Jazz, Johnson and Johnson, Merck, Neurocrine, Novartis, Proctor and Gamble, Pfizer, Purdue, Shire, Somaxon, Transcept; has received research support from Cephalon, Merck, and Transcept; and has served on speakers bureau for Purdue. Dr. Drake has served as consultant for Teva; has received research support from Merck and Teva; and has served on speakers bureau for Jazz, Purdue, and Teva. Dr. Pillai indicated no financial conflicts of interest.
ABBREVIATIONS
- AA
African American
- BAI
Beck Anxiety Inventory
- BAQ
Berlin Apnea Questionnaire
- CI
combined insomnia
- CS
combined symptoms
- ESS
Epworth Sleepiness Scale
- MSLT
multiple sleep latency test
- NC
neither criterion
- NRS
nonrestorative sleep
- NS
neither symptom
- OR
odds ratio
- OSA
obstructive sleep apnea
- OTC
over-the-counter
- QIDS
Quick Inventory of Depressive Symptomatology
- RDC
Research Diagnostic Criteria
- RLS
restless legs syndrome
- SMI
sleep maintenance insomnia
- SMS
sleep maintenance symptoms
- SOI
sleep onset insomnia
- SOLs
sleep onset latencies
- SOS
sleep onset symptoms
- TST
total sleep time
- WASO
wake time after sleep onset
SUPPLEMENTAL MATERIAL
Cross-sectional Analyses of Baseline Insomnia Symptom Profile
Demographics
Chi-square analyses examining the independence between gender and symptom profile was statistically significant (χ2 = 12.39, P < 0.01). Examination of the conditional distribution for gender indicated that there were significantly fewer women (z-residual = 2.7; P < 0.05) in the NS group than expected per the gender distribution in the overall sample. With respect to race, there were too few cases of “Asian” and “Other” for several symptom groups; hence, only the “African American” and “White” races were compared across symptom groups. Chi-square analyses were significant (χ2 = 33.07, P < 0.01), such that African Americans were significantly less likely to fall in the NS group (z-residual = -2.8; P < 0.05), and significantly more likely to fall in the CS group (z-residual = 3.3; P < 0.05) than expected per the null hypothesis. Marital status also varied across groups (χ2 = 46.77, P < 0.01), such that the SOS group was significantly less likely (z-residual = -2.0; P < 0.05) to be married than unmarried, whereas the opposite was true for the SMS group (z-residual = 2.6; P < 0.05). Finally, groups differed significantly on age (F = 12.04; P < 0.01; partial η2 = 0.04), with post-hoc analyses suggesting that the SOS group was significantly younger than all other groups, and that the SMS group was significantly older than the SOS and CS groups (all P-values < 0.01).
Sleep Disturbance
Frequency of sleep disturbance did not vary significantly across groups. With regard to the most bothersome sleep complaint (χ2 = 112.1, P < 0.01), analyses revealed as expected that the SOS and SMS phenotypes were significantly more likely to endorse sleep onset difficulties (42.0%; z-residual = 4.5; P < 0.05) and sleep maintenance difficulties (64.4%; z-residual = 4.0; P < 0.05) respectively. Importantly, the NS group was significantly more likely to endorse “non-refreshing sleep” as the most bothersome complaint (41.8%; z-residual = 2.3; P < 0.05).
Daytime Sleepiness
We ran an ANCOVA model with race and TST as covariates and ESS scores as the dependent variable. The overall model was statistically significant (F = 5.80; P < 0.01; partial η2 = 0.03). Both race (F = 10.06; P < 0.01; partial η2 = 0.01) and TST (F = 4.48; P < 0.05; partial η2 = 0.01) were significant predictors. There was a main effect for group (F = 6.31; P < 0.01; partial η2 = 0.02), with post-hoc tests suggesting that the NS group had significantly higher ESS scores than both the SOS (P < 0.01) and CS groups (P < 0.01). Further, the SMS group reported significantly higher ESS scores than the CS group (P < 0.05). The SMS and NS groups did not differ significantly. There was not a significant interaction between race and phenotype.
Medication Use
Prevalence (yes/no) of prescription medication use varied significantly between groups (χ2 = 11.01, P < 0.05), such that the SMS group was significantly less likely to report prescription medication use (z-residual = -2.1; P < 0.05). However, the relationship between symptom profile and prescription medication use was reduced to non-significance when age and sleep disturbance were included as covariates in analyses. However, frequency of prescription medication use (days/month) was not significantly different across groups. Neither prevalence nor frequency of OTC medication use was different across groups.
Comorbid Sleep Disorders
The prevalence of OSA varied significantly between groups (χ2 = 15.08, P < 0.01), such that the risk for OSA was significantly lower in the SOS group (z-residual = -2.2; P < 0.05). The prevalence of RLS did not vary significantly across groups.
Daytime Impairment
An ANCOVA model with adjusted QIDS scores as the dependent variable, baseline symptom profile as the independent variable, and gender and daytime impairments as covariates fit the data well (F = 146.11; P < 0.01; partial η2 = 0.44). Daytime impairment was significantly related to QIDS scores (F = 681.70; P < 0.01; partial η2 = 0.42). There was a significant main effect for symptom profile (F = 2.67; P < 0.05; partial η2 = 0.01), such that the CS group reported significantly higher levels of depressive symptoms than the SMI group (P < 0.01), though the effect size was small. An ANCOVA model with overall impairment as the dependent variable, and age, ESS scores, and adjusted QIDS scores as covariates was statistically significant (F = 148.02; P < 0.01; partial η2 = 0.48). Age (F = 23.74; P < 0.01; partial η2 = 0.02), ESS scores (F = 65.50; P < 0.01; partial η2 = 0.07), and QIDS scores (F = 617.53; P < 0.01; partial η2 = 0.38) were all significantly related to daytime impairment. There was a significant main effect for symptom group even after controlling for these covariates (F = 5.17; P < 0.01; partial η2 = 0.02). Post-hoc analyses suggested that the CS group reported significantly higher levels of daytime impairment than all other groups (all P-values < 0.01).
The overall ANCOVA model with BAI scores as the dependent variable, and age, gender, and adjusted QIDS scores as covariates was statistically significant (F = 96.85; P < 0.01; partial η2 = 0.38). There were significant main effects for gender (F = 11.06; P < 0.01; partial η2 = 0.01); QIDS scores (F = 490.34; P < 0.01; partial η2 = 0.34), and symptom group (F = 4.36; P < 0.01; partial η2 = 0.01). Post-hoc analyses showed that the CS group reported significantly higher levels of anxiety than all other groups (all P-values < 0.05); there were no other group differences. With respect to gender, women reported significantly higher scores than did men (P < 0.01).
REFERENCES
- 1.Edinger JD, Bonnet MH, Bootzin RR, et al. Derivation of research diagnostic criteria for insomnia: report of an American Academy of Sleep Medicine Work Group. Sleep. 2004;27:1567–96. doi: 10.1093/sleep/27.8.1567. [DOI] [PubMed] [Google Scholar]
- 2.American Academy of Sleep Medicine. 2nd ed. Westchester IL: American Academy of Sleep Medicine; 2005. International Classification of Sleep Disorders: Diagnostic and Coding Manual. [Google Scholar]
- 3.American Psychiatric Association. Text Revision. 4th ed. Washington, DC: American Psychological Association; 2000. Diagnostic and Stastical Manual of Mental Disorders. [Google Scholar]
- 4.Buysse DJ. Insomnia. JAMA. 2013;309:706–16. doi: 10.1001/jama.2013.193. [DOI] [PMC free article] [PubMed] [Google Scholar]
- 5.Zhang J, Lam SP, Li SX, Li AM, Wing YK. The longitudinal course and impact of non-restorative sleep: a five-year community-based follow-up study. Sleep Med. 2012;13:570–6. doi: 10.1016/j.sleep.2011.12.012. [DOI] [PubMed] [Google Scholar]
- 6.Lichstein K, Taylor DJ, McCrae CS, Ruiter ME. Insomnia: epidemiology and risk factors. In: Kryger MH, Roth T, Dement WC, editors. Principles and Practice of Sleep Medicine. 5th ed. Philadelphia: W B Saunders; 2011. pp. 827–37. [Google Scholar]
- 7.Bixler EO, Kales A, Soldatos CR, Kales JD, Healey S. Prevalence of sleep disorders in the Los Angeles metropolitan area. Am J Psychiatry. 1979;136:1257–62. doi: 10.1176/ajp.136.10.1257. [DOI] [PubMed] [Google Scholar]
- 8.Taylor DJ, Lichstein KL, Durrence HH, Reidel BW, Bush AJ. Epidemiology of insomnia, depression, and anxiety. Sleep. 2005;28:1457–64. doi: 10.1093/sleep/28.11.1457. [DOI] [PubMed] [Google Scholar]
- 9.Yokoyama E, Kaneita Y, Saito Y, et al. Association between depression and insomnia subtypes: a longitudinal study on the elderly in Japan. Sleep. 2010;33:1693–702. doi: 10.1093/sleep/33.12.1693. [DOI] [PMC free article] [PubMed] [Google Scholar]
- 10.Kim K, Uchiyama M, Okawa M, Liu X, Ogihara R. An epidemiological study of insomnia among the Japanese general population. Sleep. 2000;23:41–7. [PubMed] [Google Scholar]
- 11.NIH State of the Science Conference Statement on Manifestations and Management of Chronic Insomnia in Adults Statement. J Clin Sleep Med. 2005;1:412–21. [PubMed] [Google Scholar]
- 12.Morin CM, Benca R. Chronic insomnia. Lancet. 2012;379:1129–41. doi: 10.1016/S0140-6736(11)60750-2. [DOI] [PubMed] [Google Scholar]
- 13.Walsh JK, Roth T. Pharmacological treatment of insomnia: benzodiazapine receptor agonists. In: Kryger MH, Roth T, Dement WC, editors. Principles and Practice of Sleep Medicine. 5th ed. Philadelphia: W B Saunders; 2011. pp. 905–15. [Google Scholar]
- 14.Sateia MJ, Buysse D. Treatment guidelines for insomnia. In: Kryger MH, Roth T, Dement WC, editors. Principles and Practice of Sleep Medicine. 5th ed. Philadelphia: W B Saunders; 2011. pp. 931–7. [Google Scholar]
- 15.Morin CM. Psychological and behavioral treatments for insomnia I: approaches and efficacy. In: Kryger MH, Roth T, Dement WC, editors. Principles and Practice of Sleep Medicine. 5th ed. Philadelphia: W B Saunders; 2011. pp. 866–83. [Google Scholar]
- 16.Hohagen F, Kappler C, Schramm E, Riemann D, Weyerer S, Berger M. Sleep onset insomnia, sleep maintaining insomnia and insomnia with early morning awakening--temporal stability of subtypes in a longitudinal study on general practice attenders. Sleep. 1994;17:551–4. [PubMed] [Google Scholar]
- 17.Morin CM, Leblanc M, Ivers H, et al. Monthly fluctuations of insomnia symptoms in a population-based sample. Sleep. 2014;37:319–26. doi: 10.5665/sleep.3406. [DOI] [PMC free article] [PubMed] [Google Scholar]
- 18.American Psychiatric Association. 5th ed. Arlington, VA: American Psychiatric Publishing, Inc; 2013. Diagnostic and Statistical Manual of Mental Disorders. [Google Scholar]
- 19.Green MJ, Espie CA, Hunt K, Benzeval M. The longitudinal course of insomnia symptoms: inequalities by sex and occupational class among two different age cohorts followed for 20 years in the west of Scotland. Sleep. 2012;35:815–23. doi: 10.5665/sleep.1882. [DOI] [PMC free article] [PubMed] [Google Scholar]
- 20.American Academy of Sleep Medicine. 3rd ed. Darien, IL: American Academy of Sleep Medicine; 2014. International Classification of Sleep Disorders. [Google Scholar]
- 21.Lichstein KL, Durrence HH, Taylor DJ, Bush AJ, Riedel BW. Quantitative criteria for insomnia. Behav Res Ther. 2003;41:427–45. doi: 10.1016/s0005-7967(02)00023-2. [DOI] [PubMed] [Google Scholar]
- 22.Drake CL, Vargas I, Roth T, Friedman NP. Quantitative measures of nocturnal insomnia predict greater deficits across multiple daytime impairment domains. Behav Sleep Med. 2014 Mar 11; doi: 10.1080/15402002.2014.880345. [Epub ahead of print] [DOI] [PMC free article] [PubMed] [Google Scholar]
- 23.Pillai V, Roth T, Mullins H, Drake CL. Moderators and mediators of the relationship between stress and insomnia: stressor chronicity, cognitive intrusion, and coping. Sleep. 2014;37:1199–208. doi: 10.5665/sleep.3838. [DOI] [PMC free article] [PubMed] [Google Scholar]
- 24.Jefferson CD, Drake CL, Scofield HM, et al. Sleep hygiene practices in a population-based sample of insomniacs. Sleep. 2005;28:611–5. doi: 10.1093/sleep/28.5.611. [DOI] [PubMed] [Google Scholar]
- 25.Rush AJ, Trivedi MH, Ibrahim HM, et al. The 16-Item Quick Inventory of Depressive Symptomatology (QIDS), clinician rating (QIDS-C), and self-report (QIDS-SR): a psychometric evaluation in patients with chronic major depression. Biol Psychiatry. 2003;54:573–83. doi: 10.1016/s0006-3223(02)01866-8. [DOI] [PubMed] [Google Scholar]
- 26.Beck AT, Steer RA. Beck Anxiety Inventory Manual. San Antonio, TX: Psychological Corporation; 1993. [Google Scholar]
- 27.Johns MW. A new method for measuring daytime sleepiness: the Epworth sleepiness scale. Sleep. 1991;14:540–5. doi: 10.1093/sleep/14.6.540. [DOI] [PubMed] [Google Scholar]
- 28.Netzer NC, Stoohs RA, Netzer CM, Clark K, Strohl KP. Using the Berlin Questionnaire to identify patients at risk for the sleep apnea syndrome. Ann Intern Med. 1999;131:485–91. doi: 10.7326/0003-4819-131-7-199910050-00002. [DOI] [PubMed] [Google Scholar]
- 29.Sharma SK, Vasudev C, Sinha S, Banga A, Pandey RM, Handa KK. Validation of the modified Berlin questionnaire to identify patients at risk for the obstructive sleep apnoea syndrome. Indian J Med Res. 2006;124:281–90. [PubMed] [Google Scholar]
- 30.Allen RP, Picchietti D, Hening WA, Trenkwalder C, Walters AS, Montplaisi J. Restless legs syndrome: diagnostic criteria, special considerations, and epidemiology. A report from the restless legs syndrome diagnosis and epidemiology workshop at the National Institutes of Health. Sleep Med. 2003;4:101–19. doi: 10.1016/s1389-9457(03)00010-8. [DOI] [PubMed] [Google Scholar]
- 31.IBM SPSS Statistics for Windows, Version 19.0. Armonk, NY: IBM Corporation; 2010. [Google Scholar]
- 32.Mickey RM, Greenland S. The impact of confounder selection criteria on effect estimation. Am J Epidemiol. 1989;129:125–37. doi: 10.1093/oxfordjournals.aje.a115101. [DOI] [PubMed] [Google Scholar]
- 33.Roth T, Coulouvrat C, Hajak G, et al. Prevalence and perceived health associated with insomnia based on DSM-IV-TR; International Statistical Classification of Diseases and Related Health Problems, Tenth Revision; and Research Diagnostic Criteria/International Classification of Sleep Disorders, Second Edition criteria: results from the America Insomnia Survey. Biol Psychiatry. 2011;69:592–600. doi: 10.1016/j.biopsych.2010.10.023. [DOI] [PubMed] [Google Scholar]
- 34.United States Census Bureau. (U.S. Government) 2010 Census of Population & Housing. 2014.
- 35.Ong JC, Crisostomo MI. The more the merrier? Working towards multidisciplinary management of obstructive sleep apnea and comorbid insomnia. J Clin Psychol. 2013;69:1066–77. doi: 10.1002/jclp.21958. [DOI] [PMC free article] [PubMed] [Google Scholar]
- 36.Gamaldo CE, Earley CJ. Restless legs syndrome: a clinical update. Chest. 2006;130:1596–604. doi: 10.1378/chest.130.5.1596. [DOI] [PubMed] [Google Scholar]
- 37.Morin CM, Belanger L, LeBlanc M, et al. The natural history of insomnia: a population-based 3-year longitudinal study. Arch Intern Med. 2009;169:447–53. doi: 10.1001/archinternmed.2008.610. [DOI] [PubMed] [Google Scholar]
- 38.Roehrs T, Carskadon MA, Dement WC, Roth T. Daytime sleepiness and alertness. In: Kryger MH, Roth T, Dement WC, editors. Principles and Practice of Sleep Medicine. 5th ed. Philadelphia, PA: W B Saunders; 2011. pp. 42–53. [Google Scholar]
- 39.Kleitman N. Sleep and Wakefulness. Chicago, IL: University of Chicago Press; 1987. [Google Scholar]
- 40.Bonnet MH, Arand DL. 24-hour metabolic rate in insomniacs and matched normal sleepers. Sleep. 1995;18:581–8. doi: 10.1093/sleep/18.7.581. [DOI] [PubMed] [Google Scholar]
- 41.Bonnet MH, Arand DL. Heart rate variability in insomniacs and matched normal sleepers. Psychosom Med. 1998;60:610–5. doi: 10.1097/00006842-199809000-00017. [DOI] [PubMed] [Google Scholar]
- 42.Roth T, Roehrs T, Rosenthal L. Measurement of sleepiness and alertness: multiple sleep latency test. In: Chokroverty S, editor. Sleep Disorders Medicine. Basic Science, Technical Considerations, and Clinical Aspects. Boston, MA: Butterworth Heinemann; 1999. pp. 223–9. [Google Scholar]
- 43.Severson CA, Tsai WH, Ronksley PE, Pendharkar SR. Identification of insomnia in a sleep center population using electronic health data sources and the insomnia severity index. J Clin Sleep Med. 2013;9:655–60. doi: 10.5664/jcsm.2830. [DOI] [PMC free article] [PubMed] [Google Scholar]
- 44.Roehrs TA, Randall S, Harris E, Maan R, Roth T. MSLT in primary insomnia: stability and relation to nocturnal sleep. Sleep. 2011;34:1647–52. doi: 10.5665/sleep.1426. [DOI] [PMC free article] [PubMed] [Google Scholar]
- 45.Roth T, Zammit G, Lankford A, et al. Nonrestorative sleep as a distinct component of insomnia. Sleep. 2010;33:449–58. doi: 10.1093/sleep/33.4.449. [DOI] [PMC free article] [PubMed] [Google Scholar]
- 46.Stone KC, Taylor DJ, McCrae CS, Kalsekar A, Lichstein KL. Nonrestorative sleep. Sleep Med Rev. 2008;12:275–88. doi: 10.1016/j.smrv.2007.12.002. [DOI] [PubMed] [Google Scholar]
- 47.Grandner MA, Petrov ME, Rattanaumpawan P, Jackson N, Platt A, Patel NP. Sleep symptoms, race/ethnicity, and socioeconomic position. J Clin Sleep Med. 2013;9:897–905. doi: 10.5664/jcsm.2990. [DOI] [PMC free article] [PubMed] [Google Scholar]
- 48.Ruiter ME, DeCoster J, Jacobs L, Lichstein KL. Sleep disorders in African Americans and Caucasian Americans: a meta-analysis. Behav Sleep Med. 2010;8:246–59. doi: 10.1080/15402002.2010.509251. [DOI] [PubMed] [Google Scholar]
- 49.Bonnet MH, Burton GG, Arand DL. Physiological and medical findings in insomnia: implications for diagnosis and care. Sleep Med Rev. 2014;18:111–22. doi: 10.1016/j.smrv.2013.02.003. [DOI] [PubMed] [Google Scholar]