

Abstract
Study Objectives:
Dexmedetomidine is used clinically to induce states of sedation that have been described as homologous to nonrapid eye movement (NREM) sleep. A better understanding of the similarities and differences between NREM sleep and dexmedetomidine-induced sedation is essential for efforts to clarify the relationship between these two states. This study tested the hypothesis that dexmedetomidine-induced sedation is homologous to sleep.
Design:
This study used between-groups and within-groups designs.
Setting:
University of Michigan.
Participants:
Adult male Sprague Dawley rats (n = 40).
Interventions:
Independent variables were administration of dexmedetomidine and saline or Ringer's solution (control). Dependent variables included time spent in states of wakefulness, sleep, and sedation, electroencephalographic (EEG) power, adenosine levels in the substantia innominata (SI), and activation of pCREB and c-Fos in sleep related forebrain regions.
Measurements and Results:
Dexmedetomidine significantly decreased time spent in wakefulness (-49%), increased duration of sedation (1995%), increased EEG delta power (546%), and eliminated the rapid eye movement (REM) phase of sleep for 16 h. Sedation was followed by a rebound increase in NREM and REM sleep. Systemically administered dexmedetomidine significantly decreased (-39%) SI adenosine levels. Dialysis delivery of dexmedetomidine into SI did not decrease adenosine levels. Systemic delivery of dexmedetomidine did not alter c-Fos or pCREB expression in the horizontal diagonal band, or ventrolateral, median, and medial preoptic areas of the hypothalamus.
Conclusions:
Dexmedetomidine significantly altered normal sleep phenotypes, and the dexmedetomidine-induced state did not compensate for sleep need. Thus, in the Sprague Dawley rat, dexmedetomidine-induced sedation is characterized by behavioral, electrographic, and immunohistochemical phenotypes that are distinctly different from similar measures obtained during sleep.
Citation:
Garrity AG, Botta S, Lazar SB, Swor E, Vanini G, Baghdoyan HA, Lydic R. Dexmedetomidine-induced sedation does not mimic the neurobehavioral phenotypes of sleep in sprague dawley rat. SLEEP 2015;38(1):73–84.
Keywords: adenosine, anterior hypothalamus, in vivo microdialysis, substantia innominata
INTRODUCTION
Understanding the relationship between sleep and anesthesia is a challenging problem for basic and clinical neuroscience.1–3 General anesthesia is administered to approximately 60,000 patients per day in the United States, and in no case is it understood how anesthetics cause a loss of waking consciousness.2,3 The brain mechanisms causing disordered sleep experienced by 50 to 70 million Americans also remain incompletely understood.4 Elucidating the similarities and differences between anesthesia, sedation, and sleep can contribute to a mechanistic understanding of these states3,5 and to studies of consciousness.6,7
Reports suggest that states of anesthesia either can8,9 or cannot10–12 compensate for loss of nonrapid eye movement (NREM) sleep, depending on the anesthetic drug. Similarities and differences between sleep and anesthesia also vary as a function of drug dose. One clinically important drug that has been studied within the context of sleep and anesthesia is the alpha-2 adrenergic receptor agonist dexmedetomidine. Systemic administration of dexmedetomidine produces dose-dependent states of sedation in humans13 and rats.14 Administering dexmedetomidine into rat locus coeruleus also causes sedation,15 and intracellular recordings show that dexmedetomidine opens inwardly rectifying K+ channels that hyperpolarize and silence the discharge of locus coeruleus neurons.16 The finding that dexmedetomidine depresses both wakefulness and excitability of locus coeruleus neurons parallels earlier discoveries that locus coeruleus neurons cease discharging during sleep17 and begin firing again prior to the resumption of wakefulness.18
Low-dose dexmedetomidine decreases wakefulness and promotes a NREM sleep-like electroencephalogram (EEG) in rats,19 mice,20 and humans.21–23 Higher doses of dexmedetomidine are used for pediatric sedation24 and to reduce postoperative analgesic requirement in adults.25 The current study used three sets of experiments designed to test the hypothesis that dexmedetomidine-induced sedation is homologous to NREM sleep. In relation to reports that loss of NREM sleep is8,9 or is not10–12 compensated for by anesthesia, the first set of experiments quantified the percent of time spent in states of wakefulness, NREM sleep, rapid eye movement (REM) sleep, and sedation every hour for 48 h after systemic administration of dexmedetomidine. As reviewed elsewhere,26,27 considerable data support the conclusion that adenosine promotes sleep. Disruption of sleep by opioids28,29 is mediated, in part, by an opioid-induced decrease in adenosine levels within the substantia innominata region of the basal forebrain.30 Thus, a second series of studies measured adenosine levels in the substantia innominata before and after administering dexmedetomidine, systemically or by microdialysis delivery directly into the substantia innominata. A final set of experiments used immunohistochemical techniques to determine if dexmedetomidine-induced sedation was accompanied by activation of sleep-promoting regions of rat brain. These experiments quantified activation of pCREB and c-Fos in sleep related brain regions after systemic administration of dexmedetomidine. Considered together, the results of studies using behavioral, EEG, neurochemical, and anatomical measures provided a robust test of the hypothesis that dexmedetomidine-induced sedation is homologous to NREM sleep.
MATERIALS AND METHODS
Animals and Drug Preparation
Adult, male Crl:CD (SD) (Sprague Dawley) rats (250–350 g; n = 40) were purchased from Charles River Laboratories, housed in a 12:12-h light-dark cycle, and kept for a minimum of 1 week before being used for experiments. Procedures were reviewed and approved by the University of Michigan Committee on the Use and Care of Animals. Experiments adhered to the Guide for the Care and Use of Laboratory Animals (Eighth Edition, National Academy of Sciences Press, Washington, DC, 2011).
The sedative/hypnotic dexmedetomidine hydrochloride (Precedex, Tocris Bioscience) was prepared immediately before each experiment and administered systemically by intraperitoneal (i.p.) injection or by dialysis delivery into the basal forebrain. For systemic administration, dexmedetomidine was dissolved in sterile saline (pH 6.3 ± 0.2) and injected (i.p.) in a volume of approximately 1 mL. Injection of saline provided a vehicle control condition. For dialysis delivery, dexmedetomidine (100 μM) was dissolved in Ringer's solution composed of 146 nM NaCl, 2.0 mM KCl, 2.4 mM CaCl2, and 10 μM erythro-9-(2-hydroxy-3-nonyl)adenosine (EHNA, Sigma Aldrich), an adenosine deaminase inhibitor. Dialysis with Ringer's solution was used as a vehicle control.
Surgical Procedures, Systemic Drug Administration, and Recordings of Sleep and Sedation
Rats (n = 7) were anesthetized with isoflurane in 100% oxygen.31,32 A water-filled heating pad was used to maintain core body temperature at 36–37°C. As described elsewhere,31,32 rats were implanted with electrodes for recording the EEG and electromyogram (EMG). Three days after surgery, rats were conditioned for 7 days to handling and to the recording environment. During habituation, rats were tethered via a cable for recording EEG and EMG.
Rats were injected (i.p.) with saline or dexmedetomidine (0.1, 0.3, or 0.5 mg/kg) at light onset (08:00). Injections into the same rat were separated by a 2-week interval. Our previous studies of dexmedetomidine33 found that “intraperito-neal administration of dexmedetomidine (0.01 mg/kg) reliably induced sedation as judged by the loss of righting response.” Loss of righting response in rodents provides an accepted surrogate marker for loss of consciousness.9,34,35 This response parallels clinical data in humans indicating that a 0.01 mg/ kg loading dose infused intravenously provides an onset of procedural sedation within 10 to 15 min. The current doses, ranging from 10 to 50 times higher than 0.01 mg/kg, thus reliably produced sedation.
Multiple criteria were used to identify and differentiate states of sedation and NREM sleep. The criteria for rodent monitoring were guided by, and homologous to, standards established by the American Society of Anesthesiologists. Those guidelines advocate that during “moderate or deep sedation, the adequacy of ventilation shall be evaluated by continual observation of qualitative clinical signs and monitoring for the presence of exhaled carbon dioxide unless precluded or invalidated by the nature of the patient, procedure, or equipment.”36 States of NREM sleep and sedation were clearly differentiated by behavior (Figure 1), responsiveness to external stimuli, and by breathing, as dexmedetomidine causes significant decreases in respiratory rate.33
Figure 1.

Sleep behavior and the temporal distribution of sleep and wakefulness were disrupted by dexmedetomidine. Photographs of a rat during sleep after saline administration (A) and during sedation caused by dexmedetomidine (B) illustrate postural differences. C through H plot time-course of wakefulness, nonrapid eye movement (NREM) sleep or sedation, and rapid eye movement (REM) sleep for 48 h after injection (time zero on abscissa). The 12:12 light:dark cycle is indicated below the time line. Histograms summarize data from three rats representative of the group data observed after systemic administration of saline (C,E,G) or dexmedetomidine (D,F,H). REM sleep was eliminated and wakefulness was dramatically reduced for 18 h after dexmedetomidine administration.
Electrographic recordings began immediately after injection and continued for 48 h. Dexmedetomidine causes a significant decrease in core body temperature.37 To avoid sedation-induced hypothermia,37 rats were placed on a heating blanket and core body temperature was maintained between 36 and 37°C. EEG and EMG signals were filtered (EEG 0.3 to 30 Hz; EMG 10 to 100 Hz), digitized (128 Hz), and recorded using Icelus Data Acquisition Software.38 Dexmedetomidine-induced sedation in rat is characterized by a dose-dependent slowing of EEG frequency and increase in EEG amplitude (see Figure 2 in the study by Bol et al.39). An experimenter who was blind to the drug condition scored each 10-s epoch of the 48-h recording as wakefulness, NREM sleep, REM sleep, or sedation. A second experimenter independently scored each recording of sleep and wakefulness. There was 91% agreement in behavioral state scoring between experimenters. The 91% concurrence between two independent evaluators of the electrographic traits used to score states was within two percentage points of prior sleep recordings from rat30 and mouse40 that were independently scored by two experimenters. The 91% agreement between two independent scorers who each identified sleep/wake states and dexmedetomidine-induced sedation based on electrographic data is greater than the scoring agreement reported for some sleep medicine fellows41 and for automated sleep scoring systems.42
Figure 2.
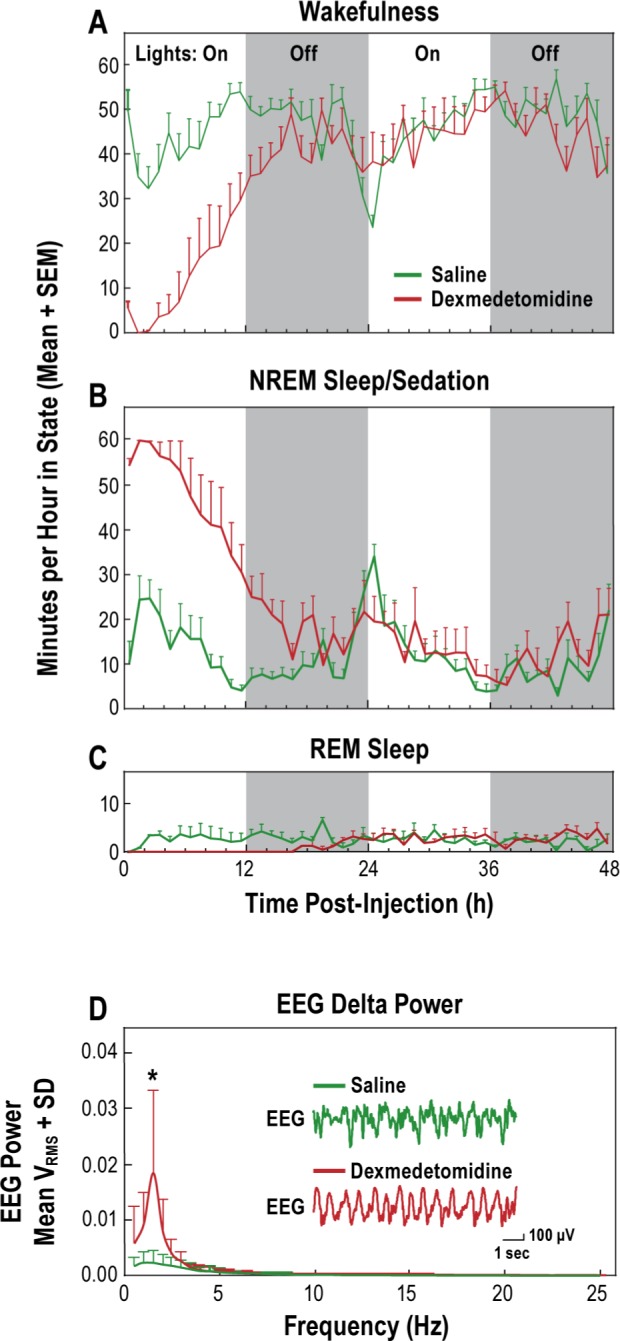
Dexmedetomidine disrupted the sleep/wakefulness cycle and increased electroencephalogram (EEG) delta power. Minutes per hour that rats spent in states of wakefulness (A), nonrapid eye movement sleep/sedation (B), and rapid eye movement sleep (C) are plotted as a function of time after systemic administration of saline or dexmedetomidine (0.3 mg/kg). The graph shows average EEG power (D) after systemic administration of saline or dexmedetomidine (0.3 mg/kg). Representative traces of raw EEG appear as insets.
Measurement of Adenosine Levels in the Substantia Innominata Region of the Basal Forebrain after Systemic Administration of Dexmedetomidine
These experiments were designed to quantify adenosine levels after i.p. administration of dexmedetomidine (0.3 mg/kg; n = 7 rats) or saline (n = 3 rats). Rats were anesthetized and placed in a stereotaxic frame as described previously.28,31,32 A craniotomy was created and a guide cannula was implanted above the substantia innominata using stereotaxic atlas coordinates of 1.6 mm posterior, 2.5 mm lateral, and 8.7 mm ventral to bregma.43 EEG and EMG recording electrodes also were implanted. Rats were allowed to recover from surgery for at least 3 days before beginning 1 week of habituation to a recording chamber. Thirteen hours before the experiment began (19:00) rats were connected to the recording cable, and a CMA/11 microdialysis probe with a membrane length of 1 mm (CMA Microdialysis) was inserted into the brain through the guide cannula. This 13-h interval allowed adenosine levels to stabilize44 and enabled the collection of dialysis samples to begin immediately at light onset the following day (08:00). The dialysis probe was perfused with Ringer's solution at 2.0 μL/min using a CMA/400 syringe pump. Microdialysis samples (30 μL) were collected every 15 min and injected into a high-performance liquid chromatography system coupled to a UV-Vis detector (wavelength 254 nm). As described,29,30 the concentration of adenosine (nM) was quantified with ChromGraph software (Bioanalytical Systems) using a five-point standard curve. Beginning at light onset, four microdialysis samples were collected, then dexmedetomidine or saline was injected (i.p.) and 16 dialysis samples were collected during the next 4 h. After completion of the experiment, the dialysis probe was removed and rats were returned to their home cages. Comparing preexperiment and postexperiment measurement of adenosine standards confirmed that measured changes in dialyzed adenosine were not an artifact of changes in the dialysis probe membrane.30
Quantification of Adenosine Levels in the Substantia Innominata During Dialysis Delivery of Dexmedetomidine
Microdialysis drug delivery has been shown to provide a powerful technique for identifying brain sites of drug action.28–32 If the effects of a systemically administered drug are replicated by dialysis delivery of that same drug into a specific brain region, then one may identify that brain region as a site of systemic drug action. The purpose of the experiments that used microdialysis drug delivery was to determine whether dexmedetomidine alters adenosine levels by direct actions within the substantia innominata. As described previously, anesthesia was induced and rats (n = 3) were placed in a stereotaxic frame. A microdialysis probe was aimed for the substantia innominata and delivered isoflurane concentration was reduced to 1.5% for the remainder of the experiment. Adenosine concentrations were allowed to stabilize for 2 h during dialysis with Ringer's solution, then microdialysis samples were collected every 15 min for 1 h. These four samples provided control levels of adenosine. A liquid switch was then activated to initiate dialysis with Ringer's solution containing dexmedetomidine (100 μM), and microdialysis samples were collected for 4 h. Isoflurane was not a confounding variable because it was present during measurement of adenosine during control conditions and during dialysis delivery of dexmedetomidine. Only approximately 5% of a drug concentration delivered by dialysis reaches the brain due to characteristics of the dialysis probe membrane.29–31,45,46 After the last dialysis sample was obtained, the probe was removed from the brain and the incision was closed. Isoflurane delivery was discontinued and rats were monitored until ambulatory.
Histological Localization of Dialysis Sites
Each rat was deeply anesthetized prior to decapitation and brain removal. Brains were sectioned coronally into 40 μm sections using a cryostat (Leica Microsystems). Sections were serially slide-mounted, fixed in paraformaldehyde vapor (80°C), stained with cresyl violet, and digitized using a Nikon Super Coolscan 4000 scanner. Dialysis sites were localized by comparing stained sections with a rat brain atlas.43 Microdialysis data from each rat were included in the group statistics only if the microdialysis membrane had been located in the substantia innominata.
Quantification of pCREB and c-Fos Expression in Brain Regions that Regulate States of Sleep and Wakefulness
Before immunohistochemical experiments, rats were habituated to being handled for 5 days. After habituation, rats were injected (i.p.) with dexmedetomidine (0.5 mg/kg) or saline (vehicle control). For pCREB labeling, rats were decapitated 20 min after administration of dexmedetomidine (n = 5) or saline (n = 5). The pCREB assay was performed as published.47,48 Brains were removed, fixed in 4% formalin for a minimum of 48 h, and cryoprotected with 30% sucrose in 4% formalin for 3 to 5 days. Brains were sectioned coronally at 30 μm. Sections were rinsed in 0.1M phosphate buffered saline (PBS), and incubated in 0.3% hydrogen peroxide for 15 min, 50% ethanol for 45 min, and 1.5% normal goat serum (NGS; Vector Laboratories) in 0.1M PBS for 1 h. Thereafter, sections were incubated overnight with anti-pCREB rabbit antibody (1:1000, Millipore) in 1.5% NGS in 0.1M PBS at 4°C. The next morning, tissues were incubated in biotinylated goat antirabbit immunoglobulin G (IgG) secondary antibody (1:200, Vector Laboratories) in 1.5% NGS in 0.1M PBS at room temperature and treated with avidin-biotin-peroxidase complex (1:1000 Vectastain ABC Kit Elite, Standard, Vector Laboratories) for 1 h. Between each of the aforementioned incubations, sections were rinsed twice for 5 min each in 0.1M PBS+Triton (PBS+T). To visualize the immunoreaction, tissue was placed in 0.1M PBS+T containing 0.06% diaminobenza-dine (DAB), 2.5% ammonium nickel sulfate, 0.2% d-glucose, 0.04% ammonium chloride, and 0.004% glucose oxidase for 2 min. Sections were float-mounted onto gelatin-subbed glass slides, air-dried, counterstained, and coverslipped using Per-mount (Fisher Scientific).
The assay for c-Fos expression was performed according to a published protocol.49 During dexmedetomidine-induced sedation, rats were placed on a heating pad to maintain core body temperature. Sixty-five min after administration of dexmedetomidine (n = 5) or saline (n = 5), rats were deeply anesthetized with 70 mg/kg sodium pentobarbital and perfused transcardially with cold, heparinized 4% formalin in 0.1M PBS. Brains were removed, fixed in 4% formalin in 0.1M PBS at 4°C, and cryoprotected in 20% sucrose in 0.1M PBS for 48 h. Brains were then sectioned at 25 μm, rinsed in 0.1M PBS, and incubated in 0.5% hydrogen peroxide for 30 min at 4°C, in 0.1M PBS containing 0.5% Triton X-100 for 1 h, and 0.1M PBS containing 10% NGS and 0.2% Triton X-100 at 4°C for 30 min. Sections were incubated in anti-c-Fos (Ab-5) polycolonal antibody (1:20000, Calbiochem) in 0.1M PBS with 0.1% Triton X-100 and 0.1% sodium azide for 72 h. Sections were then incubated in biotinylated goat anti-rabbit IgG (1:500 dilution) in 1.5% NGS in 0.1M PBS for 1 h, and treated with avidin-biotin-peroxidase complex (1:1000, Vectastain ABC Kit Elite, Standard, Vector Laboratories) for 90 min at room temperature. To visualize the immunoreaction, tissues were placed in 0.05M Tris-HCl buffer containing 0.025% DAB, 0.0027% hydrogen peroxide, and 0.06% nickel ammonium sulfate for 4 min. Sections were float-mounted, dried, counterstained, and coverslipped using Permount. In order to test the specificity of immunolabeling for pCREB and c-Fos, a group of brain sections underwent the same protocols previously described without the primary antibodies included in their respective incubation solutions.
A rat brain atlas43 was used to identify five brain regions in which the percentage of cells that was immunopositive for pCREB and c-Fos was quantified. These brain regions (and their bregma ranges) included the locus coeruleus (LC) (-9.48 to -10.32), horizontal diagonal band (HDB) (1.08 to -1.56), medial preoptic area (MPA) (0.48 to -1.44), median preoptic nucleus (MnPO) (0.48 to -0.24), and ventrolateral preoptic nucleus (VLPO) (0.00 to -0.60). All sections were examined microscopically and digitized using Microsuite 5 Biological Suite imaging software (Olympus). All cells in a 130 × 108 μm area were counted in each brain region and the number of pCREB and c-Fos labeled cells was determined. The number of pCREB and c-Fos activated neurons was quantified as a percentage of total neurons within the counting area. Two experimenters who were blinded to the experimental condition independently performed all cell counting.
Statistics
Data were analyzed with the Center for Statistical Consultation and Research at the University of Michigan using SAS v9.2 (SAS Institute Inc.) and Prism 5 (Graph Pad Software, Inc.). Repeated measures two-way analysis of variance (ANOVA) with autoregressive (AR1) correlation structure and Dunnett post hoc tests were used to compare the amount of time spent in wakefulness, NREM sleep, REM sleep, and sedation caused by i.p. injection of dexmedetomidine (0.3 mg/kg) or saline (see Figure 2A-2C).
Fast Fourier transform (FFT) was used to quantify EEG power in 0.5 Hz frequency bins ranging from 0.1 to 25 Hz after i.p. administration of dexmedetomidine (0.3 mg/kg) and saline (see Figure 2D). Repeated-measures ANOVA with unequal variances for the two treatment conditions (saline versus dexmedetomidine) was used to evaluate differences in EEG power at each frequency bin analyzed for each 0.5 Hz increment from 0 to 10 Hz (abscissa of Figure 2D).
Multiple dialysis samples were collected from every rat during i.p. injection of saline or dexmedetomidine. Because of the lack of independence between multiple microdialysis samples collected from the same rat, measures of adenosine were expressed as the mean adenosine level for each rat during i.p. administration of saline or dexmedetomidine. After the adenosine values were expressed in this way, repeated-measures ANOVA and Bonferroni multiple comparisons tests were used to compare adenosine levels measured after i.p. administration of saline or dexmedetomidine (see Figure 3C).
Figure 3.
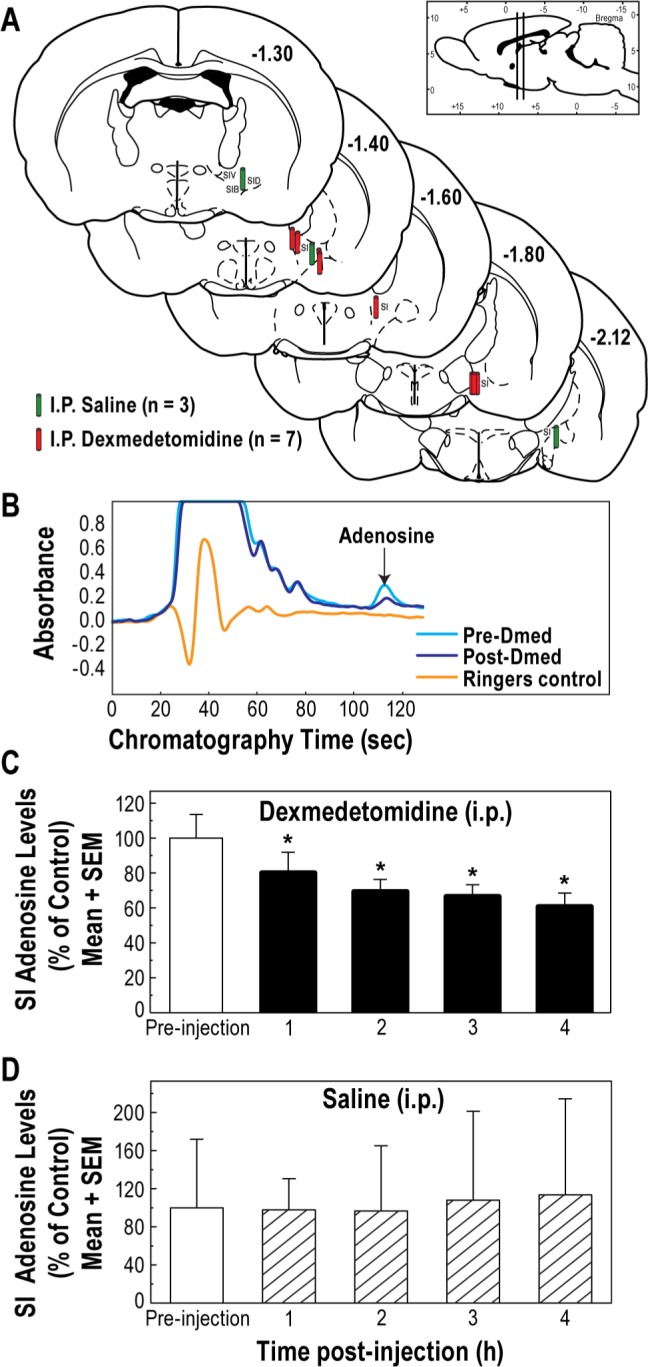
Adenosine levels in the substantia innominata (SI) region of the basal forebrain were decreased by intraperitoneal (i.p.) administration of dexmedetomidine, but not saline. Coronal brain sections (A) summarize histologically confirmed microdialysis sites from which adenosine was measured after systemic administration of saline (green cylinders) and dexmedetomidine (red cylinders). Colored cylinders represent the dialysis membranes and are drawn to scale. The vertical bars in the sagittal section at the top right indicate the anterior-to-posterior range of the dialysis sites. Representative chromatograms (B) show a peak caused by adenosine before (pre-Dmed) and after (post-Dmed) systemic administration of dexmedetomidine. The Ringer's chromatogram demonstrates the absence of any eluting peak that could be confused with adenosine. (C) SI adenosine levels during one hour before (preinjection) and for 4 h after systemic administration of dexmedetomidine. Asterisks indicate a statistically significant decrease in adenosine relative to preinjection levels. (D) Systemic administration of saline did not significantly alter SI adenosine levels.
A second series of neurochemical experiments also involved microdialysis measurement of adenosine levels in the substantia innominata. For these experiments, adenosine was measured while simultaneously dialyzing the substantia innominata with Ringer's solution alone (control) and Ringer's solution containing dexmedetomidine. Similar to the data shown in Figure 3, adenosine measures from these experiments were averaged and expressed as mean adenosine level for each rat. Paired Student t-test was used to compare adenosine levels during dialysis with Ringer's solution (control) and dialysis with Ringer's solution containing dexmedetomidine (see Figure 4C).
Figure 4.
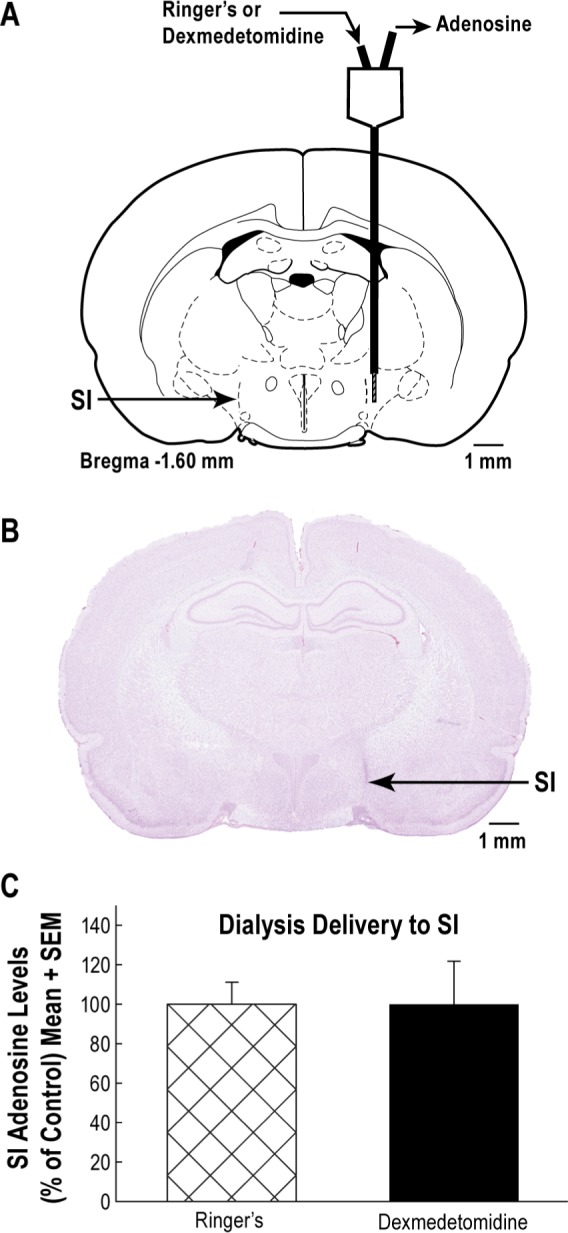
Microdialysis delivery of dexmedetomidine into the substantia innominata (SI) did not alter levels of adenosine in the SI. (A) Schematic of a dialysis probe perfused with Ringer's solution (control) or Ringer's solution containing dexmedetomidine (100 μM). Endogenous adenosine was collected at the outflow tube of the probe. All dialysis sites were histologically confirmed to be within the SI region. (B) A digitized coronal section containing a representative dialysis site within the SI region. (C) There was no significant difference in SI adenosine levels during dialysis with dexmedetomidine or Ringer's solution.
Counts of c-Fos and pCREB labeled cells after i.p. administration of dexmedetomidine or saline were compared by brain region using a Wilcoxon two-sample test (see Table 1). SAS software made it possible to adjust the underlying statistical model to account for the lack of independence between brain regions.
Table 1.
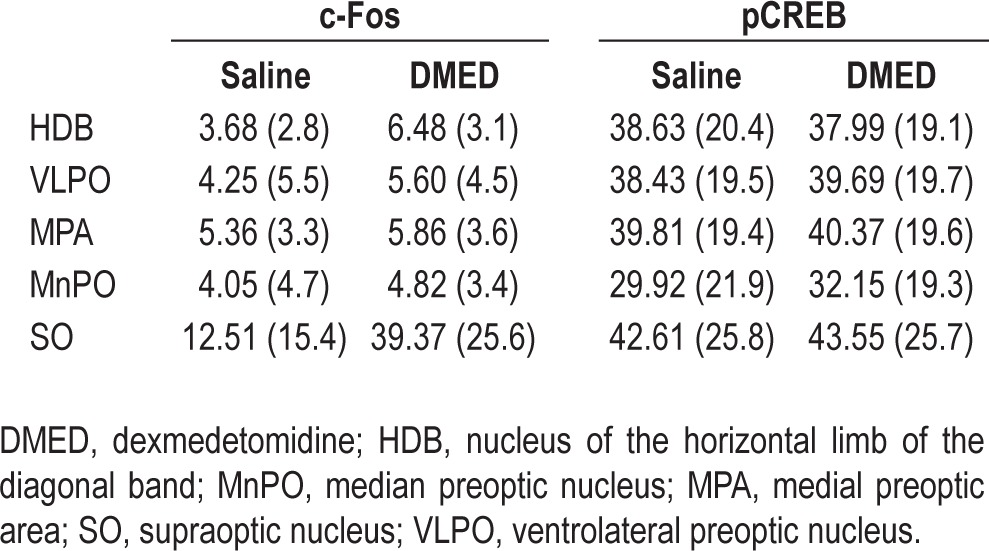
Mean percent (standard deviation) labeled cells by brain region after systemic administration of saline or dexmedetomidine
RESULTS
The Behavioral Phenotypes of Sedation and Sleep Differ
Continual observation of “qualitative clinical signs”36 clearly differentiated between sedation and sleep. Doses of dexmedetomidine as low as 0.01 mg/kg cause significant reductions in respiratory rate.33 All doses of dexmedetomidine administered in the current study caused a depression in rate of breathing that was much more pronounced than reductions in respiratory rate during NREM sleep. During sleep after saline injection, rats displayed behavioral phenotypes (Figure 1A) of curled body posture and eyelid closure that are typical of normal sleep.50 In contrast, behavioral phenotypes of sedation included open eyes, sprawling limbs, and extended tail (Figure 1B). Figure 1C-1H illustrates the 48-h effects of a single injection of saline and dexmedetomidine (0.3 mg/kg i.p.) on the temporal distribution of wakefulness, NREM sleep or sedation, and REM sleep for three representative rats.
Dexmedetomidine caused a dose-dependent decrease in time to loss of righting. Average latency to loss of righting as a function of dose was 17.6 min for 0.1 mg/kg, 14 min for 0.3 mg/kg, and 7.6 min for 0.5 mg/kg. During dexmedetomidine-induced sedation, rats were either unresponsive or exhibited only brief and obtunded responses to auditory or tactile stimuli. During NREM and REM sleep, rats displayed a distinctly different response to similar tactile and auditory stimuli that was characterized by immediately arousing and resuming active movement. A final behavioral criterion that clearly distinguished between states of sedation and NREM sleep was the duration of both diminished responsiveness to stimuli and the absence of locomotion. These traits were always significantly longer than the duration of immobility characteristic of normal rat sleep. Increasing doses of dexmedetomidine caused increased duration of behavioral obtundation and immobility (3 h 16 min after 0.1 mg/kg; 5 h 6 min after 0.3 mg/kg; and 6 h 28 min after 0.5 mg/kg.
Dexmedetomidine Disrupted the Temporal Organization of Sleep and Increased EEG Delta Power
Figure 2 summarizes the effects of administering saline or dexmedetomidine (0.3 mg/kg i.p.) on wakefulness, NREM sleep or sedation, REM sleep, and EEG power for all rats (n = 7). These group data illustrate the number of minutes per hour spent in each state of consciousness for 48 h after injection. Data for the three time-course plots (Figure 2A-2C) were analyzed in 12-h blocks and show that dexmedetomidine depressed wakefulness, increased time spent in sedation compared to time spent in NREM sleep, and eliminated REM sleep. FFT analysis of the EEG (Figure 2D) revealed that dexmedetomidine increased delta power. Significant main effects identified by ANOVA are described in the next paragraphs.
During the first light period (hour 1 to 12 postinjection) dexmedetomidine caused a significant (P = 0.0001) decrease in wakefulness (Figure 2A), caused a corresponding increase in sedation (Figure 2B, P = 0.0001), and disrupted the temporal organization of sleep by completely eliminating the REM phase (Figure 2C). There was also a significant effect of time post-injection on wakefulness (Figure 2A, P = 0.0002) and NREM sleep/sedation (Figure 2B, P = 0.0001) during the first light period.
During the first dark period after injection (hour 13 to 24), dexmedetomidine continued to suppress wakefulness (Figure 2A, P = 0.0003), produce sedation (Figure 2B, P < 0.0001) and inhibit REM sleep (Figure 2C, P = 0.0008). In hours 13–24 there was also a significant effect of time postinjection on wakefulness (Figure 2A, P = 0.04) and NREM sleep/sedation (Figure 2B, P < 0.05). REM sleep was completely eliminated until 16 hours after administration of dexmedetomidine, as reflected by a significant (P < 0.02) time-by-treatment interaction (Figure 2C).
In the second 12-h lights-on interval (hour 25 to 36), the amount of time spent in wakefulness (Figure 2A), NREM sleep/sedation (Figure 2B), and REM sleep (Figure 2C) did not differ as a function of saline versus dexmedetomidine treatment conditions.
The final interval of recording corresponded to the second dark period (hour 37 to 48). During this recording interval the overall time spent in wakefulness (Figure 2A) was less following dexmedetomidine than following saline administration. ANOVA indicated a significant (P = 0.01) effect of both treatment and time. There was a corresponding significant (P = 0.01) increase in the time spent in states of NREM sleep/sedation (Figure 2B). Likewise, there was a significant (P = 0.03) increase in the amount of recording time spent in REM sleep (Figure 2C).
Additional studies quantified the dose-dependent effects of dexmedetomidine (0.0, 0.1, 0.3, and 0.5 mg/kg) on number of minutes per hour spent in wakefulness, NREM sleep, sedation, and REM sleep. The results indicated a significant (P < 0.01) dose main-effect of dexmedetomidine on all states throughout the first 24 h of recording.
Figure 2D shows average EEG power for seven rats recorded during the first hour after injection of saline and dexmedetomidine. ANOVA and Bonferroni multiple comparisons test indicated that dexmedetomidine significantly (P = 0.0025) increased EEG power in the 1.5 Hz band. Thus, even these cursory analyses of EEG power were consistent with the behavioral (Figure 1) and EEG/EMG (Figure 2A-2C) results in distinguishing states of NREM sleep and states of sedation.
Systemic Dexmedetomidine Decreased Adenosine Levels in the Substantia Innominata
Microdialysis sampling in the substantia innominata region of the basal forebrain (Figure 3A) made it possible to quantify adenosine levels (Figure 3B) in freely behaving, un-anesthetized rats before and for 4 h after dexmedetomidine (0.3 mg/kg i.p.). Repeated-measures ANOVA showed that dexmedetomidine caused a significant (P = 0.0003) decrease in adenosine levels (Figure 3C, filled bars). Multiple comparisons tests revealed a significant decrease in adenosine during each hour after i.p. administration of dexmedetomidine. In addition to the negative control results provided by preinjection measures of adenosine (Figure 3C, open bar), positive control data were obtained during experiments in which adenosine was measured before (Figure 3D, open bar) and after (Figure 3D, hatched bars) injection of saline. These data (Figure 3D) revealed no significant change in adenosine levels during 4 h of measurement after administration of saline.
In order to determine whether dexmedetomidine acts directly in the substantia innominata to reduce adenosine levels, an additional set of experiments involved microdialysis delivery of dexmedetomidine to the substantia innominata while quantifying the effects on levels of adenosine in the substantia innominata (Figure 4A and 4B). During dialysis with Ringer's solution (control), adenosine levels (Figure 4C) were not significantly different from adenosine levels measured during dialysis delivery of dexmedetomidine. Power calculations indicated that 133 rats per group would be needed to reveal a significant effect of dexmedetomidine delivered by microdialysis to the substantia innominata on adenosine levels in the substantia innominata.
Systemic Dexmedetomidine Did Not Alter Expression of pCREB or c-Fos
Table 1 summarizes the percent of c-Fos and pCREB immunopositive neurons (+) in the nucleus of the horizontal limb of the diagonal band, ventrolateral preoptic nucleus, me-dial preoptic area, median preoptic nucleus, and supraoptic nucleus after systemic administration of saline or dexmedetomidine (0.5 mg/kg). The saline and dexmedetomidine experiments were conducted in pairs, and Table 1 summarizes data derived from 186 +c-Fos and 153 +pCREB stained sections. Comparing the effects of saline and dexmedetomidine administration revealed no statistically significant differences in the percent of neurons labeled by either the c-Fos or the pCREB assay. Representative photomicrographs (Figure 5) illustrate the integrity of both assays, as confirmed by c-Fos and pCREB experiments conducted with and without anti-c-Fos and anti-pCREB antibodies.
Figure 5.
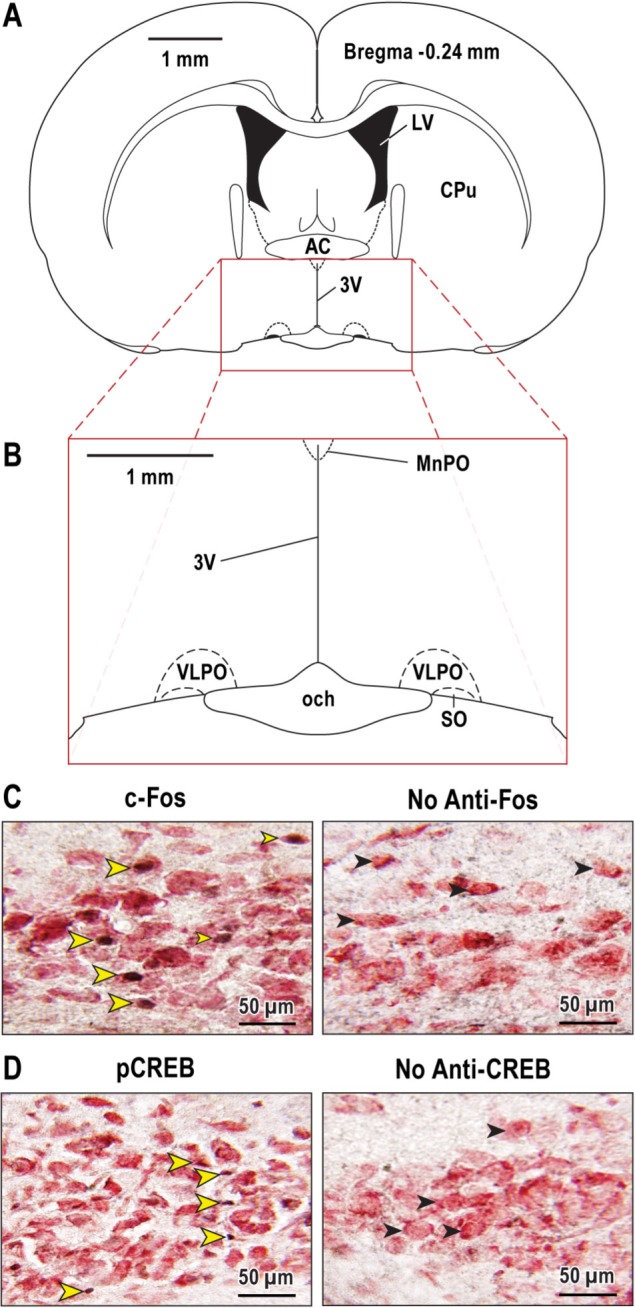
Representative photomicrographs of c-Fos and pCREB expression. Coronal brain section (A) illustrates the forebrain region at bregma -0.24 enlarged below (B) to show location of the ventrolateral preoptic (VLPO) nucleus. Photomicrographs at left show images of c-Fos (C) and pCREB (D) immunopositive cells. The photomicrographs on the right show lack of cell labeling when either the c-Fos or pCREB antibodies were omitted from the assay. The yellow arrowheads (C) (left box) mark VLPO neurons with black nuclei indicating c-Fos expression. The black arrowheads (C) (right box) indicate VLPO neurons with no c-Fos labeling when the Fos antibody was omitted from the assay (negative control). The yellow arrowheads (D) (left box) point to VLPO neurons labeled positively for pCREB. There was no pCREB activation in VLPO with omission of the pCREB antibody (D) (No anti-CREB). These immunohistochemical labeling data for VLPO are representative of labeling patterns quantified for the other brain regions described by Table 1. 3V, third ventricle; AC, anterior commissure; CuP, caudate/putamen; LV, lateral ventricle; MnPO, median preoptic nucleus; och, optic chiasm; SO, supraoptic nucleus.
DISCUSSION
Sleep is the behavioral state most thoroughly characterized at the cellular level.4,26 The extensive range of drugs used to create states of anesthesia45 and sedation51 adds to the complexity of defining these states based on a constellation of neurobiological traits. Clinical practice guidelines from the American Society of Anesthesiologists (ASA) describe states of sedation as a continuum ranging from minimal sedation involving anxiolysis, to conscious sedation during which patients can respond to verbal input, to states of deep sedation in which patients respond only to painful stimulation.52 Although the ASA classification scheme never refers to sedation as sleep, some basic39 and clinical53 studies describe dexmedetomidine-induced sedation as sleep. A more rigorous state nosology is essential for enhancing patient care at the interface of sleep disorders medicine, neurology, and anesthesiology.3,54,55 The constellation of traits quantified in the current study indicates that dexmedetomidine-induced sedation in rats is distinctly different from sleep.
Dexmedetomidine Disrupted the Temporal Organization of Sleep and Wakefulness
Quantitative analysis of behavioral states demonstrated that a single dose of dexmedetomidine caused a significant increase in the time spent in a sedated state compared with time spent in NREM sleep after injection of saline (Figure 1C-1H and Figure 2A-2C). The prolonged interval of sedation occurred at the expense of time spent in wakefulness and REM sleep. Dexmedetomidine also caused a significant increase in EEG delta power compared with delta power during NREM sleep (Figure 2D) but no increase in 11- to 24-Hz EEG spindles.22
Other studies have sought to determine whether sedation caused by dexmedetomidine can substitute for sleep. This question is relevant for care of postoperative and intensive care unit patients, and for sleep medicine.56 The results just described and illustrated by Figure 2 for REM sleep are consistent with evidence that sevoflurane anesthesia did not satisfy REM sleep debt in sleep deprived rats.11 Studies of mice found that 6 h of anesthesia induced by sevoflurane, isoflurane, or halothane caused REM sleep disruption that was followed by a rebound increase in REM sleep.12 Halothane anesthesia also caused NREM sleep disruption that was followed by a rebound increase in NREM sleep.12 Rats that experienced 24 h of REM sleep deprivation and were then anesthetized for 4 h with isoflurane had the same amount of REM sleep rebound as did rats that had not undergone REM sleep deprivation.57 The finding that dexmedetomidine caused a rebound increase in both NREM sleep and REM sleep (Figure 2B and 2C), stands in contrast to earlier studies of propofol. Sleep deprivation enhanced the speed with which propofol caused rats to lose consciousness58 and the absence of rebound increases in NREM sleep and REM sleep was interpreted to mean that recovery from sleep deprivation occurred during propofol anesthesia.8 The relationship between anesthetic disruption of sleep and sleep rebound appears to vary by drug as well as by phases of NREM versus REM sleep. These relationships can best be resolved by studies that also systematically vary dose and duration of anesthesia. The current results support the view that the loss of consciousness caused by dexmedetomidine does not compensate for sleep.
Adenosine Levels in the Substantia Innominata Were Decreased by Systemic Administration but Not by Dialysis Delivery of Dexmedetomidine to the Substantia Innominata
The substantia innominata region of the basal forebrain contributes, via multiple neurotransmitters, to the regulation of sleep and wakefulness.26,27,59 Cholinergic neurons within the basal forebrain modulate increases in adenosine levels during sleep deprivation.60,61 Adenosine inhibits basal forebrain wake-active neurons62 and immunotoxin-induced loss of cholinergic, basal forebrain neurons decreases the sleep-promoting effects of adenosine.61 Based on the foregoing evidence, a hypothesized homology between dexmedetomidine-induced sedation and NREM sleep would predict that when sedation was maximal (Figure 2B) adenosine levels in the substantia innominata would decrease. Figure 3C shows that during 4 h of dexmedetomidine-induced sedation, adenosine levels were significantly decreased.
Efforts to describe states of sedation as sleep seem glib in view of the apparent complexity among neuronal discharge data, neurochemical measures, and brain imaging in basal fore-brain. Levels of adenosine in cat basal forebrain are high during wakefulness and decrease during NREM sleep and REM sleep.44 One interpretation of the current results (Figure 3C) is that dexmedetomidine caused a decrease in basal forebrain adenosine that is homologous to sleep dependent decreases44 in basal forebrain adenosine. It is not possible, however, to reconcile such a facile interpretation with reports that groups of basal forebrain neurons discharge as rapidly during REM sleep as they do during wakefulness,63–66 with brain imaging data showing that human basal forebrain areas are as active during REM sleep as during wakefulness,67 and with evidence that adenosine inhibits basal forebrain wake-active neurons.62 Past44 and present measures of adenosine indicate the need for a more detailed understanding of the relationship between the trait of basal forebrain adenosine and states of sleep and sedation.
Comparing neurotransmitter levels measured during systemic drug administration to levels of the same neurotransmitter measured during dialysis drug delivery to specific brain regions permits inferences regarding site of drug action.28,31,32 Thus, the observation that systemic (Figure 3) versus micro-dialysis (Figure 4) delivery of dexmedetomidine differentially altered adenosine levels means that the behavioral and neurochemical phenotypes caused by systemically administered dexmedetomidine are not mediated solely within the substantia innominata. One parsimonious speculation is that systemically administered dexmedetomidine altered excitability of neurons in the locus coeruleus,15,16 which are known to share reciprocal connections with the substantia innominata.68
Dexmedetomidine Did Not Alter c-Fos and pCREB Expression
The shared circuits hypothesis postulates that neural circuits that evolved to generate sleep contribute to the loss of wakefulness caused by anesthetic agents and sedatives/hypnotics.51,54,69 Consistent with this hypothesis are data suggesting that dexmedetomidine-induced sedation is caused, in part, by activating sleep-promoting nuclei and inhibiting wake-promoting nuclei.20 These findings in mice20 and the results in Figures 1 through 4 encouraged the current use of immunohistochemistry to determine if dexmedetomidine-induced sedation was accompanied by activation of sleep-promoting brain regions of rat. The results (Table 1 and Figure 5) revealed no significant changes in c-Fos expression in the nucleus of the horizontal limb of the diagonal band, the ventrolateral preoptic nucleus, the medial preoptic area, and the median preoptic nucleus. Thus in rat, in contrast to mouse,20 dexmedetomidine did not cause an increase in Fos labeled cells.
Fos protein immunolabeling does not always reflect neuronal activation.70,71 In an effort to confirm or refute the c-Fos results, additional experiments evaluated pCREB expression. The pCREB results were consistent with the c-Fos data in showing no increase in pCREB labeling caused by dexmedetomidine. In nocturnal species, Fos expression is significantly higher after lights-off72 and circadian time influences activation-dependent, immediate-early gene expression.73–75 All dexmedetomidine and vehicle injections for the current c-Fos and pCREB studies were conducted at the same time of day.
Limitations and Conclusions
The current study does not explain the mechanisms by which systemic administration of dexmedetomidine caused a significant decrease in adenosine levels within the substantia innominata. The locus coeruleus has been proposed as one main site of action for the sedating effects of dexmedetomidine.15,16,20,76 Noradrenergic neurons in the locus coeruleus are active during wakefulness, less active during NREM sleep, and silent during REM sleep.18 Based on evidence that dexmedetomidine inhibits noradrenergic neurons within the locus coeruleus, systemic administration of dexmedetomidine might be predicted to cause an increase in REM sleep. In contrast to this prediction, the results show that dexmedetomidine caused a long-lasting elimination of REM sleep (Figure 2C). The mechanisms by which dexmedetomidine abolished REM sleep remain to be elucidated. Another limitation is that the source of adenosine is unknown. Gliotransmission can regulate adenosine levels77 and neuronal adenosine release can suppress neuronal excitability.78
Establishing direct equivalence between basal forebrain levels of dexmedetomidine after i.p. dexmedetomidine administration (Figure 3) and basal forebrain levels of dexmedetomidine during dialysis delivery of dexmedetomidine (Figure 4) is not possible. Pharmacodynamics associated with systemic dexmedetomidine uptake, distribution, and elimination required computer-controlled, variable infusions rates of dexmedetomidine delivery (ranging from ≈10 to 38 μg/kg/h) in order to achieve steady state concentrations of dexmedetomidine (4.0 ng/mL) in plasma.79 Furthermore, there is no direct correlation between drug concentration in plasma and drug concentration in brain. Conclusions derived from comparing the results in Figures 3 and 4 are indirect and are based on empiric extensions of data obtained elsewhere. For example, dialysis of the basal forebrain with a concentration of fentanyl (100 μM) or morphine (100 μM) equimolar to the current concentration of dexmedetomidine caused a significant decrease in basal forebrain levels of adenosine.30 The potential for dialysis with the sedative/hypnotic dexmedetomidine (100 μM) to alter adenosine levels is supported by evidence from concentration-response studies involving dialysis delivery of three different sedatives/hypnotics.31 Thus, the foregoing data support the interpretation that systemically administered dexmedetomidine decreased basal forebrain adenosine (Figure 3) by actions that are extrinsic to the basal forebrain (Figure 4). This interpretation, of course, accepts the dictum that absence of evidence (no evident change in basal forebrain adenosine) is not the same as evidence of absence.
In conclusion, dexmedetomidine disrupted the temporal organization of sleep and wakefulness, and caused a long-lasting elimination of REM sleep (Figure 1 and Figure 2A-2C). The long-lasting interval of sedation was followed by a rebound increase in both NREM sleep and REM sleep, consistent with the interpretation that dexmedetomidine-induced sedation did not compensate for sleep need. Dialysis delivery of dexmedetomidine to the substantia innominata region of the basal forebrain did not decrease adenosine levels (Figure 4), whereas systemic administration of dexmedetomidine did decrease adenosine levels in the substantia innominata (Figure 3). Systemic administration of dexmedetomidine did not alter c-FOS and pCREB expression (Table 1, Figure 5). Considered together, these data support the need for a more finely nuanced distinction between states of sleep and dexmedetomidine-induced sedation. The differences between NREM sleep and sedation caused by dexmedetomidine are consistent with the lack of identity between NREM sleep and the loss of wakefulness caused by agonists acting at gamma-aminobutyric acid-A (GABAA) receptors,10–12 by sedatives/hypnotics acting at the benzodiazepine binding site of GABAA receptors,31 by N-methyl-d-aspartate channel blockers,80 and by opioid agonists.28,29,32 Each of these drug classes has desired actions that play an essential role in clinical care. All of these drugs, however, also produce sleep disruption as an unwanted side effect. Sleep disruption causes hyperalgesia,81 impairs immune function,82 and can contribute to postoperative cognitive decline.83 Thus, deriving a neurobehavioral cartography of the similarities and differences between sleep and sedation has wide-ranging clinical relevance.
DISCLOSURE STATEMENT
This was not an industry supported study. The study was supported by grants NIH T-32-NS076401 (AGG), HL65272 (RL), and MH45361 (HAB) from the National Institutes of Health, Bethesda, MD, and by the Department of Anesthesiology, University of Michigan, Ann Arbor, MI. The authors have indicated no financial conflicts of interest.
ACKNOWLEDGMENTS
For expert assistance, the authors thank Amar Atal, BS, Sha Jiang, BS and Mary A. Norat, BS from the Department of Anesthesiology, and Kathy Welch, MA, MPH from the Center for Statistical Consultation and Research, University of Michigan, Ann Arbor, MI.
REFERENCES
- 1.Allada R. An emerging link between general anesthesia and sleep. Proc Natl Acad Sci USA. 2008;105:2257–8. doi: 10.1073/pnas.0711532105. [DOI] [PMC free article] [PubMed] [Google Scholar]
- 2.Alkire MT, Hudetz AG, Tonelli G. Consciousness and anesthesia. Science. 2008;322:876–80. doi: 10.1126/science.1149213. [DOI] [PMC free article] [PubMed] [Google Scholar]
- 3.Brown EN, Lydic R, Schiff ND. General anesthesia, sleep, and coma. N Engl J Med. 2010;363:2638–50. doi: 10.1056/NEJMra0808281. [DOI] [PMC free article] [PubMed] [Google Scholar]
- 4.Kryger MH, Roth T, Dement WC, editors. Principles and practice of sleep medicine. New York: Elsevier; 2011. [Google Scholar]
- 5.Cirelli C, Tononi G. Is sleep essential? PLoS Biol. 2008;6:1605–11. doi: 10.1371/journal.pbio.0060216. [DOI] [PMC free article] [PubMed] [Google Scholar]
- 6.Laureys S, Tononi G, editors. The neurology of consciousness: cognitive neuroscience and neuropathology. New York: Academic Press; 2009. [Google Scholar]
- 7.Hobson JA, Friston KJ. Waking and dreaming consciousness: neurobiological and functional considerations. Prog Neurbiol. 2010;98:82–98. doi: 10.1016/j.pneurobio.2012.05.003. [DOI] [PMC free article] [PubMed] [Google Scholar]
- 8.Tung A, Bergmann BM, Herrera S, Cao D, Mendelson WB. Recovery from sleep deprivation occurs during propofol anesthesia. Anesthesiology. 2004;100:1419–26. doi: 10.1097/00000542-200406000-00014. [DOI] [PubMed] [Google Scholar]
- 9.Tung A, Herrera S, Szafran MJ, Kasza K, Mendelson WB. Effect of sleep deprivation on righting reflex in the rat is partially reversed by administration of adenosine A1 and A2 receptor antagonists. Anesthesiology. 2005;102:1158–64. doi: 10.1097/00000542-200506000-00015. [DOI] [PubMed] [Google Scholar]
- 10.Kelz MB, Sun Y, Chen J, et al. An essential role for orexins in emergence from general anesthesia. Proc Natl Acad Sci U S A. 2008;105:1309–14. doi: 10.1073/pnas.0707146105. [DOI] [PMC free article] [PubMed] [Google Scholar]
- 11.Pal D, Lipinski WJ, Walker AJ, Turner AM, Mashour GA. State-specific effects of sevoflurane anesthesia on sleep homeostasis: selective recovery of slow wave but not rapid eye movement sleep. Anesthesiology. 2011;114:302–10. doi: 10.1097/ALN.0b013e318204e064. [DOI] [PubMed] [Google Scholar]
- 12.Pick J, Chen Y, Moore JT, et al. Rapid eye movement sleep debt accrues in mice exposed to volatile anesthetics. Anesthesiology. 2011;115:702–12. doi: 10.1097/ALN.0b013e31822ddd72. [DOI] [PMC free article] [PubMed] [Google Scholar]
- 13.Ebert TJ, Hall JE, Barney JA, Uhrich TD, Colinco MD. The effects of increasing plasma concentrations of dexmedetomidine in humans. Anesthesiology. 2000;93:382–94. doi: 10.1097/00000542-200008000-00016. [DOI] [PubMed] [Google Scholar]
- 14.Sanders RD, Giombini M, Ma D, et al. Dexmedetomidine exerts dose-dependendent age-independent antinociception but age-dependent hypnosis in Fisher rats. Anesth Analg. 2005;100:1295–302. doi: 10.1213/01.ANE.0000149595.41576.B3. [DOI] [PubMed] [Google Scholar]
- 15.Correa-Sales C, Rabin BC, Maze M. A hypnotic response to dexmedetomidine, an alpha 2 agonist, is mediated in the locus coeruleus in rats. Anesthesiology. 1992;76:948–52. doi: 10.1097/00000542-199206000-00013. [DOI] [PubMed] [Google Scholar]
- 16.Chiu TH, Chen MJ, Yang YR, Yang JJ, Tang FI. Action of dexmedetomidine on rat locus coeruleus neurones: intracellular recording in vitro. Eur J Pharmacol. 1995;285:261–8. doi: 10.1016/0014-2999(95)00417-j. [DOI] [PubMed] [Google Scholar]
- 17.Chu N, Bloom FE. Norepinephrine-containing neurons: changes in spontaneous discharge patterns during sleeping and waking. Science. 1973;179:908–10. doi: 10.1126/science.179.4076.908. [DOI] [PubMed] [Google Scholar]
- 18.Aston-Jones G, Bloom FE. Activity of norepinephrine-containing locus coeruleus neurons in behaving rats anticipates fluctuations in the sleep-waking cycle. J Neurosci. 1981;1:876–86. doi: 10.1523/JNEUROSCI.01-08-00876.1981. [DOI] [PMC free article] [PubMed] [Google Scholar]
- 19.Seidel WF, Maze M, Dement WC, Edgar DM. Alpha-2 adrenergic modulation of sleep: time-of-day-dependent pharmacodynamic profiles of dexmedetomidine and clonidine in the rat. J Pharmacol Exp Ther. 1995;275:263–73. [PubMed] [Google Scholar]
- 20.Nelson LE, Lu J, Guo T, Saper CB, Franks NP, Maze M. The alpha2-adrenoceptor agonist dexmedetomidine converges on an endogenous sleep-promoting pathway to exert its sedative effects. Anesthesiology. 2003;98:428–36. doi: 10.1097/00000542-200302000-00024. [DOI] [PubMed] [Google Scholar]
- 21.Maksimow A, Snapir A, Sarkela M, et al. Assessing the depth of dexmedetomidine-induced sedation with electroencephalogram (EEG)-based spectral entropy. Acta Anaesthesiol Scand. 2007;51:22–30. doi: 10.1111/j.1399-6576.2006.01174.x. [DOI] [PubMed] [Google Scholar]
- 22.Huupponen E, Maksimow A, Lapinlampi P, et al. Electroencephalogram spindle activity during dexmedetomidine sedation and physiological sleep. Acta Anaesthesiol Scand. 2008;52:289–94. doi: 10.1111/j.1399-6576.2007.01537.x. [DOI] [PubMed] [Google Scholar]
- 23.Mason KP, Zgleszewski S, Forman RE, Stark C, DiNardo JA. An exaggerated hypertensive response to glycopyrrolate therapy for bradycardia associated with high-dose dexmedetomidine. Anesth Analg. 2009;108:906–8. doi: 10.1213/ane.0b013e3181948a6f. [DOI] [PubMed] [Google Scholar]
- 24.Mason KP, Zurakowski D, Zgleszewski S, Prescilla R, Fontaine PJ, Dinardo JA. Incidence and predictors of hypertension during high-dose dexmedetomidine sedation for pediatric MRI. Pediatr Anesth. 2010;20:516–23. doi: 10.1111/j.1460-9592.2010.03299.x. [DOI] [PubMed] [Google Scholar]
- 25.Ohtani N, Yasui Y, Watanabe D, Kitamura M, Shoji K, Masaki E. Perioperative infusion of dexmedetomidine at a high dose reduces postoperative analgesic requirements: a randomized control trial. J Anesth. 2011;25:872–8. doi: 10.1007/s00540-011-1239-8. [DOI] [PubMed] [Google Scholar]
- 26.Brown RE, Basheer R, McKenna JT, Strecker RE, McCarley RW. Control of sleep and wakefulness. Physiol Rev. 2012;92:1087–187. doi: 10.1152/physrev.00032.2011. [DOI] [PMC free article] [PubMed] [Google Scholar]
- 27.Porkka-Heiskanen T, Kalinchuk AV. Adenosine, energy metabolism and sleep homeostasis. Sleep Med Rev. 2011;15:123–35. doi: 10.1016/j.smrv.2010.06.005. [DOI] [PubMed] [Google Scholar]
- 28.Osman NI, Baghdoyan HA, Lydic R. Morphine inhibits acetylcholine release in rat prefrontal cortex when delivered systemically or by microdialysis to basal forebrain. Anesthesiology. 2005;103:779–87. doi: 10.1097/00000542-200510000-00016. [DOI] [PubMed] [Google Scholar]
- 29.Gauthier EA, Guzick SE, Brummett CM, Baghdoyan HA, Lydic R. Buprenorphine disrupts sleep and decreases adenosine concentrations in sleep-regulating brain regions of Sprague Dawley rat. Anesthesiology. 2011;115:743–53. doi: 10.1097/ALN.0b013e31822e9f85. [DOI] [PMC free article] [PubMed] [Google Scholar]
- 30.Nelson AM, Battersby AS, Baghdoyan HA, Lydic R. Opioid-induced decreases in rat brain adenosine levels are reversed by inhibiting adenosine deaminase. Anesthesiology. 2009;111:1327–33. doi: 10.1097/ALN.0b013e3181bdf894. [DOI] [PMC free article] [PubMed] [Google Scholar]
- 31.Hambrecht-Wiedbusch VS, Gauthier EA, Baghdoyan HA, Lydic R. Benzodiazepine receptor agonists cause drug-specific and state-specific alterations in EEG power and acetylcholine release in rat pontine reticular formation. Sleep. 2010;33:909–18. doi: 10.1093/sleep/33.7.909. [DOI] [PMC free article] [PubMed] [Google Scholar]
- 32.Watson CJ, Lydic R, Baghdoyan HA. Sleep and GABA levels in the oral part of rat pontine reticular formation are decreased by local and systemic administration of morphine. Neuroscience. 2007;144:375–86. doi: 10.1016/j.neuroscience.2006.09.007. [DOI] [PMC free article] [PubMed] [Google Scholar]
- 33.Filbey WA, Sanford DT, Baghdoyan HA, Koch LG, Britton SL, Lydic R. Eszopiclone and dexmedetomidine depress ventilation in obese rats with features of metabolic syndrome. Sleep. 2014;37:871–80. doi: 10.5665/sleep.3650. [DOI] [PMC free article] [PubMed] [Google Scholar]
- 34.Vanini G, Watson CJ, Lydic R, Baghdoyan HA. Gamma-aminobutyric acid-mediated neurotransmission in the pontine reticular formation modulates hypnosis, immobility, and breathing during isoflurane anesthesia. Anesthesiology. 2008;109:978–88. doi: 10.1097/ALN.0b013e31818e3b1b. [DOI] [PMC free article] [PubMed] [Google Scholar]
- 35.Hudetz AG, Vizuete JA, Pillay S. Differential effects of isoflurane on high-frequency and low-frequency gamma oscillations in the cerebral cortex and hippocampus in freely moving rats. Anesthesiology. 2011;114:588–95. doi: 10.1097/ALN.0b013e31820ad3f9. [DOI] [PMC free article] [PubMed] [Google Scholar]
- 36.Gross JB, Bachenberg KL, Benumof JL, et al. Practice guidelines for the perioperative management of patients with obstructive sleep apnea. Anesthesiology. 2014;120:268–86. doi: 10.1097/ALN.0000000000000053. [DOI] [PubMed] [Google Scholar]
- 37.MacDonald E, Scheinin M, Scheinin H, Virtanen R. Comparison of the behavioral and neurochemical effects of the two optical enantiomers of medetomidine, a selective alpha-2-adrenoceptor agonist. J Pharmacol Exp Ther. 1991;259:848–54. [PubMed] [Google Scholar]
- 38.Opp MR. Rat strain differences suggest a role for corticotropin-releasing hormone in modulating sleep. Physiol Behav. 1998;63:67–74. doi: 10.1016/s0031-9384(97)00390-9. [DOI] [PubMed] [Google Scholar]
- 39.Bol CJJG, Danhof M, Stanski DR, Mandema JW. Pharmacokineticpharmacodynamic characterization of the cardiovascular, hypnotic, EEG, and ventilatory responses to dexmedetomidine in the rat. J Pharm Exp Ther. 1997;283:1051–8. [PubMed] [Google Scholar]
- 40.Flint RR, Chang T, Lydic R, Baghdoyan HA. GABAA receptors in the pontine reticular formation of C57BL/6J mouse modulate neurochemical, electrographic, and behavioral phenotypes of wakefulness. J Neurosci. 2010;30:12301–9. doi: 10.1523/JNEUROSCI.1119-10.2010. [DOI] [PMC free article] [PubMed] [Google Scholar]
- 41.Chediak A, Esparis B, Isaacson R, et al. How many polysomnograms must sleep fellows score before becoming proficient at scoring sleep? J Clin Sleep Med. 2006;2:427–30. [PubMed] [Google Scholar]
- 42.Berthomier C, Drouot X, Herman-Stoica M, et al. Automatic analysis of single-channel sleep EEG: validation in healthy individuals. Sleep. 2007;30:1587–95. doi: 10.1093/sleep/30.11.1587. [DOI] [PMC free article] [PubMed] [Google Scholar]
- 43.Paxinos G, Watson C. The rat brain in stereotaxic coordinates. 6th ed. San Diego: Academic Press; 2007. [Google Scholar]
- 44.Porkka-Heiskanen T, Strecker RE, McCarley RW. Brain site-specificity of extracellular adenosine concentration changes during sleep deprivation and spontaneous sleep: an in vivo microdialysis study. Neuroscience. 2000;99:507–17. doi: 10.1016/s0306-4522(00)00220-7. [DOI] [PubMed] [Google Scholar]
- 45.Van Dort CJ, Baghdoyan HA, Lydic R. Adenosine A1 and A2 receptors in mouse prefrontal cortex modulate acetylcholine release and behavioral arousal. J Neurosci. 2009;29:871–81. doi: 10.1523/JNEUROSCI.4111-08.2009. [DOI] [PMC free article] [PubMed] [Google Scholar]
- 46.Vanini G, Wathen BL, Lydic R, Baghdoyan HA. Endogenous GABA levels in the pontine reticular formation are greater during wakefulness than during REM sleep. J Neurosci. 2011;31:2649–56. doi: 10.1523/JNEUROSCI.5674-10.2011. [DOI] [PMC free article] [PubMed] [Google Scholar]
- 47.Kawasaki Y, Kohno T, Zhuang ZY, et al. Ionotropic and metabotropic receptors, protein kinase A, protein kinase C, and Src contribute to C-fiber-induced ERK activation and cAMP response element-binding protein phosphorylation in dorsal horn neurons, leading to central sensitization. J Neurosci. 2004;24:8310–21. doi: 10.1523/JNEUROSCI.2396-04.2004. [DOI] [PMC free article] [PubMed] [Google Scholar]
- 48.Hayashida K, Obata H, Nakajima K, Eisenach JC. Gabapentin acts within the locus coeruleus to alleviate neuropathic pain. Anesthesiology. 2008;109:1077–84. doi: 10.1097/ALN.0b013e31818dac9c. [DOI] [PMC free article] [PubMed] [Google Scholar]
- 49.Datta S, Siwek DF, Stack EC. Identification of cholinergic and noncholinergic neurons in the pons expressing phosphorylated cyclic adenosine monophosphate response element-binding protein as a function of rapid eye movement sleep. Neuroscience. 2009;163:397–414. doi: 10.1016/j.neuroscience.2009.06.035. [DOI] [PMC free article] [PubMed] [Google Scholar]
- 50.van Betteray JN, Vossen JM, Coenen AM. Behavioural characteristics of sleep in rats under different light/dark conditions. Physiol Behav. 1991;50:79–82. doi: 10.1016/0031-9384(91)90501-e. [DOI] [PubMed] [Google Scholar]
- 51.Lydic R, Baghdoyan HA, McGinley J. Opioids, sedation, and sleep: different states, similar traits, and the search for common mechanisms. In: Malviya S, Naughton N, Tremper KK, editors. Sedation and analgesia for diagnostic and therapeutic procedures. Totowa, New Jersey: Humana Press; 2003. pp. 1–32. [Google Scholar]
- 52.Gross JB, Bailey PL, Connis RT, et al. Practice guidelines for sedation and analgesia by non-anesthesiologists. Anesthesiology. 2002;96:1004–17. doi: 10.1097/00000542-200204000-00031. [DOI] [PubMed] [Google Scholar]
- 53.Mantz J, Josserand J, Hamada S. Dexmedetomidine: new insights. Eur J Anaesthesiol. 2011;28:3–6. doi: 10.1097/EJA.0b013e32833e266d. [DOI] [PubMed] [Google Scholar]
- 54.Lydic R, Biebuyck JF. Sleep neurobiology: relevance for mechanistic studies of anaesthesia. Br J Anaesth. 1994;72:506–8. doi: 10.1093/bja/72.5.506. [DOI] [PubMed] [Google Scholar]
- 55.Chung F, Hillman D, Lydic R. Sleep medicine and anesthesia: a new horizon for anesthesiologists. Anesthesiology. 2011;114:1261–2. doi: 10.1097/ALN.0b013e318216e858. [DOI] [PubMed] [Google Scholar]
- 56.Gehlbach BK, Chapotot F, Leproult R, et al. Temporal disorganization of circadian rhythmicity and sleep-wake regulation in mechanically ventilated patients receiving continuous intravenous sedation. Sleep. 2012;35:1105–14. doi: 10.5665/sleep.1998. [DOI] [PMC free article] [PubMed] [Google Scholar]
- 57.Mashour GA, Lipinski WJ, Matlen LB, et al. Isoflurane anesthesia does not satisfy the homeostatic need for rapid eye movement sleep. Anesth Analg. 2010;110:1283–9. doi: 10.1213/ANE.0b013e3181d3e861. [DOI] [PMC free article] [PubMed] [Google Scholar]
- 58.Tung A, Szafran MJ, Bluhm B, Mendelson WB. Sleep deprivation potentiates the onset and duration of loss of righting reflex induced by propofol and isoflurane. Anesthesiology. 2002;97:906–11. doi: 10.1097/00000542-200210000-00024. [DOI] [PubMed] [Google Scholar]
- 59.Basheer R, Strecker RE, Thakkar MM, McCarley RW. Adenosine and sleep-wake regulation. Prog Neurbiol. 2004;73:379–96. doi: 10.1016/j.pneurobio.2004.06.004. [DOI] [PubMed] [Google Scholar]
- 60.Blanco-Centurion C, Xu M, Murillo-Rodriguez E, et al. Adenosine and sleep homeostasis in the basal forebrain. J Neurosci. 2006;26:8092–100. doi: 10.1523/JNEUROSCI.2181-06.2006. [DOI] [PMC free article] [PubMed] [Google Scholar]
- 61.Kalinchuk AV, McCarley RW, Stenberg D, Porkka-Heiskanen T, Basheer R. The role of cholinergic basal forebrain neurons in adenosine-mediated homeostatic control of sleep: lessons from 192 IgG-saporin lesions. Neuroscience. 2008;157:238–53. doi: 10.1016/j.neuroscience.2008.08.040. [DOI] [PMC free article] [PubMed] [Google Scholar]
- 62.Thakkar MM, Delgiacco RA, Strecker RE, McCarley RW. Adenosinergic inhibition of basal forebrain wakefulness-active neurons: a simultaneous unit recording and microdialysis study in freely behaving cats. Neuroscience. 2003;122:1107–13. doi: 10.1016/j.neuroscience.2003.08.006. [DOI] [PubMed] [Google Scholar]
- 63.Hassani OK, Lee MG, Henny P, Jones BE. Discharge profiles of identified GABAergic in comparison to cholinergic and putative glutamatergic basal forebrain neurons across the sleep-wake cycle. J Neurosci. 2009;29:11828–40. doi: 10.1523/JNEUROSCI.1259-09.2009. [DOI] [PMC free article] [PubMed] [Google Scholar]
- 64.Suntsova N, Guzman-Marin R, Kumar S, Alam MN, Szymusiak R, McGinty D. The median preoptic nucleus reciprocally modulates activity of arousal-related and sleep-related neurons in the perifornical lateral hypothalamus. J Neurosci. 2007;27:1616–30. doi: 10.1523/JNEUROSCI.3498-06.2007. [DOI] [PMC free article] [PubMed] [Google Scholar]
- 65.Szymusiak R, Alam N, McGinty D. Discharge patterns of neurons in cholinergic regions of the basal forebrain during waking and sleep. Behav Brain Res. 2000;115:171–82. doi: 10.1016/s0166-4328(00)00257-6. [DOI] [PubMed] [Google Scholar]
- 66.Szymusiak R, McGinty D. Sleep-related neuronal discharge in the basal forebrain of cats. Brain Res. 1986;370:82–92. doi: 10.1016/0006-8993(86)91107-8. [DOI] [PubMed] [Google Scholar]
- 67.Braun AR, Balkin TJ, Wesenten NJ, et al. Regional cerebral blood flow throughout the sleep-wake cycle: an H215O PET study. Brain. 1997;120:1173–97. doi: 10.1093/brain/120.7.1173. [DOI] [PubMed] [Google Scholar]
- 68.Jones BE. Noradrenergic locus coeruleus neurons: their distant connections and their relationship to neighboring (including cholinergic and GABAergic) neurons of the central gray and reticular formation. In: Barnes CD, Pompeiano O, editors. Progress in Brain Research. New York, NY: Elsevier; 1991. pp. 15–30. [DOI] [PubMed] [Google Scholar]
- 69.Vanini G, Torterolo P, Baghdoyan HA, Lydic R. New York: Oxford; 2011. The shared circuits of sleep and anesthesia. Neuroscientific foundations of anesthesiology; pp. 33–44. [Google Scholar]
- 70.Cirelli C, Tononi G. On the functional significance of c-fos induction during the sleep-waking cycle. Sleep. 2000;23:453–69. [PubMed] [Google Scholar]
- 71.Kovacs KJ. Measurement of immediate-early gene activation- c-fos and beyond. J Neuroendocrinol. 2008;20:665–72. doi: 10.1111/j.1365-2826.2008.01734.x. [DOI] [PubMed] [Google Scholar]
- 72.Prosser RA, Macdonald ES, Heller HC. c-fos mRNA in the suprachiasmatic nuclei in vitro shows a circadian rhythm and responds to a serotonergic agonist. Brain Res Mol Brain Res. 1994;25:151–6. doi: 10.1016/0169-328x(94)90292-5. [DOI] [PubMed] [Google Scholar]
- 73.Ginty DD, Kornhauser JM, Thompson MA, et al. Regulation of CREB phosphorylation in the suprachiasmatic nucleus by light and a circadian clock. Science. 1993;260:238–41. doi: 10.1126/science.8097062. [DOI] [PubMed] [Google Scholar]
- 74.Semba K, Pastorius J, Wilkinson M, Rusak B. Sleep deprivation-induced c-fos and junB expression in the rat brain: effects of duration and timing. Behav Brain Res. 2001;120:75–86. doi: 10.1016/s0166-4328(00)00362-4. [DOI] [PubMed] [Google Scholar]
- 75.Mahoney MM, Smale L, Lee TM. Daily immediate early gene expression in the suprachiasmatic nucleus of male and female Octodon degus. Chronobiol Int. 2009;26:821–37. doi: 10.1080/07420520903044265. [DOI] [PubMed] [Google Scholar]
- 76.Mizobe T, Maghsoudi K, Sitwala K, Tianzhi G, Ou J, Maze M. Antisense technology reveals the alpha2A adrenoceptor to be the subtype mediating the hypnotic response to the highly selective agonist, dexmedetomidine, in the locus coeruleus of the rat. J Clin Invest. 1996;98:1076–80. doi: 10.1172/JCI118887. [DOI] [PMC free article] [PubMed] [Google Scholar]
- 77.Halassa MM, Florian C, Fellin T, et al. Astrocytic modulation of sleep homeostasis and cognitive consequences of sleep loss. Neuron. 2009;61:213–9. doi: 10.1016/j.neuron.2008.11.024. [DOI] [PMC free article] [PubMed] [Google Scholar]
- 78.Lovatt D, Xu Q, Liu W, et al. Neuronal adenosine release, and not astrocytic ATP release, mediates feedback inhibition of excitatory activity. Proc Natl Acad Sci U S A. 2012;109:6265–70. doi: 10.1073/pnas.1120997109. [DOI] [PMC free article] [PubMed] [Google Scholar]
- 79.Maier C, Steinberg GK, Sun GH, Zhi GT, Maze M. Neuroprotection by the α2-adrenoreceptor agonist dexmedetomidine in a focal model of cerebral ischemia. Anesthesiology. 1993;79:306–12. doi: 10.1097/00000542-199308000-00016. [DOI] [PubMed] [Google Scholar]
- 80.Lydic R, Baghdoyan HA. Ketamine and MK-801 decrease ACh release in the pontine reticular formation, slow breathing, and disrupt sleep. Sleep. 2002;25:617–22. [PubMed] [Google Scholar]
- 81.Roehrs T, Hyde M, Blaisdell B, Greenwald M, Roth T. Sleep loss and REM sleep loss are hyperalgesic. Sleep. 2006;29:145–51. doi: 10.1093/sleep/29.2.145. [DOI] [PubMed] [Google Scholar]
- 82.Imeri L, Opp MR. How (and why) the immune system makes us sleep. Nat Rev Neurosci. 2009;10:199–210. doi: 10.1038/nrn2576. [DOI] [PMC free article] [PubMed] [Google Scholar]
- 83.Rudolph JL, Marcantonio ER. Postoperative delirium: acute change with long-term implications. Anesth Analg. 2011;112:1201–11. doi: 10.1213/ANE.0b013e3182147f6d. [DOI] [PMC free article] [PubMed] [Google Scholar]