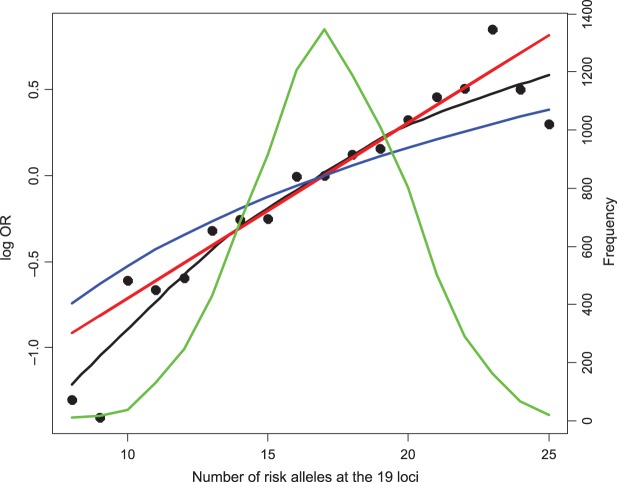
Fig. 2.
Variation in the risk of breast cancer in the BPC3 study subjects by cumulative number of risk variants they carried. The  -axis is the log OR where the reference group were the samples whose number of risk alleles at the 19 loci is 17, which is the observed average in the number of risk alleles at the 19 loci. Fitted risk under the multiplicative (red) and additive (blue) models are plotted together with smoothed non-parametric estimates of risks (black). The distribution of subjects by total number of risk variants they carry is also shown (green line).

