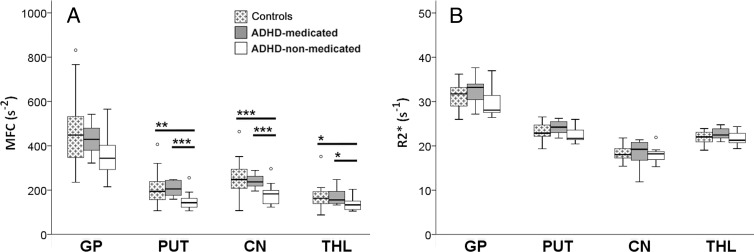
Figure 2:
Subgroup comparisons of MFC and R2* brain iron indexes. Box and whisker plots show subgroup variations in indexes (medians, 25th and 75th percentiles, minimum, maximum, outliers). CN = caudate nucleus, GP = globus pallidus, PUT = putamen, THL = thalamus. A, Subgroup comparisons of MFC in globus pallidus, putamen, caudate nucleus, and thalamus show a significant reduction in mean striatal (putamen and caudate nucleus) and median thalamic MFC in ADHD-nonmedicated subgroup compared with control group and ADHD-medicated subgroup. No significant differences in MFC were found between control group and ADHD-medicated subgroup. B, Subgroup comparisons of R2* indexes in all regions did not show any significant differences in means. * = P < .05, ** = P < .01, *** = P < .005 (all FDR corrected).

