

Abstract
Pharmacologic reinduction of the developmentally silenced fetal (γ) globin genes has been achieved in hemoglobinopathy patients using short chain fatty acid derivatives, with therapeutic effects. However, higher-potency inducers than are available in currently identified short chain fatty acid derivatives are desirable for long-term use. Using several short-chain fatty acids with established γ-globin induction activity, a pharmacophore template was constructed with the TFIT module of the flo software and used to select several new candidate compounds, three of which exhibited significant activity in a γ-globin gene reporter transcriptional assay which detects only strong inducers. The data were used to construct a new pharmacophore and a ‘pseudo’ receptor around it. Six hundred and thirty low-molecular weight compounds were docked into this receptor model. Of 26 compounds selected and tested in functional assays, two compounds showed activity >500% over control levels and two had activity 200% over control range, significantly more active than previously identified short chain fatty acid derivative fetal globin gene inducers. Three compounds had less activity; the remainder showed moderate activity. These findings demonstrate the feasibility of using iterative construction of pharmacophores, pseudo-binding site modeling, and virtual screening to identify small molecules with the ability to induce transcription of specific target genes, for potential therapeutics.
Keywords: pharmacophore, pseudo receptor, fetal globin, FLO/QXP
Sickle cell disease (SCD) and β-thalassemia are caused by molecular mutations affecting the β-globin genes for adult hemoglobin A (α2β2), and are the most common genetic diseases in the world. It is well established that these conditions can be ameliorated by reactivating production of fetal hemoglobin (HbF; α2γ2) in the patients' blood (1–5). Even small increments in HbF clearly decrease morbidity and mortality in SCD, while higher levels (>20%) are necessary to completely ameliorate the symptoms (reviews, 1,2). In β-thalassemia, increases in fetal globin synthesis, which reduce the excess unbalanced α-globin chains by 10% is often enough to decrease the anemia to a level which does not require regular blood transfusions (1).
Short chain fatty acid derivatives (SCFADs) of 2–9 carbons induce expression of γ-globin in cultured primary human erythroid cells, animal models, and reporter gene assays which test activity in activating the γ-globin gene promoter (1–11). Several short chain fatty acids induce the γ-globin promoter and have biologic and clinical activity; this class of inducing compounds was discovered to delay the normally fixed fetal-to-adult globin gene switch in a neonatal population, infants of diabetic mothers, who do not switch-off their fetal globin genes on schedule due to elevated plasma levels of alpha amino-n-butyric acid, and in patients with elevated levels of propionic acid due to an inborn error of metabolism (1–17). Pharmacologic reinduction of HbF has been achieved in affected patients treated with prototype short chain fatty acids, arginine butyrate and sodium phenylbutyrate, to levels which improve red blood cell survival enough to ameliorate anemia and even reduce clinical complications (1–4,11,15). Patients treated in a Phase II trial with pulsed arginine butyrate and with sodium phenylbutyrate have experienced biochemical and clinical improvement in their diseases, with excellent safety profiles (1–5). However, the prototype SCFAs have limitations as therapeutics. Arginine butyrate and sodium phenylbutyrate require 100 μM levels in vitro and are rapidly metabolized in vivo, necessitating large quantities (20 g for sodium phenylbutyrate), an i.v. infusion for arginine butyrate, and careful adjustment of dosing to prevent secondary suppression of erythro-poiesis (1–5).
We have previously identified third- and fourth-generation small molecules, using medicinal chemistry, of which several compounds (shown in Table 1) were found to have substantial advantages over the first-generation therapeutic, notably: (i) oral bioavailability, and (ii) prolonged biologic and biochemical half-lives, requiring only 10% of the doses of the rapidly metabolized parent compounds, butyrate and phenylbutyrate. Later generation compounds, including α-methyl-hydrocinnamic acid and 2,2-dimethylbutyrate, are effective in transgenic mice and in a baboon model for HbF induction, and pre-clinical development has begun for one SCFAD, sodium-2,2-dimethylbutyrate (8). However, these lead compounds still require 100–200 μM concentrations in vitro; compounds which are active at lower concentrations would be desirable for patient tolerability and to decrease the possibility, even remote, of any unpredictable side-effects with prolonged use.
Table 1.
Compounds used to construct and test the pharmacophore template
| Compound structure | Number of assays |
γ-Globin promoter induction relative to control (%) |
p-value | |
|---|---|---|---|---|
| 1 |  |
4 | 178 | 0.0166 |
| 2 |  |
4 | 163 | 0.08 |
| 3 | 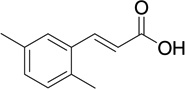 |
5 | 139 | 0.03 |
| 4 |  |
16 | 138 | 0.0051 |
| 5 |  |
2 | 74 | 0.05 |
| 6 |  |
2 | 82 | ND |
| 7 |  |
2 | 91 | 0.5 |
| 8 |  |
2 | 94 | 0.5 |
| 9 | 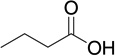 |
16 | 189 | 0.0148 |
| 10 |  |
2 | 124 | 0.1651 |
| 11 |  |
2 | 121 | 0.0148 |
| 12 |  |
3 | 116 | 0.1466 |
| 13 | 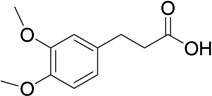 |
14 | 115 | 0.139 |
ND, not determined, due to wide SDs.
Although the molecular mechanism of action of the SCFADs in activating the promoter is beginning to be elucidated, the immediate target 'receptor' for these compounds is not entirely clear (1,2). When the structure of the binding target is not known, it is sometimes possible to deduce information about the likely shape and chemical specificity of its binding site from the compounds that bind to it. A common ligand template can be constructed by finding low-energy conformations of each compound, such that when all of the compounds are superimposed, there is a match between atoms of similar types. This template, or pharmacophore, is assumed to reflect the shape of the cavity to which these compounds bind. The pharmacophore can be used to understand the activity of known compounds and to select/design new compounds. We describe here how iterative construction of pharmacophores, a pseudo-binding site model, and virtual screening led to the discovery of several new γ-globin gene-inducing compounds with higher potency (activity at a log lower concentrations) than the compounds on which the modeling was based.
Materials and Methods
Chemical library and screened compounds
The library screened and candidate compounds were obtained from SPECS (Delft, the Netherlands).
The first 13 000 compounds listed in the SPECS database were downloaded. The structures were reformatted from the original SD format to the format used by the flo software. A short program was written to extract all compounds with 25 or fewer heavy atoms and with at least one acid functional group. This resulted in 630 structures identified. All acid groups were modeled in their charged state.
Cell culture and βlγ-globin gene promoter-driven reporter luciferase assay
GM979 cells stably transfected with the cassette were a kind gift from Dr George Stamatoyannpoulos and were cultured with and without candidate compounds over a concentration range from 0.20 to 1 mM, and the luciferase reporter assay was performed as previously described (6,8). Concentrations required in the reporter gene assay are typically one log higher than necessary in human primary erythroid cells. Signals were detected using the Dual Luciferase Reporter System (Promega, Madison, WI, USA; 8). Results were reported as a ratio of firefly luciferase/ renilla luciferase and statistical analyses were performed using Wilcoxon signed rank and paired t-tests using prism 4.0 software (GraftPad, San Diego, CA, USA). A level of p < 0.05 was used for statistical significance, in some cases wherein the p-value was not quite significant (0.06), the assay was performed two to four times, rather than >5 times.
Software and modeling
For molecular modeling, flo software (18,19) was employed. The TFIT program within flo (20) was used to construct pharmacophores. TFIT uses a set of active compounds. First, an ensemble of low-energy conformers is computed for each compound. These are then optimized to simultaneously minimize the internal energy and maximize the match of chemically similar atoms. TFIT had been previously used to construct a pharmacophore for angiotensin converting enzyme (ACE) inhibitors and in the design of dual ACE/neutroendopeptidase inhibitors (21–23). At the time of that study, there was no experimentally determined structure of ACE available. However, the crystal structure of ACE complexed with an inhibitor has now been published (pdb code: 1UZE; 24). There is excellent agreement between the bioactive conformations of the ACE inhibitors calculated by TFIT and that found experimentally.
The 'pseudo' receptor was constructed with the PSEUD module of flo and docking was carried out using the SDOCK+ program of flo. Figures were prepared using pymol (25).
Results and Discussion
Compounds active in the cell-based stably transfected β/γ-globin promoter-driven reporter gene assay, and which were also active in other in vitro assay and in vivo models of HbF induction, had been previously identified (6,8). Our working hypothesis was that these compounds bind to a target protein 'receptor' and that the binding affinity to the target 'receptor' also influences the degree of activity.
Construction of a pharmacophore
The four active compounds shown below were selected for the construction of an initial pharmacophore. Selection was based on activity, lowest p-values, and structural diversity (see Table 1).

The pharmacophore was constructed with the TFIT module (18) of the flo molecular modeling software (19,20). TFIT generates an ensemble of low-energy conformers of each compound. These are then optimized to simultaneously minimize the internal energy and maximize the match of chemically similar atoms. It was assumed that the carboxylic acids would bind to the receptor in analogous fashion and, therefore, the superimposition of the carboxylic oxygens was biased by imposing a 5 kJ superimposition energy constraint. Five hundred iterations of TFIT were used in all TFIT calculations.
TFIT produced an ensemble of low-energy superimpositions. TFIT computes a superposition energy for each result. The superposition energy reflects the degree in which chemically similar atoms are superposed. The program also computes the strain energy for each compound in the superposition. The strain energy is the difference in energy between the global minimum of the compound in vacuum and the energy of the conformation the compound adopted in the overlay.
The ensemble of superimposed structures was visually inspected. All the TFIT results showed alignments in which the oxygen atoms were reasonably well superimposed. The top scoring sets of alignments had similar superimposition energies. The alignments selected for the initial pharmacophore was one in which the compounds adopted conformations in which the carbon and oxygen atoms appeared to be most tightly clustered while still retaining a low strain energy (alignment 4, see Figure 1).
Figure 1. Two views of the superposition of four active compounds determined by TFIT.

The carbon atoms of compound 1 are colored yellow, compound 2 blue, compound 3 purple, and compound 4 green. All oxygen atoms are colored red (24).
This pharmacophore was tested to see if it could distinguish between active and inactive compounds. TFIT was first used to determine the best match between the pharmacophore and four compounds, which had been identified as inactive in the β/γ-globin promoter-driven reporter gene assay in previous studies are shown below.

No conformations of compounds 6 or 7 were found that match the pharmacophore. The most favorable superimposition of compound 5 placed the oxygen in an unfavorable position. A reasonable match was found between compound 8 and the template.
The pharmacophore suggested that the receptor has a hydrogen bond donor directed so that it can form a hydrogen bond with the two oxygen atoms of compound 1, or with the oxygen atom of compound 1 that matches the position of the oxygen of compound 2. This was not possible for the oxygen of low-energy conformations of inactive compound 5, as the methoxy carbon was interfering. A reasonable match was found between compound 8 and the template. Figure 2 shows the best TFIT superimposition found for each of these compounds.
Figure 2. Superposition of four inactive compounds onto the pharmacophore.

From left to right are shown compounds 5–8. The carbon atoms of the pharmacophore are colored light blue and that of the test compounds are colored dark blue. All oxygen atoms are colored red.
The TFIT was next used to determine how well five additional compounds, which were active in the β/γ-globin promoter-driven reporter gene assay would match the template. The five compounds used are shown below.
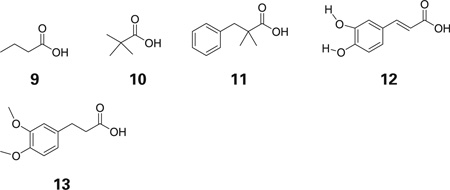
Low-energy conformations of compounds 9, 10, 12 and 13 were identified which matched the template well. Compound 11 did not match quite as closely, suggesting additional regions of the receptor were ligand atoms would be allowed. Figure 3 shows compounds 10–13 superimposed onto the pharmacophore.
Figure 3. Active compounds 10–13 superposed onto the template.

Carbon atoms of the pharmacophore are colored light blue, while those of the test compounds are colored dark blue. All oxygen atoms are colored red and protons are colored yellow.
Satisfied with the preliminary evaluation of the pharmacophore template, we next used it to design and select new compounds for testing. Compounds were selected from available compound databases and evaluated by fitting them onto the template with TFIT. Seven compounds were identified which matched the template. In each case, one or two atoms that did not match the template were allowed in order to further probe pharmacophore space. These compounds are listed below.

Compounds 14–20 were tested in the β/γ-globin promoter-driven reporter gene assay. All compounds were found to have statistically significant activity in the assay (Table 2). Two of the most active compounds, compounds 16 and 19, are illustrated in Figure 4, superimposed onto the pharmacophore template.
Table 2.
New compounds selected using the pharmacophore template
| Compound structure | Number of assays |
γ-Globin induction relative to control (%) |
p-value | |
|---|---|---|---|---|
| 14 |  |
5 | 124 | 0.2105 |
| 15 | 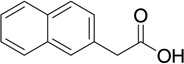 |
2 | 128 | 0.5804 |
| 16 | 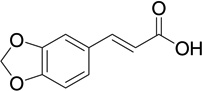 |
5 | 137 | 0.0582 |
| 17 |  |
2 | 114 | 0.1615 |
| 18 |  |
5 | 123 | 0.1674 |
| 19 |  |
2 | 132 | 0.4798 |
| 20 |  |
2 | 134 | 0.2325 |
Figure 4. Two new active compounds, 16 and 19, superposed onto the pharmacophore.

Second iteration, construction of a pseudo-receptor, and screening
In the first phase of this project, as described above, compounds had been selected by visual inspection and then evaluated by fitting them onto the pharmacophore template. We next wished to screen large numbers of compounds and required more automated methods. Two common methods for computer or 'virtual' screening involve: (i) evaluating compounds by comparison with a three-dimensional pharmacophore; or (ii) by docking into the receptor-binding site. If the structure of the receptor is available, the second method is considered the more powerful.
Although the structure of the receptor was not available in this project, it was possible to construct a 'pseudo' receptor around the pharmacophore using the FLO software. While a 'pseudo'-binding site is highly approximate, the method has the advantage that the binding site can be visualized and the excluded volume can be adjusted. In addition, use of the 'pseudo' receptor allows application of computational techniques, such as docking and de novo design.
The first step toward the construction of the 'pseudo' receptor was to refine the pharmacophore template, using the new experimental results described above. A new template was constructed by adding two of the most active new compounds (16 and 19). These compounds were selected primarily for the additional structural information that they contained. The new template was constructed by combining the initial template with conformers of compounds 16 and 19 that had been fitted to this template with TFIT (illustrated in Figure 4). TFIT is most powerful for alignments of up to four molecules, therefore TFIT was not used to realign the six molecules that made up the refined pharmacophore template.
The 'pseudo'-binding site was constructed using FLO. This 'pseudo'-binding site is composed of functional groups selected to form hydrogen bonds with the ligands, and functional groups that will mimic the hydrophobic surface of the binding site. A guanadinium group was selected to form hydrogen bonds with the acidic groups of the ligands. A pyrole group was used to mimic binding site hydrogen bond donors. These groups were positioned around the template molecules and anchored to the chemically complementary ligand atoms with a 10 kJ constraint. The 'pseudo' program of FLO automatically fills the remaining volume with propane to mimic the binding site's hydrophobic surface. This structure was next subjected to several rounds of dynamics. This procedure has been previously tested with experimentally determined protein/ligand complexes. When the representation of the ligand is accurate, this procedure has produced a binding site, which has an accessible surface similar to that observed in the X-ray structure of the ligand's receptor (C. McMartin, unpublished results). Figure 5 illustrates the results obtained with the pseudo program.
Figure 5. The 'pseudo' receptor of propane, pyrole, and guanadinium which fits around the pharmacophore template.

Template atoms are shown in blue and red. The pyrole and guanadinum groups are shown in purple with nitrogen atoms colored blue; the propane molecules are colored green.
Once the template atoms are removed, the shell of propanes, the pyrole, and the guanadinium groups represent the receptor-binding site. To insure a moderate amount of binding site flexibility, the atoms of the binding site were allowed to move with a molecular mechanics force field, and an additional flat-well constraint (radius 0.5 Å, quadratic penalty 20 kJ/Å2) was imposed.
To test the 'pseudo'-binding site, 20 compounds (14 active and six inactive in the β/γ-globin promoter-driven reporter gene assay) were docked into the binding site model using the docking module, SDOCK+, of flo. SDOCK+ explores the conformational space of each compound using a rapid, near-systematic searching algorithm. For each docked conformation, SDOCK+ computes a predicted binding free energy using an empirical scoring function consisting of contact energy, hydrogen bonding energy, polar desolvation, bumping, internal energy, and entropy. For the most active compounds, the predicted free energy (reported as pI or the negative log of the Ki) fell between 6.6 and 6.9, with hydrogen bonding energies between 7.4 and 8.9 kJ/mol. The pI values for the four inactive compounds ranging from 5.6 to 6.2 with hydrogen bonding energies between 5.6 and 7.0 kJ/mol. Thus, a combination of the pI and the hydrogen bonding energy could be used to distinguish between active and inactive compounds.
Compounds for screening were then selected from a database of 13 000 commercially available compounds. Only molecules with an acid group and <24 heavy atoms were chosen. This resulted in 630 compounds. These were docked into the binding site using the SDOCK+. The binding modes were scored using SDOCK+ and the best 10 conformations for each compound were retained for visual inspection. Upon completion, the entire output was clustered according to predicted binding free energy.
All compounds with a pI score of 5.0 and greater were inspected visually. The compounds with the highest pI scores were selected. In addition, compounds with lower scores but which formed good hydrogen bonds were also included. If two compounds appeared to be closely similar, only the one with the better scores was selected. Using these criteria, 30 compounds were chosen for in vitro testing. The scores for these compounds ranged from pI 5.1 (H bond of −8.1) to pI 8.8 (H bond of −9.4). The extent of overlap with the known compounds varied in order to further explore the hypothetical binding site. In addition, the 30 compounds displayed significant chemical diversity. Twenty-six compounds were acquired and tested.
γ-Globin gene-inducing activity of compounds identified by pharmacophore modeling
Table 3 shows the results of the in vitro β/γ-globin gene promoter-driven reporter gene assay for the 26 compounds. Twenty-three of the 26 compounds were found to display some γ-globin gene-inducing activity, and was statistically significant in most of these compounds when assayed at least five times. Two compounds showed activity >500% over control and two had activity in the 200% range. Three compounds had activity less than control. The remainder showed moderate activity (<200%). Figure 6 illustrates the two most active compounds in the 'pseudo' receptor.
Table 3.
New compounds selected using the 'pseudo' receptor
| Compound | Compound structure | pla | H+ bonding energy (kJb) |
γ-Globin induction relative to control (%) |
p-value | |
|---|---|---|---|---|---|---|
| 1 | RB7 |  |
8.8 | −9.4 | 522 | 0.001 |
| 2 | RB29 |  |
7.5 | −8.5 | 512 | 0.025 |
| 3 | RB9 |  |
7.3 | −7.3 | 279 | 0.05 |
| 4 | RB4 |  |
7.3 | −8.3 | 229 | 0.002 |
| 5 | RB21 |  |
5.6 | −8.3 | 150 | 0.03 |
| 6 | RB19 | 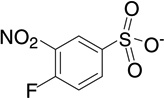 |
6.6 | −8.2 | 146 | 0.01 |
| 7 | RB11 | 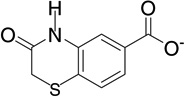 |
7.0 | −9.2 | 145 | 0.01 |
| 8 | RB23 | 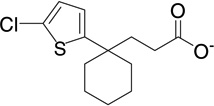 |
7.2 | −8.2 | 140 | 0.03 |
| 9 | RB18 | 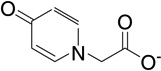 |
6.8 | −5.7 | 139 | 0.001 |
| 10 | RB15 |  |
7.6 | −9.3 | 127 | 0.001 |
| 11 | RB16 |  |
6.8 | −5.7 | 127 | 0.02 |
| 12 | RB13 |  |
6.1 | −8.0 | 127 | 0.01 |
| 13 | RB3 |  |
7.3 | −8.3 | 125 | 0.01 |
| 14 | RB28 | 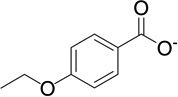 |
7.2 | −8.2 | 123 | 0.02 |
| 15 | RB10 |  |
6.0 | −9.2 | 121 | 0.1 |
| 16 | RB8 |  |
7.3 | −7.3 | 118 | 0.15 |
| 17 | RB22 |  |
5.1 | −8.2 | 118 | 0.06 |
| 18 | RB17 | 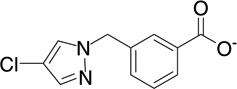 |
7.1 | −6.7 | 117 | 0.001 |
| 19 | RB20 |  |
5.1 | −8.1 | 117 | 0.05 |
| 20 | RB14 |  |
7.5 | −5.6 | 116 | 0.02 |
| 21 | RB26 |  |
6.3 | −6.8 | 115 | 0.06 |
| 22 | RB27 |  |
5.2 | −8.1 | 114 | 0.06 |
| 23 | RB24 |  |
5.2 | −8.1 | 114 | 0.2 |
| 24 | RB1 |  |
7.6 | −8.7 | 99 | 0.8 |
| 25 | RB25 |  |
5.6 | −8.3 | 97 | 0.9 |
| 26 | RB5 |  |
8.8 | −9.3 | 89 | 0.1 |
Predicted pI [-log(Ki)] to 'pseudo' receptor model.
Hydrogen bonding energy, kJ, to 'pseudo' receptor model.
Figure 6. The two most active compounds docked into the 'pseudo' receptor.

Compound RB7 is shown on the left and RB29 is shown on the right. Receptor carbons are shown in blue, compound carbons are colored green. Oxygen atoms are colored red and nitrogen atoms are colored blue. Some of the propane molecules were deleted for clarity.
Our working hypothesis was that these γ-globin gene-inducing compounds bind to a target 'receptor' and that the binding affinity to the target influences the degree of activity. However, the transcriptional activity measured by the cellular reporter assay is also influenced by a number of different physical properties of the compound, in addition its intrinsic 'activity', including its solubility and cell permeability. The initial active compounds all had a carboxylic acid group and hydrophobic functional groups. Several compounds also had methoxy groups. Upon superposition, there was a good match between the position of the oxygen atoms of these compounds. This suggested that the receptor might have a hydrogen bond donor and that these compounds may be forming hydrogen bonds with receptor atoms. This hypothesis was borne out when the three most active compounds found in the first screening all had hydrogen bond acceptors that, upon superposition, occupied the same region. Therefore, the 'pseudo' receptor was constructed to 'fish out' compounds that had an acidic group, could adopt a similar shape to the known compounds, and could form this specific hydrogen bond with the receptor. The two most active compounds discovered in the "pseudo" receptor screen form these hydrogen bonds thus confirming the original hypothesis.
The 'pseudo' receptor described here was constructed specifically to identify compounds similar in size, shape, and chemical specificity to the first template. It was not intended to find analogs of butyric acid, initially the most active compound. To find analogs of this compound, a different 'pseudo' receptor would have to be constructed.
With this new data, it will be relatively simple to construct a new template and 'pseudo' receptor, as the two most active compounds have little conformational flexibility. In addition, the compounds that showed little or no activity will also contribute valuable information about regions of the receptor that are not beneficial to binding.
Conclusions and Future Directions
In this report we have described the construction of a pharmacophore and a 'pseudo' receptor that reflect the cellular and molecular data. We have demonstrated that this modeling can be used successfully for in silico screening of libraries, even when a target receptor is not known. The model was sufficiently well defined to allow docking of 630 compounds and the selection of 30 compounds for testing. Of the 26 compounds acquired and tested, four displayed significantly greater activity, acting at a log lower concentrations than required for the activity of previously identified compounds and, significantly, demonstrating higher activity than butyrate, the most active compound previously known and for which medicinal chemistry approaches had not resulted in a more potent lead compound. The new data will be used to construct a new pharmacophore and 'pseudo' receptor in the search for additional compounds with even better gene-activating properties in cellular and animal models. Additional candidates would be useful, as synthesis of the compounds discovered herein, despite their higher potency, may be difficult for application to patients. These findings demonstrate the feasibility of using iterative construction of pharmacophores, pseudo-binding site modeling, and virtual screening to develop small molecules with the ability to induce transcription of specific genes, as potential therapeutics.
Pharmacophore modeling has significant predictive power for identifying new inducers of the fetal globin gene promoter. It is noteworthy that new, active molecules were identified in the screening process which were not structurally related to previously known inducers of HbF, further demonstrating the power of the system. Until very recently, short chain fatty acids were believed to exert their transcriptional activation of γ-globin through general inhibition of histone de-acetylases (HDAC) and induction of histone acetylation (1,2,9,26,27). We have demonstrated that SCFADs can be derived which retain the ability to activate developmentally silenced γ-globin, but lack HDAC inhibitory activity (8), and a lack of correlation between HDAC inhibition and γ-globin gene promoter induction was also demonstrated by Cao and Stamatoyannopoulos (27). More recently, we have reported a novel mechanism of action for SCFADs that is independent of general HDAC inhibitory activity, but produces an equivalent molecular effect (28). Certain SCFADs induce specific dissociation of HDAC3, part of a transcriptional co-repressor complex, from the γ-globin gene promoter, allowing local chromatin modification and recruitment of transcriptional activators and RNA polymerase (29). High-potency inducers, as identified through pharmacophore screening, should facilitate the identification of molecular events, which activate expression of the developmentally silenced γ-globin genes, as well as providing higher-potency therapeutic candidates.
Acknowledgments
Supported by grants DK-52962, DK-64535. HL-78276, and CA-84193 from the National Institutes of Health.
References
- 1.Steinberg MH, Rodgers GP. Pharmacologic modulation of fetal hemoglobin. Medicine (Baltimore) 2001;80:328–344. doi: 10.1097/00005792-200109000-00007. [DOI] [PubMed] [Google Scholar]
- 2.Perrine SP. Fetal globin induction – can it cure beta thalassemia? Am Soc Hematol Educ Program. 2005:38–43. doi: 10.1182/asheducation-2005.1.38. [DOI] [PMC free article] [PubMed] [Google Scholar]
- 3.Atweh GF, Sutton M, Nassif I, et al. Sustained induction of fetal hemoglobin by pulse butyrate therapy in sickle cell disease. Blood. 1999;93:1790–1797. [PMC free article] [PubMed] [Google Scholar]
- 4.Collins AF, Pearson HA, Giardina P, McDonagh KT, Brusilow SW, Dover GJ. Oral sodium phenylbutyrate therapy in homozygous beta thalassemia: a clinical trial. Blood. 1995;85:39–43. [PubMed] [Google Scholar]
- 5.Perrine Susan P, Castaneda SA, Boosalis MS, White GL, Jones BM, Bohacek R. Induction of fetal globin in beta thalassemia: cellular obstacles and molecular progress. Ann N Y Acad Sci. 2005;1054:1–9. doi: 10.1196/annals.1345.033. [DOI] [PMC free article] [PubMed] [Google Scholar]
- 6.Liakopoulou E, Blau CA, Li Q, et al. Stimulation of fetal hemoglobin production by short chain fatty acids. Blood. 1995;86:3227–3235. [PubMed] [Google Scholar]
- 7.Perrine SP, Greene MF, Faller DV. Delay in the fetal globin switch in infants of diabetic mothers. N Engl J Med. 1985;312:334–338. doi: 10.1056/NEJM198502073120602. [DOI] [PubMed] [Google Scholar]
- 8.Boosalis MS, Bandyopadhyay R, Bresnick EH, et al. Short-chain fatty acid derivatives stimulate cell proliferation and induce STAT-5 activation. Blood. 2001;97:3259–3267. doi: 10.1182/blood.v97.10.3259. [DOI] [PMC free article] [PubMed] [Google Scholar]
- 9.Constantoulakis P, Knitter G, Stamatoyannopoulos G. On the induction of fetal hemoglobin by butyrates: in vitro and in vivo studies with sodium butyrate and comparison with combination treatments with 5-AzaC and Ara-C. Blood. 1989;74:1963–1971. [PubMed] [Google Scholar]
- 10.Skarpidi E, Cao H, Heltweg B, et al. Hydroxamide derivatives of short-chain fatty acids are potent inducers of human fetal globin gene expression. Exp Hematol. 2003;31:197–203. doi: 10.1016/s0301-472x(02)01030-5. [DOI] [PubMed] [Google Scholar]
- 11.Cappellini MD, Graziadei G, Ciceri L, et al. Oral isobutyramide therapy in patients with thalassemia intermedia: results of a phase II open study. Blood Cells Mol Dis. 2000;26:105–111. doi: 10.1006/bcmd.2000.0283. [DOI] [PubMed] [Google Scholar]
- 12.Liakopoulou E, Qiliang L, Stamatoyannopoulos G. Induction of fetal hemoglobin by propionic and butyric acid derivatives: correlations between chemical structure and potency of HbF induction. Blood Cells Mol Dis. 2002;29:48–56. doi: 10.1006/bcmd.2002.0537. [DOI] [PMC free article] [PubMed] [Google Scholar]
- 13.Perrine SP, Miller BA, Faller DV, et al. Sodium butyrate enhances fetal globin gene expression in erythroid progenitors of patients with Hb SS and beta thalassaemia. Blood. 1989;74:454–459. [PubMed] [Google Scholar]
- 14.Perrine SP, Rudolph A, Faller DV, et al. Butyrate infusions in the ovine fetus delay the biologic clock for globin gene switching. Proc Natl Acad Sci USA. 1988;85:8540–8542. doi: 10.1073/pnas.85.22.8540. [DOI] [PMC free article] [PubMed] [Google Scholar]
- 15.Perrine SP, Ginder GD, Faller DV, et al. A short-term trial of butyrate to stimulate fetal globin gene expression in the beta globin disorders. N Engl J Med. 1993;328:81–86. doi: 10.1056/NEJM199301143280202. [DOI] [PubMed] [Google Scholar]
- 16.Pace B, White GL, Dover GJ, Boosalis MS, Faller DV, Perrine SP. Short chain fatty acid derivatives induce fetal globin expression and erythropoiesis in vivo. Blood. 2002;100:4640–4648. doi: 10.1182/blood-2002-02-0353. [DOI] [PMC free article] [PubMed] [Google Scholar]
- 17.Little J, Dempsey NJ, Tuchman M, Ginder GD. Metabolic persistence of fetal hemoglobin. Blood. 1995;85:1712–1718. [PubMed] [Google Scholar]
- 18.McMartin C, Bohacek RJ. Flexible matching of test ligands to a 3D pharmacophore using a molecular superposition force field: comparison of predicted and experimental conformations of inhibitors of three enzymes. J Comput Aided Mol Des. 1995;9:237–250. doi: 10.1007/BF00124455. [DOI] [PubMed] [Google Scholar]
- 19.McMartin C. The FLO/QXP Molecular Modeling software. Colebrook, CT, USA: Thistlesoft; [Last accessed 25 May 2006]. Available at: cmcma@ix.netcom.com. [Google Scholar]
- 20.McMartin C, Bohacek RJ. QXP: powerful, rapid computer algorithms for structure-based drug design. J Comput Aided Mol Des. 1997;11:333–344. doi: 10.1023/a:1007907728892. [DOI] [PubMed] [Google Scholar]
- 21.Bohacek R, De Lombaert S, McMartin C, Priestle J, Grutter M. Three-dimensional models of ACE and NEP inhibitors and their use in the design of potent dual ACE/NEP inhibitors. JACS. 1996;118:8231–8249. [Google Scholar]
- 22.Ksander GM, de Jesus R, Yuan A, Ghai RD, McMartin C, Bohacek R. Meta-substituted benzofused macrocyclie lactams as zinc metalloprotease inhibitors. J Med Chem. 1997;40:506–514. doi: 10.1021/jm960583g. [DOI] [PubMed] [Google Scholar]
- 23.Ksander GM, de Jesus R, Yuan A, Ghai RD, Trapani A, McMartin C, Bohacek R. Ortho-substituted benzofused macrocyclic lactams as zinc metalloprotease inhibitors. J Med Chem. 1997;40:95–505. doi: 10.1021/jm960582o. [DOI] [PubMed] [Google Scholar]
- 24.Natesh R, Schwager SLU, Evans HR, Sturrock ED, Acharay KR. Structural details on the binding of antihypertensive drugs captopril and enalaprilat to human testicular angiontensin l-converting enzyme. Biochemistry. 2004;43:8718–8724. doi: 10.1021/bi049480n. [DOI] [PubMed] [Google Scholar]
- 25.DeLano W. The PyMOL Molecular Graphics System. San Carlos, CA, USA: DeLano Scientific LLC; [Last accessed 25 May 2006]. Available at: http://www.pymol.org. [Google Scholar]
- 26.Wittich S, Scherf H, Xie C, et al. Structure-activity relationships on phenyl-alanine-containing inhibitors of histone deacetylase: in vitro enzyme inhibition, induction of differentiation, and inhibition of proliferation in Friend leukemic cells. J Med Chem. 2002;45:3296–3309. doi: 10.1021/jm0208119. [DOI] [PubMed] [Google Scholar]
- 27.Cao H, Stamatoyannopoulos G, Jung M. Induction of human γ globin gene expression by histone deacetylase inhibitors. Blood. 2004;103:701–709. doi: 10.1182/blood-2003-02-0478. [DOI] [PMC free article] [PubMed] [Google Scholar]
- 28.Mankidy R, Faller DV, Boosalis MS, Bohacek R, Perrine SP. Mechanisms of gamma globin promoter activation by HbF-inducing short chain fatty acid derivatives. Blood. 2005;106:826a. (abstract) [Google Scholar]