Abstract
Water is present in cortical bone in different binding states. In this study we aimed to investigate the effects of inversion time (TI) on the signal from bound and pore water in cortical bone using an adiabatic inversion recovery prepared ultrashort echo time (IR-UTE) sequence on a clinical 3T scanner. In total ten bovine midshaft samples and four human tibial midshaft samples were harvested for this study. Each cortical sample was imaged with the UTE and IR-UTE sequences with a TR of 300 ms and a series of TIs ranging from 10 to 240 ms. Five healthy volunteers were also imaged with the same sequence. Single- and bi-component models were utilized to calculate the T2* and relative fractions of short and long T2* components. Bi-component behavior of the signal from cortical bone was seen with the IR-UTE sequence except with a TI of around 80 ms where the short T2* component alone were seen and a mono-exponential decay pattern was observed. In vivo imaging with the IR-UTE sequence provided high contrast-to-noise images with direct visualization of bound water and reduced signal from long T2 muscle and fat. Our preliminary results demonstrate that selective nulling of the pore water component can be achieved with the IR-UTE sequence with an appropriate TI, allowing selective imaging of the bound water component in cortical bone in vivo using clinical MR scanners.
Keywords: UTE, IR-UTE, bound water, pore water, cortical bone
Introduction
Cortical bone is a composite material containing approximately 25% water by volume (1–3). This water is present in various locations and in different binding states. In normal bone, most of the water is loosely bound to the organic matrix (4–8). There is also a significant amount of pore water residing in the pores of the Haversian and lacunocanalicular systems, which is responsible for nutrient diffusion and contributes to the viscoelastic properties of cortical bone (3, 9).
Separation of bound water from pore water is of critical importance since the two are associated with different contributions to the mechanical properties of cortical bone (5–7, 10). Specifically, higher pore water fraction is seen in more porous and weaker bone, whereas higher bound water fraction (reflecting organic matrix density) is seen in stronger bone. Assessing these two components may provide surrogate markers for the material properties of bone and it is important to distinguish them from one another.
Traditionally, nuclear magnetic resonance (NMR) spectrometers have been used to visualize and quantify bound and pore water in cortical bone (5–8). Of particular interest are clinically compatible MR imaging techniques that allow visualization of bone water, such as ultrashort echo time (UTE) sequences that can encode the rapidly decaying signal from cortical bone before it reaches zero or near zero levels (11–16). Selective, direct imaging of bound water could provide a direct correlation with bone strength. Application of a bi-component model to the UTE signal has allowed assessment of the organic matrix (bound water) and bone porosity (pore water) using clinical MR scanners (17–19). Other approaches, including water- and fat-suppressed proton projection MRI (WASPI) (20), and adiabatic inversion recovery preparation with UTE acquisition (11, 21–25), have also been investigated.
However, accurate quantification of bound and pore water content in cortical bone is technically challenging. Bound water and pore water have very different apparent transverse relaxation times (T2*s). Pore water has a relatively short T2* on the order of milliseconds while bound water has an ultrashort T2* of around 300 microseconds (17–19). Excitation efficiency is affected by multiple factors including the pulse shape and flip angle (26). Pore water with a longer T2* is excited more efficiently than bound water with a shorter T2*. Bound water is excited more efficiently with a high power short rectangular pulse than a slice-selective soft pulse (such as half sinc pulse). Adiabatic inversion recovery prepared UTE (IR-UTE) sequences have been proposed as a promising approach to separate bound water from pore water, hypothesizing that the longitudinal magnetization of pore water is more efficiently inverted than that of bound water by the adiabatic inversion pulse, and thus allowing potential separation of these two (24, 25). However, there is no direct evidence showing that adiabatic inversion pulse can selectively invert the longitudinal magnetization of pore water but not bound water. Furthermore, the degree of pore water suppression is believed to be dependent on the inversion time (TI), which has not been well investigated. An appropriate choice of TI may be critical for accurate separation of bound water and pore water.
In this study, we aimed to investigate the effects of TI on bound and pore water signal in cortical bone using two-dimensional (2D) ultrashort echo time (UTE) sequences as well as adiabatic inversion recovery preparation UTE (IR-UTE) sequences operated on a clinical whole body 3T scanner. Phase information was employed to confirm the separation of bound and pore water using an adiabatic inversion pulse. Bi-component analysis was employed to confirm the existence of bound and pore water components in cortical bone, and to investigate the relation between TI and pore water suppression. Bovine and human cortical bone samples as well as the tibial midshafts of healthy volunteers were studied.
Materials and Methods
Sample Preparation
Ten mature bovine midshaft samples and four human tibial midshaft samples were harvested for this study. The bovine samples were obtained fresh from a local slaughterhouse and cleared of all external soft tissues utilizing a scalpel. Cadaveric human tibial midshaft bone samples were harvested from the legs of four donors obtained from the University of California, San Diego (UCSD) morgue (without detailed demographic information or record of the cause of death). These human bone samples were also cleared of external muscle and marrow fat. Using a precision circular diamond-edge saw (ISOMET 1000, Buehler, Lake Bluff, IL) and saline irrigation, rectangular slabs of bovine cortical bone were sectioned without any marrow fat contamination. These had dimensions of ~20 × 10×2 mm3 (length × width × height), measured with a digital caliper. Cross-sectional human cortical bone segments with an approximate thickness of ~20 mm were cut transversely. Individual samples of both types were placed in phosphate buffered saline (PBS) solution for 24 hours and stored at 4 °C prior to UTE free induction decay (FID) and IR-UTE FID sampling or UTE/IR-UTE imaging (details below). The samples were equilibrated to room temperature (21°C) before imaging.
UTE and IR-UTE FID Sampling
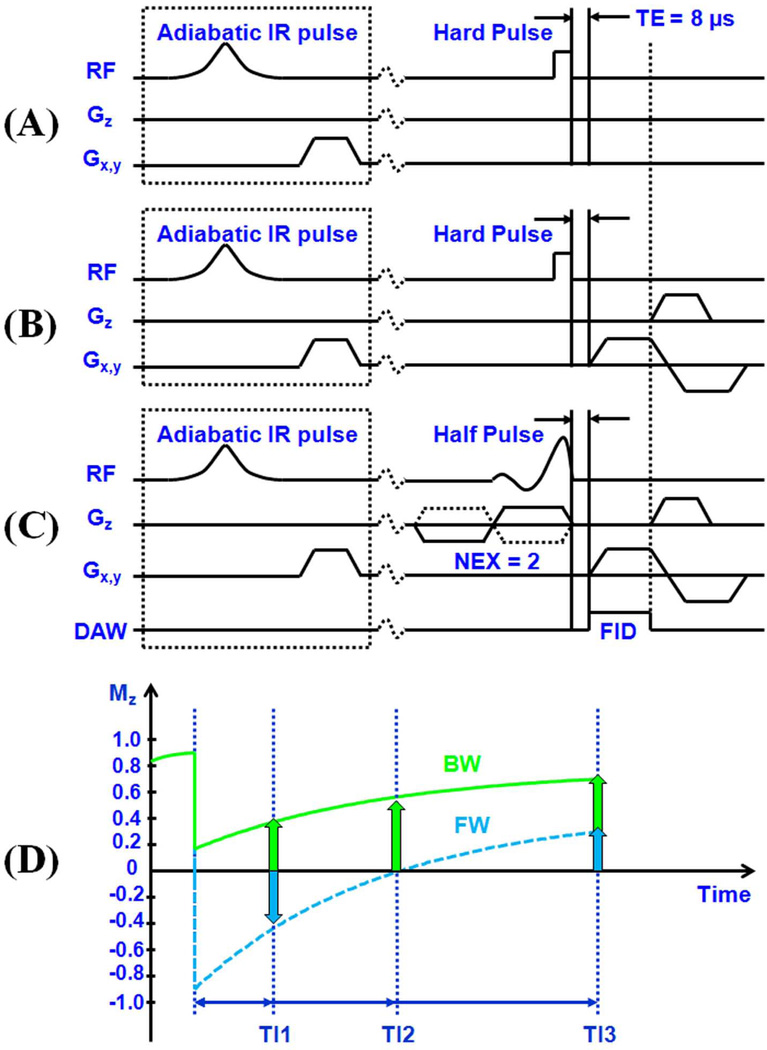
We implemented both UTE and IR-UTE FID pulse sequences on a 3T Signa Twin-Speed scanner (GE Healthcare Technologies, Milwaukee, WI). This system had a maximum gradient strength of 40 mT/m and a maximum slew rate of 150 mT/m/ms. The UTE FID sequence used a short rectangular pulse (32 µs in duration) for signal excitation, followed by fast FID sampling with all spatial encoding gradients turned off (Figure 1A). The minimal delay time between the radiofrequency (RF) excitation and the FID sampling was 8 µs. The IR-UTE FID sequence employed an adiabatic inversion recovery preparation pulse (Silver-Hoult pulse, duration = 8.64 ms) followed by UTE FID sampling (Figure 1A). The adiabatic inversion pulse was used to selectively invert the longitudinal magnetization of pore water with a longer T2* (T2* ~ 1–3 ms at 3T) (Figure 1D). Bound water with a short T2* (T2* ~ 0.3 ms) was uninverted and partially saturated as a consequence of its significant transverse relaxation during the relatively long adiabatic inversion process (21–23). A home-made solenoid coil (1 cm diameter) was used for signal excitation and reception. The coil was machined with the rolled copper wires press fitted around a hard glass tube, eliminating the use of adhesive which might have provided signal detectable with UTE sampling and could have contaminated the FID data. The UTE and IR-UTE FID sequences were applied to bovine cortical bone samples only when marrow fat contamination had been eliminated. The human bone samples still contained significant amount of bone marrow fat and were not used for FID sampling. With this technique a spectrum with a total of 4096 points was sampled with a bandwidth of 125 kHz (or 8 µs per sampling point). UTE FID data as well as IR-UTE FID data with a series of inversion times (TIs = 10–240 ms) were collected. Other sampling parameters included a TR of 300 ms, a small flip angle of 10°, and a number of excitations (NEX) of 256. Each bovine bone sample was placed in a 10 ml syringe filled with Fomblin (Solvay Solexis, West Deptford, NJ) during MR imaging in order to maintain hydration and minimize susceptibility effects at air-bone junctions.
Figure 1.
Two dimensional UTE sequences developed for FID sampling which employs a short rectangular pulse excitation followed by FID data acquisition with all gradients turned off (A), non-slice selective imaging which employs a short rectangular pulse excitation followed by 2D radial ramp sampling (B), and slice-selective imaging which employs a half-pulse excitation followed by 2D radial ramp sampling (C). The UTE sequences can be further combined with an adiabatic inversion recovery preparation pulse for IR-UTE imaging of bound and pore water components in cortical bone. (D) MZ plotted against TI for bound water (BW) and pore water (FW). This shows the IR-UTE mechanism for imaging of bound and pore water components in cortical bone. With a shorter TI (TI1), pore water magnetization is negative while the partially saturated bound water magnetization is positive. With an appropriate TI (TI2), pore water is nulled and the signal is entirely from bound water. With a longer TI (TI3), both bound and pore water magnetization are positive.
UTE and IR-UTE Imaging of Bone Samples
We also implemented 2D non-slice selective UTE and IR-UTE sequences on the same 3T whole-body clinical scanner. The IR-UTE imaging sequence employed an adiabatic inversion recovery preparation pulse to selectively invert the longitudinal magnetization of pore water which had a longer T2*, and a short rectangular hard pulse (duration = 32 µs) to excite both bound water and pore water prior to data collection. The short rectangular pulse together with radial ramp sampling and fast transmit/receive switching allowed use of a very short nominal TE of 8 µs (Figure 1B). This permitted detection of both pore water residing in the microscopic pores of cortical bone, and water bound to the organic matrix. The adiabatic IR pulse was used to invert and partially or wholly null the longitudinal magnetization of pore water. The longitudinal magnetization of bound water was not inverted but partially saturated. The degree of pore water signal suppression depended on the choice of TI (Figure 1D).
We used a short rectangular pulse for the non-slice selective 2D excitation in order to enhance signal to noise ratio (SNR), and to eliminate errors due to eddy currents associated with conventional half-pulse excitation. On the ex vivo samples, the 2D non-slice selective UTE imaging protocol was used with the following parameters: TR = 300 ms, FOV = 8 cm, matrix = 128×128, 211 projections, bandwidth = 125 kHz, 20 TEs (0.01, 0.1, 0.2, 0.3, 0.4, 0.5, 0.6, 0.8, 1.0, 1.2, 1.4, 1.6, 2, 2.5, 3, 4, 5, 6, 7, 8 ms), 1 min per image. In addition the 2D IR-UTE protocol was used with a series of TIs (10, 20, 30, 40, 80, 120, 160, 200 and 240 ms) together with the other imaging parameters described above. The total imaging time was about 200 min per bone sample. The solenoid coil was used for signal excitation and reception with the bovine bone samples. A wrist birdcage transmit/receive coil (~12.5 cm in diameter) (BC-10, Medspira, Minneapolis, MN) was used for signal excitation and reception with the human bone samples. Each bovine bone sample was placed in a 30 ml syringe, while each human bone sample was placed in a 200 ml plastic container (cylinder shape). Each was filled with Fomblin during MR imaging in order to maintain hydration and minimize susceptibility effects at air-bone junctions. Both magnitude and phase images were reconstructed.
UTE and IR-UTE Imaging of Volunteers
For in vivo imaging, slice-selective UTE sequences were used, where the short rectangular pulse was replaced by a half SINC pulse (duration = 472 µs, bandwidth = 2.7 kHz) (Figure 1C). For each radial line of k-space, two acquisitions were performed by collecting data with the slice selection gradient in one direction and adding this data to that collected with the slice selection gradient reversed (27). The slice-selective UTE sequences are subject to eddy currents, which are minimized by employing bipolar slice selective gradients and readout gradients (eddy currents from the paired positive and negative gradients add destructively, reducing both the short term and long term eddy currents), as well as manually tuned gradient timing delays (22). The slice-selective 2D UTE and IR-UTE sequences were used to image the mid-diaphyseal tibia in five healthy volunteers (4 males, 1 female, 27 to 69 years, average age 46). Written informed consent approved by our Institutional Review Board was obtained prior to participation from each subject. The imaging parameters included: FOV = 15 cm, readout = 256, number of projections = 255, bandwidth = 125 kHz, slice thickness = 7 cm, flip angle = 45°, TR = 300 ms, 10 TEs (0.01, 0.1, 0.2, 0.4, 0.6, 1.0, 1.4, 2, 3, 4 ms) and TIs of 80, 110 and 140 ms, 2.55 min per IR-UTE scan, a total scan time of 84 min for each volunteer. An eight-channel phased array transmit/receive coil (Invivo Corporation, Gainesville, Florida, USA) was used for signal transmission and reception.
MR Data Analysis
A semi-automated Matlab (The Mathworks Inc., Natick, MA) program was developed for bi-component analysis of bound and pore water T2*s and the relative fractions (17). The program allowed placing of regions of interest (ROIs) on the first image of the series. These were then copied to the corresponding position on each of the subsequent images. The mean signal intensity within each of the ROIs was used for subsequent curve fitting. For single component analysis the UTE or IR-UTE signal S(t) were fitted with the following model:
| [1] |
For bi-component analysis the UTE or IR-UTE signal S(t) were fitted with the following model (18, 28):
| [2] |
where T2S* is the short water T2*, T2L* is the long water T2*, AS and AL are the signal amplitudes of the short and long T2* components. Apparent bound water fraction was defined as AS/(AS+AL). Background noise was automatically estimated using a maximum likelihood estimation (MLE) distribution fitting of a partial histogram. Non-negative least-square curve fitting was employed for the bi-component model. After fitting was finished, goodness of fit statistics including the R-squared value, mean squared error, root mean squared error, and standard error were computed. A fit curve along with its 95% confidence intervals (CI) was also created. Phase images were used to demonstrate the effect of pore water inversion and signal nulling as a function of TI. The effect of TI on bound water fraction was analyzed.
Results
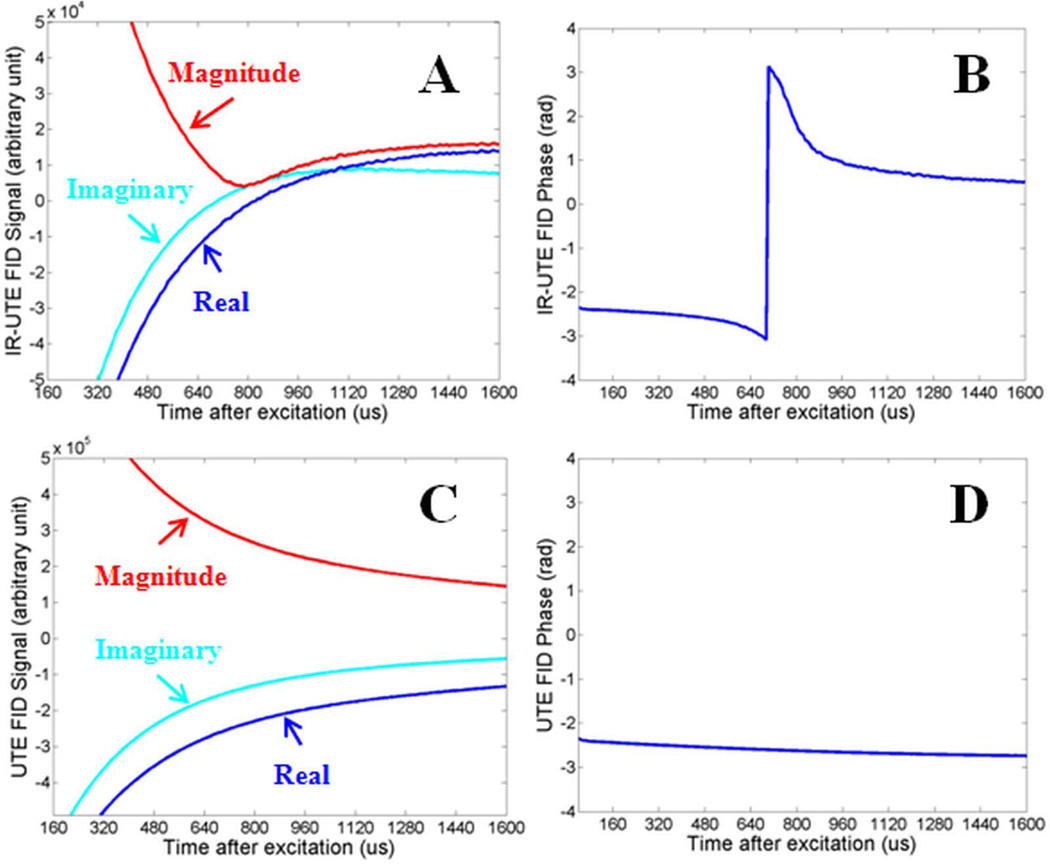
Figure 2 shows the UTE FID signal, including magnitude, complex and phase information, from a bovine cortical bone sample as well as those from an IR-UTE sequence with a TI of 20 ms. The IR-UTE sequence shows a null of the FID signal at around 0.7 ms with a subsequent rebound. The nulling suggests that the inverted pore water magnetization cancelling out the positive magnetization from the uninverted bound water.
Figure 2.
Real, imaginary and magnitude of complex FIDs of a bovine cortical bone sample acquired with IR-UTE with a TR of 300 ms and a TI of 20 ms (A), and UTE with a TR of 300 ms (C), and the corresponding phase plot (B, D) as a function of time after excitation. Nulling and rebounding of pore water signal was observed in IR-UTE FID magnitude (A) and phase (B) plots, but not in UTE FID magnitude (C) and phase (D) plots.
Figure 3 shows selected magnitude and phase images from IR-UTE imaging of a cadaveric human bone sample using a TR of 300 ms and a short TI of 20 ms. A positive phase was observed with TEs less than 0.4 ms (i.e., ϕ= 0.27 for TE of 8 µs, ϕ = 0.74 for TE of 0.4 ms), and a negative phase was observed with longer TEs in the range of 0.8~1.6 ms (i.e., ϕ = −2.47 for TE of 0.6 ms and ϕ = −2.03 for TE of 1.4 ms). This suggests that the net signal is dominated by the positive bound water magnetization initially, and by the negative pore water magnetization later.
Figure 3.
Normalized magnitude signal decay curve for IR-UTE images of a cadaveric human bone sample with a TR of 300 ms, a TI of 20 ms and TEs ranging from 8 µs to 5 ms (A), and selected magnitude and corresponding phase images with a TE of 8 us (B, F), 0.4 ms (C, G), 0.6 ms (D, H) and 1.4 ms (E, I). The relative longitudinal magnetizations of bound water (BM) and pore water (FW) at different TEs are also shown in (A), where the positive signal from bound water dominates the IR-UTE signal at short TEs. This signal decays quickly with increasing TEs, leaving the negative signal from pore water which decays more slowly dominating the IR-UTE signal at longer TEs. In subfigures (F) to (I) the signals were of opposite phase before and after TE of 0.5 ms (i.e., ϕ = 0.27 for TE of 8 µs, ϕ = 0.74 for TE of 0.4 ms, while ϕ = −2.47 for TE of 0.6 ms and ϕ = −2.03 for TE of 1.4 ms), consistent with a transition from positive to negative net magnetization at TE ~0.5 ms, the null point.
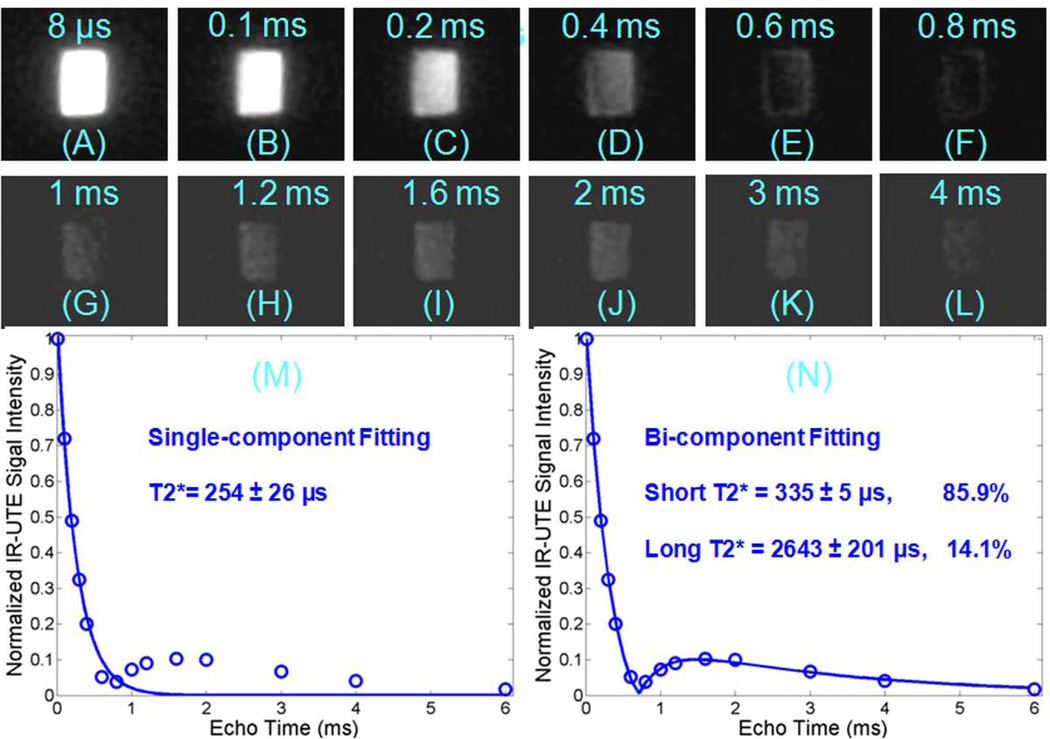
Figure 4 shows IR-UTE images at a TR of 300 ms and TI of 20 ms of bovine cortical bone with 12 echoes ranging from 8 µs to 4 ms. Bone signal dropped to a minimum at a TE of 0.8 ms, increased to a peak at a TE of 1.6 ms, and then kept decreasing to near zero with further increase in TE (A-L). The T2* signal decay is inadequately fitted with a single component fitting model (M). A bi-component fitting model allows excellent fitting (residual signal less than 1%, R2 = 0.9983) of data points with generation of short and long T2* fractions and T2* values (N).
Figure 4.
IR-UTE imaging of a bovine cortical bone acquired with a TR of 300 ms, TI of 20 ms, and TEs of 0.01 (A), 0.1 (B), 0.2 (C), 0.4 (D), 0.6 (E), 0.8 (F), 1.0 (G), 1.2 (H), 1.6 (I), 2.0 (J), 3.0 (K), 4.0 ms (L), as well as the corresponding single-component (M) and bi-component fitting (N). The signal decayed to a minimum at about 0.8 ms (F), increased again to a peak at about 1.6 ms (I), then decayed again with increasing TE (J–L). The single component fit is poor with residual signal more than 10% (M), but the bi-component fit is excellent (N), with 85.9% of the signal from the bound water component and 14.1% from the pore water component.
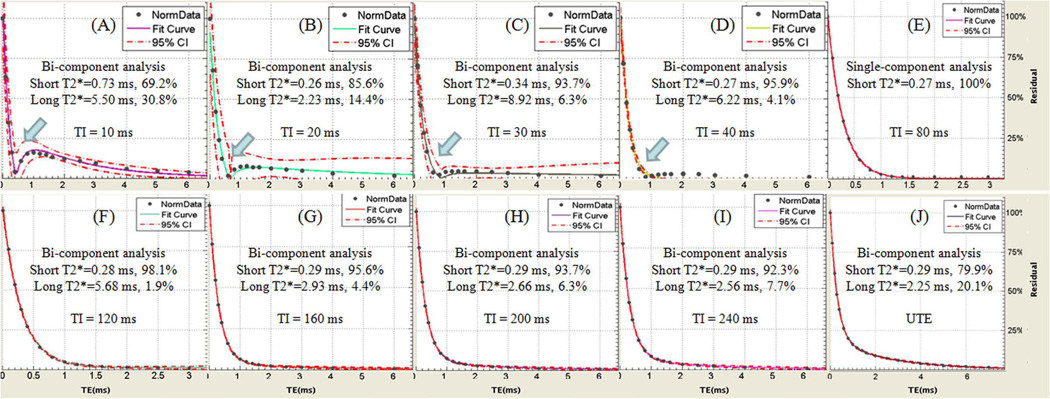
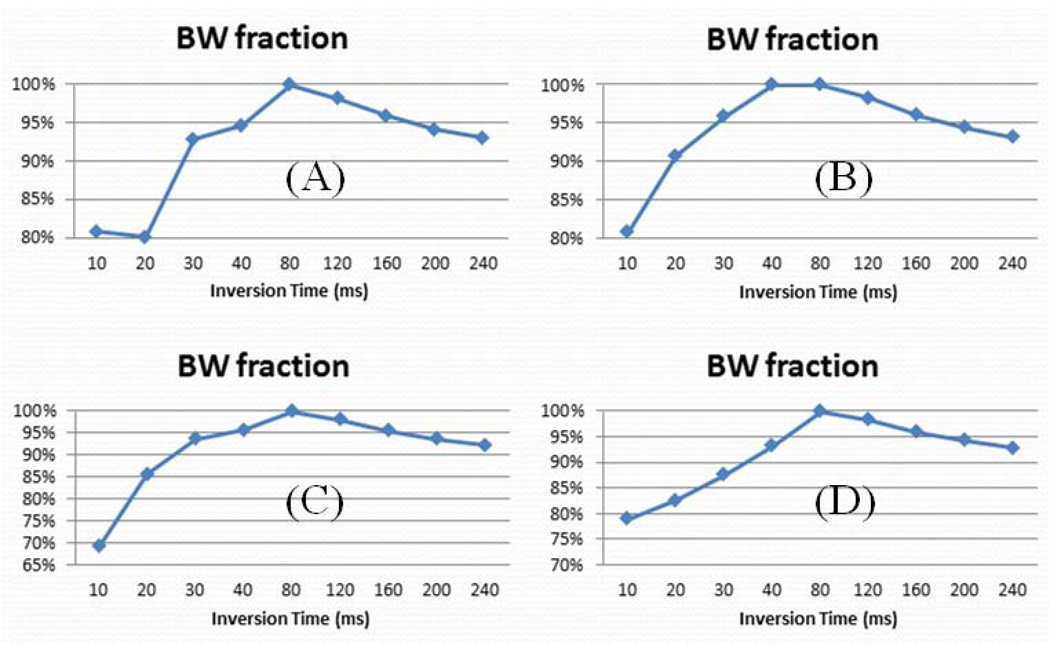
Figure 5 shows a summary of short and long water T2*s and their relative fractions for a bovine cortical bone sample with a TR of 300 ms and different TIs ranging from 10 ms to 240 ms. A relatively high pore water fraction was observed with very short TIs (TI < 40 ms) and with long TIs (TI > 120 ms). In these TI ranges pore water was not nulled and contributed to the IR-UTE signal. Single component decay was observed with IR-UTE imaging using TIs of ~80 ms, consistent with effective nulling of pore water. Figure 6 shows bound water fraction as a function of TI for four bovine bone samples (similar results were observed for the other two bovine bone samples). Nulling of pore water was observed with a TR of 300 ms and a TI of 80 ms, corresponding to maximum bound water fraction in each sample. Lower bound water fraction corresponding to increased pore water signal was observed at lower and higher TIs than 80 ms.
Figure 5.
Bi-component fitting of IR-UTE (A–I) and UTE(J) images of a bovine cortical bone sample with TIs of 10 ms (A), 20 ms (B), 30 ms (C), 40 ms (D), 80 ms (E), 120 ms (F), 160 ms (G), 200 ms (H), 240 ms (I). UTE signal shows bi-component decay with 20% pore water and 80% bound water (J), while a single component was observed with a TI of 80 ms (E). Bi-component decay was observed with other TIs lower and higher than 80 ms due to imperfect nulling of the pore water components.
Figure 6.
IR-UTE assessed bound water fractions as a function of TI for 4 bovine cortical bone samples (A–D). Reduced bound water fraction was observed at lower and higher TIs than 80 ms.
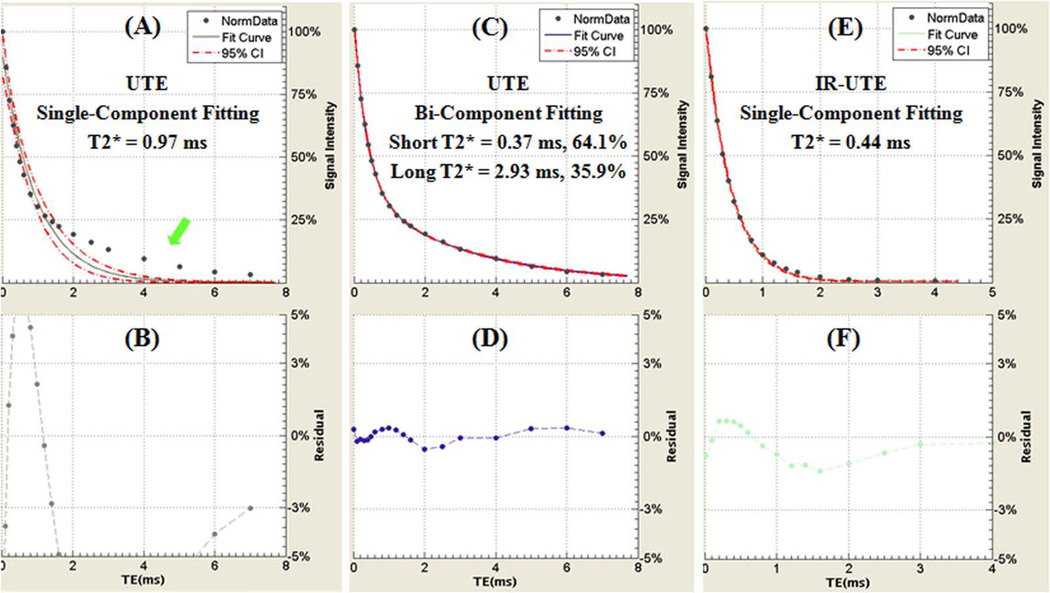
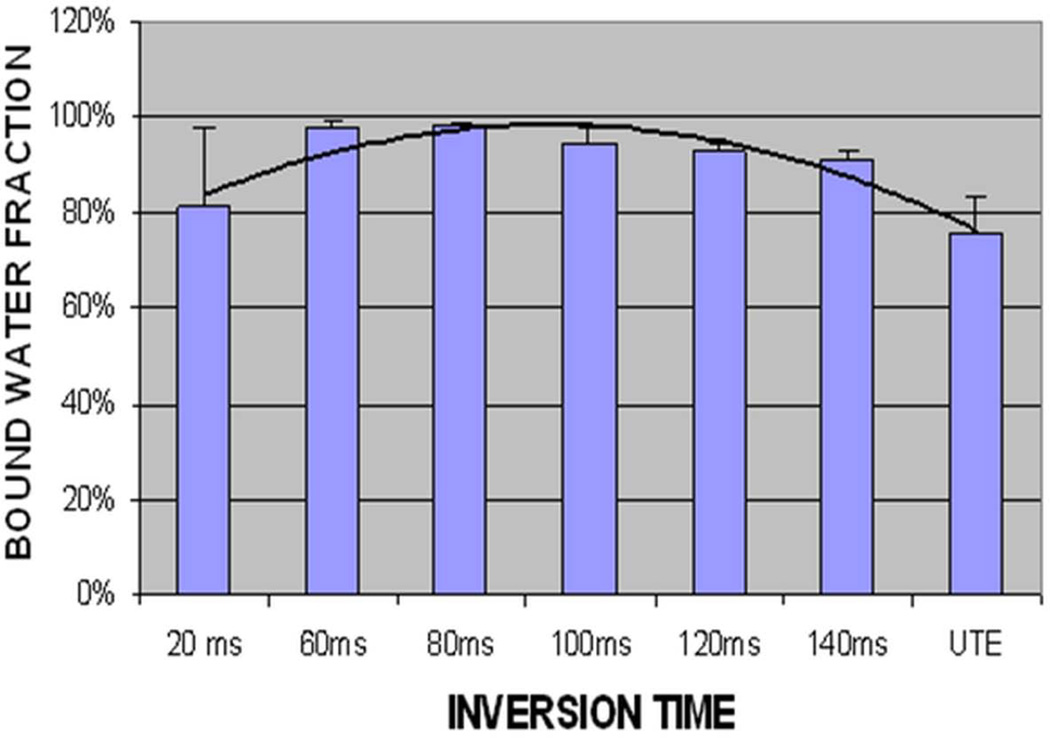
Figure 7 shows single- and bi-component fitting of UTE and IR-UTE images of a human cortical bone sample with a TR of 300 ms and a TI of 80 ms. UTE images show bi-component decay behavior consistent with two distinct water components in cortical bone. The IR-UTE images show a single component decay, consistent with pore water with a longer T2* being selectively inverted and nulled by the adiabatic IR pulse, while bound water with a shorter T2* recovers during TI and is selectively detected by the UTE sampling. Figure 8 shows the relationship of bound water fraction and TI from a representative human cortical bone sample. At a TR of 300 ms and a TI of approximately 80 ms, the short T2* fraction approaches 100%. Similar results are observed for other human cortical bone samples (bound water accounts for more than 95% of the total IR-UTE signal with TIs ranging from 80 ms to 120 ms).
Figure 7.
Single-component fitting (A) and bi-component fitting (C) of UTE images of a human cortical bone sample acquired with a TR of 300 ms and TEs ranging from 0.008 to 7 ms. The corresponding fitting residuals are shown in (B) and (D). The single-component model fits poorly while the bi-component fits well suggesting the existence of two water components in cortical bone with distinct T2* relaxation times. A single-component model fits well for the IR-UTE signal decays with a TI of 80 ms (E), with the fitting residuals (F) less than 2% consistent with nulling of the pore water component.
Figure 8.
Bound water fraction of IR-UTE imaging of a human cortical bone sample acquired with a TR of 300 ms and a series of TIs ranging from 20 ms to 140 ms. Increased short T2* fraction is seen with TIs of around 80 ms.
Figure 9 shows the feasibility of in vivo imaging in the tibia of a healthy volunteer. Compared with UTE images, the IR-UTE images demonstrate reduced signal-to-noise, but show much higher contrast-to-noise. With a TI of 110 ms, there is reduced signal from both fat and the pore water pool, leaving bound water selectively detected, as confirmed by the excellent single-component fitting (residual signal less than 1%, R2 = 0.9965) of the IR-UTE signal decay shown in Figure 10. Increased contrast for muscle and fat were observed at longer TEs due to fast signal decay from cortical bone, which dominated the IR-UTE signal at shorter TEs. A single-exponential signal decay behavior was also observed for the other three human volunteers (results not shown), suggesting that the IR-UTE sequences can be used to robustly image bound water in cortical bone in vivo using clinical MR scanners.
Figure 9.

In vivo imaging of the tibial midshaft of a 39 year old healthy female volunteer with UTE (A), IR-UTE with a TI of 80 ms (B), 110 ms (C) and 140 ms (D). A TR of 300 ms was used for all sequences. Increased contrast was achieved in imaging the tibia (thick arrow) with a TR of 300 ms and a TI of 110 ms. Surrounding pads (arrow heads) are also visible.
Figure 10.
IR-UTE imaging of the tibial midshaft of a 39 year old healthy female volunteer with a TR of 300 ms, a TI of 110 ms, and TEs of 8 µs (A), 0.1 ms (B), 0.2 ms (C), 0.4 ms (D), 0.6 ms (E), 1.0 ms (F), 1.5 ms (G) and 2.5 ms (H) as well as single-component fitting of the bone signal decay (I), which accounted for 99.88% of the signal variance, consistent with only bound water with a T2* of 347 ± 10 µs being detected by the IR-UTE sequence. Residual signals from muscle and fat were better observed at longer TEs due to fast signal decay from cortical bone, which dominated the IR-UTE signal at shorter TEs.
Discussion
Recent studies suggest that UTE sequences can detect both bound and pore water in cortical bone using clinical whole-body scanners (17–25). However, the acquired UTE signal is a combination of the short and long T2 components, which have opposed effects on the overall mechanical properties of cortical bone (5–7, 10). More recently, selective imaging of the short T2 components has been demonstrated using the inversion recovery prepared UTE sequences (23–25). Magnetization preparation with an adiabatic inversion pulse effects both bound and pore water components in cortical bone. In comparison to the bound water component which has an extremely short T2* and is not inverted but partially saturated by the relatively long adiabatic inversion pulse, the pore water component with almost ten times longer T2* is more effectively inverted (e.g., negagive longitudinal magnetization) by the adiabatic inversion pulse.
In the current study, we systematically varied the TI and evaluated the effect of this on bone water signal. Initially we thought that fat residing in cortical bone (e.g., lipid in cement line) accounted for the “abnormal” signal rebound near TE of around 1.2 ms when a short TI was used (e.g., TI = 20 ms, TR = 300 ms) (29). However, further analysis shows that a bi-component model could fully explain this signal decay behavior assuming the longitudinal magnetizatoin of pore water being selectivley inverted by the adiabatic IR pulse. At short TEs the positive signal from bound water dominates the IR-UTE signal while at long TEs the negative signal from pore water dominates the IR-UTE signal. A complete signal cancellation is observed when the positive magnetization of bound water equals the negative magnetization of pore water. At longer TEs the negative signal from pore water, which decays much more slowly than the positive signal from bound water, dominates the IR-UTE signal, leading to the “abnormal” signal rebound when magnitude signal is used. The opposite phase before and after the null further demonstrates that the longitudinal magnetization of pore water is inverted, while that of bound water is not inverted by the adiabatic inversion pulse. At shorter TEs before the null point the positive longitudinal magnetization of bound water dominates, leading to a positive phase. At longer TEs after the null point the negative longitudinal magnetization of pore water dominates, leading to a negative phase. Different null points were observed for bovine and human cortical bone samples due to their different fractions of bound and pore water components. On the other hand, it is difficult to explain the opposite phase before and after the null by simply assuming lipid contributing to IR-UTE signal. The amount of lipid in cement line might be too low to be detected by the IR-UTE sequence, however, further research is needed.
At the shorter range of inversion times, UTE phase data confirmed an initial contribution to signal from both rapidly decaying bound water and more slowly decaying pore water components. The contribution of pore water to the overall signal decreased as TI was increased until at approximately 80 ms, where pore water was effectively nulled, only bound water contributed to the final signal. At TIs increasing beyond 80 ms, positive recovery of the pore water longitudinal magnetization contributed to the UTE signal.
Although previous studies have shown that pore water consists of a relatively broad spectrum of T1 values due to pore size variation (5, 8), our results show that with careful selection of TI, there can be sufficient nulling of the pore water net magnetization to render this component undetectable. Furthermore, while a single component fitting model would not adequately explain the signal decay behavior obtained with bone from standard UTE images (17–19), with complete nulling of pore water at a TI of around 80 ms, the best fit model is mono-exponential. In contrast, good quality curve fitting at other TI values is only achieved with the bi-component model.
The short T2* values obtained with the IR-UTE technique are comparable to the short T2* values for bone obtained with UTE techniques, and also are comparable to those published in other studies (6, 8, 19, 30), showing the robustness of bi-component analysis. The choice of TI mainly affects the fractions of bound and pore water components, not their T2* values. With a TR of 300 ms, a TI of 80 ms provides nearly complete nulling of the pore water component. This is largely consistent with the results of Horch et al (24), who reported that a TI of 90 ms (with a TR of 300 ms) allowed selective imaging of bound water in cortical bone. However, our study also suggests that near complete nulling of pore water can be achieved with a relatively broad range of TIs. This is imporatant for the clinical assessment of bound water in cortical bone since cortical bone is surrounded by muscle and marrow fat, which have quite different T1s. A certain TR and TI combination (e.g., TR = 300 ms, TI = 110 ms) allows nearly complete nulling of signal from both muscle and bone marrow fat as well as from pore water in cortical bone (22). This provides high contrast morphological imaging of bone, and allows accurate measurement of bound water content by comparing signal from bone to that of a reference phantom (e.g., rubber which has similar T1 and T2* values to cortical bone). Accurate measurement of bound and pore water components using UTE and IR-UTE imaging will be investigated in future studies.
There are several limitations to this study. Firstly, the nulling time TI is related to the choice of TR and the T1 of cortical bone, which were not measured in this study. Accurate measurement of T1 is technically challenging due to the very short T2* of cortical bone. The multiple water components in cortical bone have very different T2*s, and may have different T1s. It is difficult to accurately measure the T1s of the different water components in cortical bone, especially when using clinical whole-body MR scanners. Secondly, the UTE and IR-UTE bi-component analysis techniques are based on T2*, which is known to be sensitive to local field effects, including those due to B0 field inhomogeneity and local susceptibility differences. T2 is insensitive to these effects and multi-component analysis of T2 decay is believed to provide more accurate bound and pore water separation (10). However, it is technically difficult or impossible to measure the T2 of cortical bone using whole body clinical scanners due to RF limitations (the duration of a 180° is on the order of the T2* of cortical bone, precluding accurate refocusing of bone magnetization). Bound and pore water separation based on T2*, rather than T2, is probably a better option for clinical assessment of bone water components. Thirdly, we only investigated the effects of TI on bound and pore water components. Further studies are needed to investigate its clinical applications in measuring bound and pore water contents, correlating the measurements with micro computed tomography (µCT) porosity and the biomechanical properties of cortical bone samples, as well as assessing bound and pore water changes in healthy volunteers and patients with osteoporosis.
In conclusion, this study shows that the two water components detectable with UTE sequences respond differently to the adiabatic inversion pulse. The pore water component with longer T2* can be selectively nulled with an IR-UTE sequence when an appropriate combination of TR and TI is chosen. The IR-UTE sequence allows selective imaging of bound water, which may be useful for indirect quantification of collagen content and thus as a possible surrogate marker of bone strength.
Acknowledgement
The authors acknowledge grant support from GE Healthcare, NIH (1R21 AR063894-01A1 and 1R01 AR062581-01A1), and the Veterans Affairs Clinical Science Research and Development Service (1IK2CX000749).
Abbreviations used
- 2D
two-dimensional
- CI
confidence intervals
- FID
free induction decay
- IR
inversion recovery
- IR-UTE
inversion recovery prepared ultrashort echo time
- MLE
maximum likelihood estimation
- MRI
magnetic resonance imaging
- NEX
number of excitations
- NMR
nuclear magnetic resonance
- PBS
phosphate buffered saline
- RF
radio frequency
- ROI
region of interest
- SNR
signal to noise ratio
- TE
echo time
- TI
inversion time
- µCT
micro computed tomography
- UCSD
University of California, San Diego
- UTE
ultrashort echo time
- WASPI
water- and fat-suppressed proton projection MRI
References
- 1.Lees S. A mixed packing model for bone collagen. Calcif Tissue Int. 1981;33(6):591–602. doi: 10.1007/BF02409497. [DOI] [PubMed] [Google Scholar]
- 2.Elliott SR, Robinson RA. The water content of bone. I. The mass of water, inorganic crystals, organic matrix, and CO2 space components in a unit volume of the dog bone. J Bone Joint Surg. Am. 1957;39-A(1):167–188. [PubMed] [Google Scholar]
- 3.Cowin SC. Bone poroelasticity. J Biomech. 1999;32(3):217–238. doi: 10.1016/s0021-9290(98)00161-4. [DOI] [PubMed] [Google Scholar]
- 4.Nyman JS, Roy A, Shen X, Acuna RL, Tyler JH, Wang X. The influence of water removal on the strength and toughness of cortical bone. J Biomech. 2006;39(5):931–938. doi: 10.1016/j.jbiomech.2005.01.012. [DOI] [PMC free article] [PubMed] [Google Scholar]
- 5.Ni QW, Nyman JS, Wang XD, De Los Santos A, Nicolella DP. Assessment of water distribution changes in human cortical bone by nuclear magnetic resonance. Meas Sci Technol. 2007;18(3):715–723. [Google Scholar]
- 6.Nyman JS, Ni Q, Nicolella DP, Wang X. Measurements of mobile and bound water by nuclear magnetic resonance correlate with mechanical properties of bone. Bone. 2008;42(1):193–199. doi: 10.1016/j.bone.2007.09.049. [DOI] [PMC free article] [PubMed] [Google Scholar]
- 7.Wang X, Ni Q. Determination of cortical bone porosity and pore size distribution using a low field pulsed NMR approach. J Orthop Res. 2003;21(2):312–319. doi: 10.1016/S0736-0266(02)00157-2. [DOI] [PubMed] [Google Scholar]
- 8.Horch RA, Gochberg DF, Nyman JS, Does MD. Clinically-compatible MRI strategies for discriminating bound and pore water in cortical bone. Magn Reson Med. 2012;68(6):1774–1784. doi: 10.1002/mrm.24186. [DOI] [PMC free article] [PubMed] [Google Scholar]
- 9.Wehrli FW, Song HK, Saha PK, Wright AC. Quantitative MRI for the assessment of bone structure and function. NMR Biomed. 2006;19:731–764. doi: 10.1002/nbm.1066. [DOI] [PubMed] [Google Scholar]
- 10.Horch RA, Gochberg DF, Nyman JS, Does MD. Non-invasive Predictors of Human Cortical Bone Mechanical Properties: T-2-Discriminated H-1 NMR Compared with High Resolution Xray. PLoS ONE. 2011;6(1):e16359. doi: 10.1371/journal.pone.0016359. [DOI] [PMC free article] [PubMed] [Google Scholar]
- 11.Reichert IL, Robson MD, Gatehouse PD, He T, Chappell KE, Holmes J, Girgis S, Bydder GM. Magnetic resonance imaging of cortical bone with ultrashort TE pulse sequences. Magn Reson Imaging. 2005;23(5):611–618. doi: 10.1016/j.mri.2005.02.017. [DOI] [PubMed] [Google Scholar]
- 12.Du J, Hamilton G, Takahashi A, Bydder M, Chung CB. Ultrashort echo time spectroscopic imaging (UTESI) of cortical bone. Magn Reson Med. 2007;58(5):1001–1009. doi: 10.1002/mrm.21397. [DOI] [PubMed] [Google Scholar]
- 13.Techawiboonwong A, Song HK, Leonard MB, Wehrli FW. Cortical bone water: in vivo quantification with ultrashort echo-time MR imaging. Radiology. 2008;248:824–833. doi: 10.1148/radiol.2482071995. [DOI] [PMC free article] [PubMed] [Google Scholar]
- 14.Cao H, Nazarian A, Ackerman JL, Snyder BD, Rosenberg AE, Nazarian RM, Hrovat MI, Dai G, Mintzopoulos D, Wu Y. Quantitative (31)P NMR spectroscopy and (1)H MRI measurements of bone mineral and matrix density differentiate metabolic bone diseases in rat models. Bone. 2010;46(6):1582–1590. doi: 10.1016/j.bone.2010.02.020. [DOI] [PMC free article] [PubMed] [Google Scholar]
- 15.Weiger M, Pruessmann KP, Hennel F. MRI with zero echo time: hard versus sweep pulse excitation. Magn Reson Med. 2011;66:379–389. doi: 10.1002/mrm.22799. [DOI] [PubMed] [Google Scholar]
- 16.Grodzki DM, Jakob PM, Heismann B. Ultrashort echo time imaging using pointwise encoding time reduction with radial acquisition (PETRA) Magn Reson Med. 2012;67:510–518. doi: 10.1002/mrm.23017. [DOI] [PubMed] [Google Scholar]
- 17.Diaz E, Chung CB, Bae WC, Statum S, Znamirowski R, Bydder GM, Du J. Ultrashort echo time spectroscopic imaging (UTESI): an efficient method for quantifying bound and free water. NMR Biomed. 2012;25(1):161–168. doi: 10.1002/nbm.1728. [DOI] [PubMed] [Google Scholar]
- 18.Du J, Diaz E, Carl M, Bae W, Chung CB, Bydder GM. Ultrashort echo time imaging with bicomponent analysis. Magn Reson Med. 2012;67(3):645–649. doi: 10.1002/mrm.23047. [DOI] [PubMed] [Google Scholar]
- 19.Biswas R, Bae W, Diaz E, Masuda K, Chung CB, Bydder GM, Du J. Ultrashort echo time (UTE) imaging with bi-component analysis: bound and free water evaluation of bovine cortical bone subject to sequential drying. Bone. 2012;50(3):749–755. doi: 10.1016/j.bone.2011.11.029. [DOI] [PMC free article] [PubMed] [Google Scholar]
- 20.Wu Y, Hrovat MI, Ackerman JL, Reese TG, Cao H, Ecklund K, Glimcher MJ. Bone matrix imaged in vivo by water- and fat-suppressed proton projection MRI (WASPI) of animal and human subjects. J Magn Reson Imaging. 2010;31(4):954–963. doi: 10.1002/jmri.22130. [DOI] [PMC free article] [PubMed] [Google Scholar]
- 21.Larson PE, Conolly SM, Pauly JM, Nishimura DG. Using adiabatic inversion pulses for long-T2 suppression in ultrashort echo time (UTE) imaging. Magn Reson Med. 2007;58:952–961. doi: 10.1002/mrm.21341. [DOI] [PMC free article] [PubMed] [Google Scholar]
- 22.Du J, Carl M, Bydder M, Takahashi A, Chung CB, Bydder GM. Qualitative and quantitative ultrashort echo time (UTE) imaging of cortical bone. J Magn Reson. 2010;207(2):304–311. doi: 10.1016/j.jmr.2010.09.013. [DOI] [PubMed] [Google Scholar]
- 23.Du J, Hermida JC, Diaz E, Corbeil J, Znamirowski R, D'Lima DD, Bydder GM. Assessment of cortical bone with clinical and ultrashort echo time sequences. Magn Reson Med. 2013;70(3):697–704. doi: 10.1002/mrm.24497. [DOI] [PubMed] [Google Scholar]
- 24.Horch RA, Gochberg DF, Nyman JS, Does MD. Clinically compatible MRI strategies for discriminating bound and pore water in cortical bone. Magn Reson Med. 2012;68(6):1774–1784. doi: 10.1002/mrm.24186. [DOI] [PMC free article] [PubMed] [Google Scholar]
- 25.Manhard MK, Horch RA, Harkins KD, Gochberg DF, Nyman JS, Does MD. Validation of quantitative bound- and pore-water imaging in cortical bone. Magn Reson Med. 2013 Jul 22; doi: 10.1002/mrm.24870. [Epub ahead of print] [DOI] [PMC free article] [PubMed] [Google Scholar]
- 26.Li S, Chang EY, Bae WC, Chung CB, Hua Y, Zhou Y, Du J. The effect of excitation and preparation pulses on nonslice selective 2D UTE bicomponent analysis of bound and free water in cortical bone at 3T. Med Phys. 2014;41:022306. doi: 10.1118/1.4862838. [DOI] [PMC free article] [PubMed] [Google Scholar]
- 27.Robson MD, Gatehouse PD, Bydder M, Bydder GM. Magnetic resonance: an introduction to ultrashort TE (UTE) imaging. J Comput Assist Tomogr. 2003;27(6):825–846. doi: 10.1097/00004728-200311000-00001. [DOI] [PubMed] [Google Scholar]
- 28.Qian Y, Williams AA, Chu CR, Boada FE. Multicomponent T2* mapping of knee cartilage: technical feasibility ex vivo. Magn Reson Med. 2010;64:1426–1431. doi: 10.1002/mrm.22450. [DOI] [PMC free article] [PubMed] [Google Scholar]
- 29.Li S, Carl M, Chang E, Bae W, Chung CB, Bydder GM, Du J. Adiabatic inversion recovery prepared ultrashort echo time (IR-UTE) imaging of obund and free water in cortical bone. 21st Annual ISMRM; (21–26 April 2013); Salt Lake City, USA. p. 763. [Google Scholar]
- 30.Fantazzini P, Brown RJ, Borgia GC. Bone tissue and porous media: common features and differences studied by NMR relaxation. Magn Reson Imaging. 2003;21(3–4):227–234. doi: 10.1016/s0730-725x(03)00129-2. [DOI] [PubMed] [Google Scholar]


