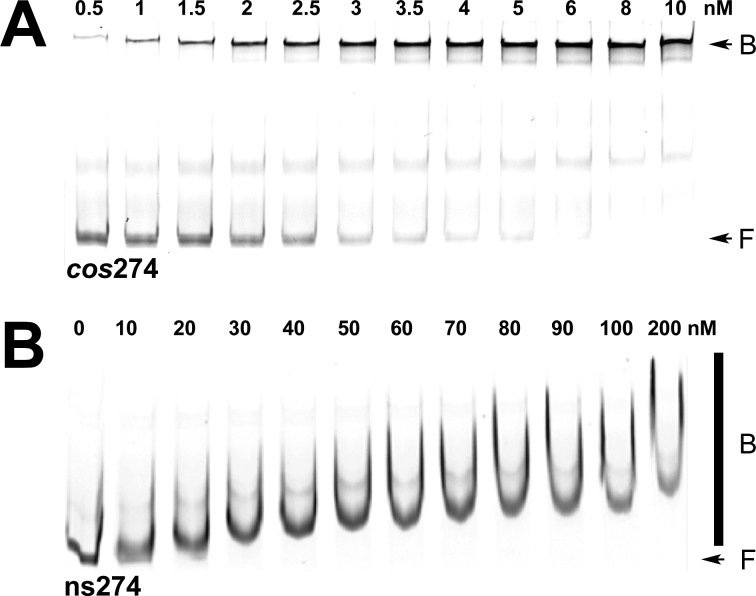
Figure 2.
Electrophoretic mobility shift (EMS) studies of binding of IHF to specific (cos274) and nonspecific (ns274) DNA substrates. (A) Representative polyacrylamide gel showing that IHF binds to the specific cos274 substrate to afford a distinct retarded complex. The positions of free (F) and bound (B) DNA complexes are indicated with arrows at the right of the gel image. The band in the middle of the gel represents a contaminant in the IRDye-labeled duplex (Supporting Information). It is unaffected in the titration study and was not considered in the calculation of Fbound. (B) Representative polyacrylamide gel showing that IHF binds to the nonspecific ns274 substrate to afford a concentration-dependent shift and smear on the gel. The positions of free (F) DNA and the bound (B) DNA complexes are indicated at the right of the gel image with an arrow and bar, respectively.

