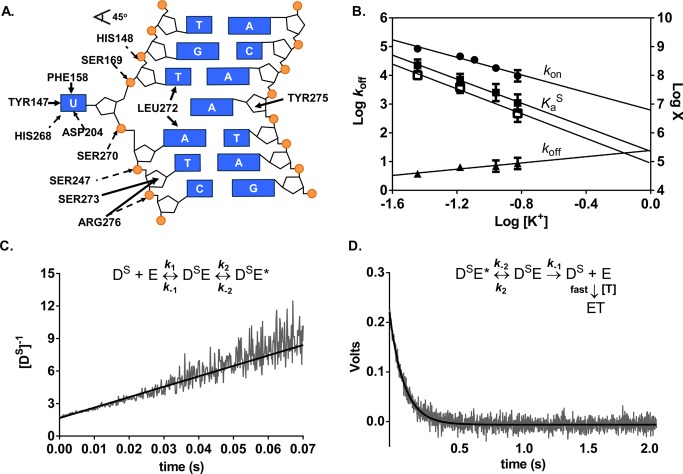
Figure 3.
Salt dependences of the association and dissociation constants and equilibrium binding affinity for specific DNA (DS) determined by stopped-flow fluorescence measurements at 20 °C. (A) Schematic of electrostatic interactions implicated in ion release (dashed arrows) and the nonelectrostatic (solid arrows) interactions between hUNG and specific DNA (Protein Data Bank entry 1EMH(45)). Insertion of the side chain of Leu272 into the DNA duplex and movement of uracil into the hUNG active site results in numerous nonelectrostatic contacts not present in the nonspecific complex. (B) Dependence on KGlu concentration of konS (circles), koffS (triangles), the calculated KaS obtained from the ratio koffS/konS (solid squares), and the measured KaS from equilibrium fluorescence titrations using KF (open squares). Log koffS is plotted on the left y-axis and the remaining parameters are plotted on the right y-axis [X = KaS (M–1) and kon (M–1 s–1)]. (C) Linearized kinetic trace of the second-order association of DS (600 nM) with hUNG (600 nM) at 150 mM K+. Equal volume solutions of DS and hUNG of equal concentration (400–600 nM) were mixed and the time dependent increase in 2-AP fluorescence was followed (λex= 310 nm). The line is the best-fit to a second-order rate equation. (D) Kinetic trace of the dissociation of hUNG from DS at 150 mM K+. Abasic site-containing DNA (aDNA, 5 μM) was mixed with an equal volume solution containing 0.8 μM hUNG and 0.2 μM DS and the time dependent decrease in 2-AP fluorescence was followed (λex = 310 nm). The line is the best-fit to a single exponential decay. Controls established that the observed rate was zero-order with respect to DNA trap.

