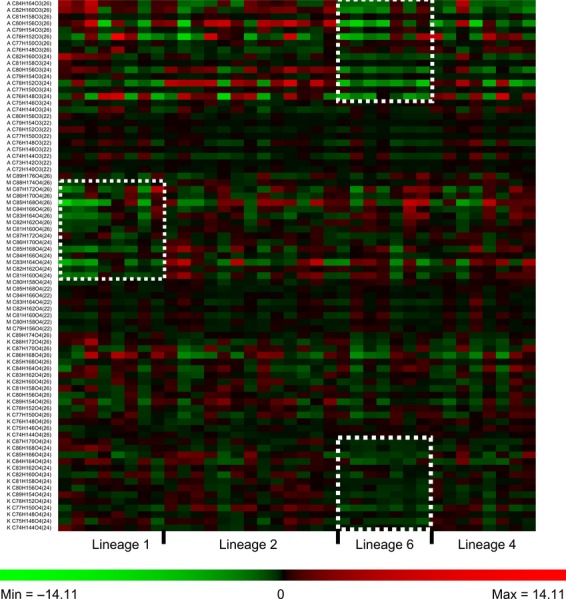
Figure 3.

Mean row centered heat-map repre-sentation of median normalized intensities of individual mycolic acid molecular species across 36 strains and four lineages of Mycobacterium tuberculosis complex. Appearing trends that were visually evident are highlighted with dashed squares (Raw data provided as Table S1).
