

A computer-aided diagnosis (CAD) system based on quantitative morphologic, texture, and textural kinetic features at dynamic contrast-enhanced MR imaging was developed to determine the feasibility of distinguishing triple-negative cancers from different molecular subtypes of cancer (eg, estrogen receptor positive and human epidermal growth factor receptor 2 positive) and fibroadenomas; such a CAD system has the potential to provide insight into the underlying tumor biology along with providing information about how a patient’s cancer may respond to targeted therapies.
Abstract
Purpose
To determine the feasibility of using a computer-aided diagnosis (CAD) system to differentiate among triple-negative breast cancer, estrogen receptor (ER)–positive cancer, human epidermal growth factor receptor type 2 (HER2)–positive cancer, and benign fibroadenoma lesions on dynamic contrast material–enhanced (DCE) magnetic resonance (MR) images.
Materials and Methods
This is a retrospective study of prospectively acquired breast MR imaging data collected from an institutional review board–approved, HIPAA-compliant study between 2002 and 2007. Written informed consent was obtained from all patients. The authors collected DCE MR images from 65 women with 76 breast lesions who had been recruited into a larger study of breast MR imaging. The women had triple-negative (n = 21), ER-positive (n = 25), HER2-positive (n = 18), or fibroadenoma (n = 12) lesions. All lesions were classified as Breast Imaging Reporting and Data System category 4 or higher on the basis of previous imaging. Images were subject to quantitative feature extraction, feed-forward feature selection by means of linear discriminant analysis, and lesion classification by using a support vector machine classifier. The area under the receiver operating characteristic curve (Az) was calculated for each of five lesion classification tasks involving triple-negative breast cancers.
Results
For each pair-wise lesion type comparison, linear discriminant analysis helped identify the most discriminatory features, which in conjunction with a support vector machine classifier yielded an Az of 0.73 (95% confidence interval [CI]: 0.59, 0.87) for triple-negative cancer versus all non–triple-negative lesions, 0.74 (95% CI: 0.60, 0.88) for triple-negative cancer versus ER- and HER2-positive cancer, 0.77 (95% CI: 0.63, 0.91) for triple-negative versus ER-positive cancer, 0.74 (95% CI: 0.58, 0.89) for triple-negative versus HER2-positive cancer, and 0.97 (95% CI: 0.91, 1.00) for triple-negative cancer versus fibroadenoma.
Conclusion
Triple-negative cancers possess certain characteristic features on DCE MR images that can be captured and quantified with CAD, enabling good discrimination of triple-negative cancers from non–triple-negative cancers, as well as between triple-negative cancers and benign fibroadenomas. Such CAD algorithms may provide added diagnostic benefit in identifying the highly aggressive triple-negative cancer phenotype with DCE MR imaging in high-risk women.
© RSNA, 2014
Introduction
Triple-negative breast cancer has recently been identified as an important subtype owing to its prevalence in the population (10%–20% of all diagnosed breast cancer [1]), lack of options for targeted molecular therapies (2), and poor prognosis (3). Dynamic contrast material–enhanced (DCE) magnetic resonance (MR) imaging is sensitive for detecting triple-negative cancer (4,5) and screening BRCA mutation carriers (4,6–9), who often develop triple-negative cancer (1)—particularly BRCA1 mutation carriers.
Studies comparing phenotypic differences between triple-negative and non–triple-negative cancer on DCE MR images show that many triple-negative cancers have smooth margins, whereas the more common estrogen receptor (ER)–positive cancers have irregular borders (10,11). Triple-negative cancers also show rim enhancement at postcontrast T1-weighted imaging and central high signal intensity at T2-weighted imaging (10,12–14). Interestingly, the characteristic features of triple-negative cancers, as identified by Uematsu et al (10) and Wang et al (14), do not conform to the attributes commonly ascribed to malignancies in the Breast Imaging Reporting and Data System MR imaging lexicon (15). In fact, Uematsu et al (10) reported that triple-negative lesions may have morphologic and kinetic features at DCE MR imaging that are similar to those of benign fibroadenomas. Recognition of triple-negative lesion characteristics in comparison with those of other breast cancer subtypes at MR imaging may reduce the chances that the triple-negative lesion is interpreted as having a benign appearance.
Computer-aided diagnosis (CAD) methods, which provide diagnostic information on the basis of quantitative descriptors of the lesion under inspection, have been proposed to reduce interrater variability (16,17) and to increase diagnostic specificity (18–22) at DCE MR imaging. Breast CAD solutions have started to move beyond solely differentiating benign from malignant lesions (16,23–27) to addressing more complex diagnostic questions. For instance, Bhooshan et al (25) proposed the use of textural, morphologic, and kinetic descriptors for differentiating ductal carcinoma in situ from invasive ductal carcinoma. Makkat et al (22) similarly proposed the use of imaging descriptors such as the quantification of tumor blood flow for differentiating between human epidermal growth factor receptor type 2 (HER2)–positive and HER2-negative tumors.
Textural kinetics are quantitative imaging features that describe the dynamic variation of textural features of breast lesions during contrast material uptake and can outperform standard morphologic, static texture, and kinetic intensity features in the differentiation of benign from malignant lesions (28). Textural kinetics features are calculated by computing a series of texture features at each time point in the DCE MR imaging series. For each static texture feature, a statistic such as the mean or median feature value over all pixels within the lesion at each time point is calculated and then plotted as a function of time. The shape of this curve, akin to the shape of the signal intensity kinetic curves first described by Kuhl et al (29) and Kinkel et al (30), provides a description of textural variations as a function of contrast material uptake within the lesion.
We performed this study to determine the feasibility of using a CAD system to differentiate among triple-negative breast cancer, ER–positive cancer, HER2-positive cancer, and benign fibroadenoma lesions at DCE MR imaging.
Materials and Methods
Breast MR imaging data were prospectively collected in an institutional review board–approved, Health Insurance Portability and Accountability Act–compliant study at the Hospital at the University of Pennsylvania between 2002 and 2007. Written informed consent was obtained. Women without contraindications to MR imaging or gadolinium who presented with either a suspicious breast lesion or known malignancy (Breast Imaging Reporting and Data System category 4 or higher) before surgery were recruited to a larger single-institution study of MR imaging in the staging, diagnosis, and screening of breast cancer. Women who underwent neoadjuvant chemotherapy before surgery were excluded, as were women who had undergone excisional biopsy before entry. From this data set we selected women whose pathologic examination revealed invasive cancer. Subjects whose images of the index lesion demonstrated substantial metallic artifact from previous biopsy were also excluded. A total of 585 women were recruited for the study. Of those, 110 had invasive ductal carcinoma and associated histopathologic examination with immunohistochemistry to confirm hormone receptor status. The original goal was to obtain 25 each of fibroadenoma, triple-negative, HER2-positive, and ER-positive lesions. In the entire data set, there were 21 triple-negative lesions, 18 unequivocal HER2-positive lesions, and 12 fibroadenoma lesions. We were able to obtain 25 ER-positive tumors, which were selected at random from the total data set. Data from 30 of the patients used in the current study were previously reported in articles looking at different classification tasks than in the current study (28,31). Data from 45 of the patients used in the current study were previously reported in an article describing and evaluating an automated tumor boundary segmentation method (32). In this study, we examined MR imaging characteristics in 76 solid lesions from 65 patients for whom pathology results and, where applicable, ER, progesterone receptor, and HER2 results were available. Reference standard diagnosis was made with histopathologic examination of tissue obtained by using either core biopsy sampling or lumpectomy. Of the 76 lesions, 12 were benign fibroadenomas and 64 were invasive carcinomas. All of the carcinomas were immunohistochemically stained for hormone receptors and ERBB2 (formerly HER2/neu). In cases in which staining for ERBB2 was inconclusive, amplification was confirmed with fluorescence in situ hybridization. Of the 64 carcinomas, 21 were triple-negative (ER-negative/progesterone receptor–negative/HER2-negative) cancer, 18 were HER2-positive (14 ER-negative/HER2-positive, four ER-positive/HER2-positive) cancer, and 25 were ER-positive (ER-positive/HER2-negative) cancer. There were nine progesterone receptor–positive lesions in the HER2-positive group and 20 progesterone receptor–positive lesions in the ER-positive group. One patient had four separate HER2-positive lesions, and one patient had two separate HER2-positive lesions; all other HER2-positive lesions came from individual patients. Two patients had two separate triple-negative lesions; all other triple-negative lesions came from individual patients. One patient had two separate ER-positive lesions, and one patient had three separate ER-positive lesions; all other ER-positive lesions came from individual patients. Clinical features are listed in Table 1.
Table 1.
Clinicopathologic Characteristics of Patient Studies
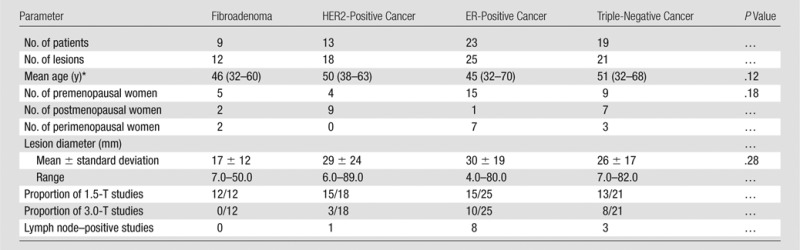
Numbers in parentheses are the range.
MR images were obtained at either 1.5 or 3.0 T (Sonata or Trio, respectively; Siemens, Malvern, Pa). Sagittal imaging included fat-saturated three-dimensional T1-weighted DCE imaging before and after injection of 20 mL of gadodiamide (Omniscan; GE Healthcare, Cork, Ireland). Imaging parameters for DCE MR imaging varied over time and magnet type (matrix size, 256 × 256–896 × 896; in-plane resolution, 0.20–0.70 mm per pixel; section thickness, 2–5 mm; 7–26/1.8–6.5 [repetition time msec/echo time msec]; flip angle, 25°–30°). DCE MR imaging data sets were acquired once before contrast material injection and at 90-second intervals upon injection of a bolus of contrast material, for a total imaging duration of 5–8 minutes.
Lesion Segmentation and Feature Extraction
A representative section, which was a central section of the DCE MR imaging volume, was chosen by a radiologist who was blinded to the pathologic diagnosis (M.A.R., with 12 years of experience in the interpretation of breast MR images). The lesion boundary was manually delineated (M.A.R.) on the basis of the early postcontrast image that demonstrated the greatest lesion conspicuity from neighboring tissues. Morphologic features (ie, shape features, margins) were calculated on the basis of this boundary (28). All other features (eg, static textural, intensity kinetics, and textural kinetics) were computed on the basis of the pixels enclosed by the lesion segmentation. All image intensities were first rescaled into a common dynamic intensity range (0–255) before feature calculation. Table 2 describes the computer-extracted features. All feature calculation was performed by using software previously developed in the Laboratory for Computational Imaging and Bioinformatics, Rutgers University, and was implemented by using a Matlab R 2010b platform (Mathworks, Natick, Mass). Lesion diameter was measured (Table 3).
Table 2.
Description of All Features Used to Differentiate Triple-Negative Cancer from HER2-Positive and ER-Positive Cancer and Fibroadenoma
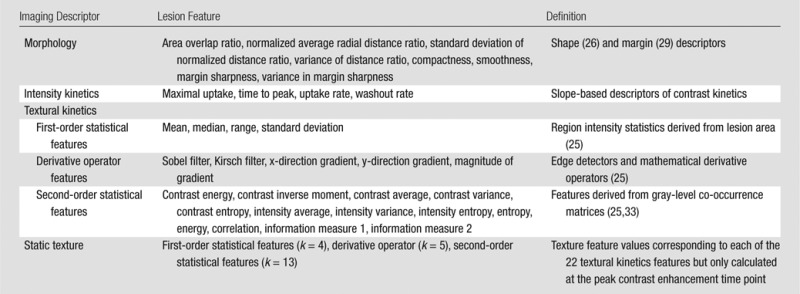
Table 3.
Az and Key Feature Set for Support Vector Machine Classification of Triple-Negative Cancers versus Other Lesion Classes
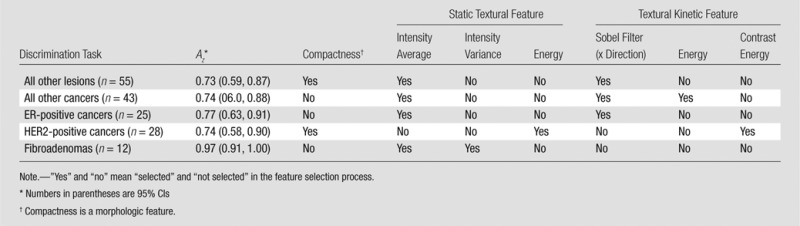
Note.—”Yes” and “no” mean “selected” and “not selected” in the feature selection process.
Numbers in parentheses are 95% CIs
Compactness is a morphologic feature.
Morphologic features.—Six morphologic features (31,34) related to the boundary between the lesion and the surrounding tissue were determined: (a) area overlap ratio, (b) normalized average radial distance ratio, (c) standard deviation of normalized distance ratio, (d) variance of distance ratio, (f) compactness, and (g) smoothness. These morphologic features were used to analyze the roundness, spiculation, regularity, and smoothness of the lesion boundary along with lesion shape. In addition, two morphologic features used previously for breast lesion analysis at DCE MR imaging (margin sharpness and variance in margin sharpness [25,33]) were also extracted.
Intensity kinetics.—A total of four intensity kinetic features (25,33–35) were calculated on the basis of the signal intensity–time curve (29): maximal uptake, time to peak, uptake rate, and washout rate.
Static texture.—Static texture features were computed from the peak enhancing image for each lesion as was done in previous studies (25,28,36). A set of 22 textural features was calculated for each lesion, reflecting heterogeneity of tissue types in a lesion on the basis of first-order statistics (28), derivative operations, and gray-level co-occurrence matrices (37).
Textural kinetics.—The average value of each of the 22 texture features described in the static texture section was plotted as a function of time. A third-order polynomial was then fit in a least-squares sense to the resulting curve, yielding a vector of four coefficients per kinetic textural feature (28). These four coefficients represent the corresponding textural kinetic behavior for each static texture feature (see Appendix E1 [online] for an example). Authors S.C.A., A.M., and M.A.R. share a patent for the technique used to calculate textural kinetics features.
Support Vector Machine Classifier
To determine quantitative imaging features at DCE MR imaging that best discriminated triple-negative cancer from other molecular subtypes of cancer and from benign fibroadenomas, feature selection was performed in a feed-forward manner by using linear discriminant analysis (38,39). The important features identified during the linear discriminant analysis feature selection process were combined with equal weighting and used in conjunction with a support vector machine classifier (40).
The support vector machine classifier assigned a likelihood value to each lesion of belonging to a specific class by exploiting the distance of each lesion to the support vector machine decision hyperplane (40), defined as a multidimensional decision boundary used to discriminate between lesion classes: The greater the distance of a lesion from the hyperplane, the higher the likelihood that the lesion belongs to a particular class. As the distance of the objects from the decision hyperplane changes, the corresponding object-class probabilities also change. By varying the position of the decision hyperplane, classification sensitivity and specificity estimates at each location are obtained, which in turn allows for the calculation of a receiver operating characteristic curve for the classifier. The support vector machine classifier mechanism employs a “leave-one-out” strategy, and the area under the receiver operating characteristic curve (Az) (28) for each of the five classification tasks (triple-negative lesions vs all other lesions, triple-negative cancer vs non–triple-negative cancer, triple-negative cancer vs ER-positive cancer, triple-negative cancer vs HER2-positive cancer, and triple-negative cancer vs fibroadenoma) was evaluated. A flowchart demonstrating the use of feature combinations for lesion class discrimination is shown in Appendix E1 (online).
Statistical Analysis
Clinical features were compared among the lesion subtypes by using analysis of variance with Bonferroni-adjusted multiple comparison (P < .05) (Table 1). To confirm that our classifiers and features were insensitive to the magnetic strength of the imaging unit and did not discriminate between 1.5- and 3.0-T images of lesions, we tested the linear discriminant analysis selected with a paired t test (P < .05) to test the null hypothesis that there were no differences in feature values between magnet strengths. The two tests performed were for triple-negative versus ER-positive cancer and triple-negative versus HER2-positive classification tasks. A posthoc power analysis for each of these t tests (P < .05) was performed. The triple-negative cancer versus fibroadenoma classification task was not examined in this manner because all fibroadenoma cases were imaged at 1.5 T. All statistical analyses were implemented with software (Matlab R 2010b; Mathworks, Natick, Mass). All reported confidence intervals (CIs) are over 95% CIs.
Results
Linear Discriminant Analysis for Feature Selection
The most accurate combinations of features as determined with the linear discriminant analysis classifier for differentiating triple-negative lesions from fibroadenomas, ER-positive lesions, and HER2-positive lesions are shown in Appendix E1 (online).
Triple-negative cancer versus all non–triple-negative lesions.—For triple-negative cancer versus all non–triple negative lesions, the morphologic feature compactness and the textural features static intensity average and kinetic x-direction (anteroposterior) Sobel filter yielded the best discriminability in the feature selection process. Overall, triple-negative lesions had lower values of the gray-level co-occurrence matrix feature intensity average, which is indicative of more lesion heterogeneity at peak contrast relative to that of non–triple-negative lesions. Conversely, the kinetic x-direction Sobel filter feature set indicated that the triple-negative lesions steadily increased in homogeneity over time, whereas non–triple-negative lesions varied more across time. In addition, triple-negative lesions were more compact than non–triple-negative lesions.
Triple-negative cancer versus non–triple-negative cancer.—For the triple-negative versus non–triple-negative cancer task, the static texture feature intensity average, the kinetic texture feature x-direction Sobel filter, and the gray-level co-occurrence matrix feature energy were identified as the most important features. Non–triple-negative cancers had higher values of the gray-level co-occurrence matrix feature intensity average texture. The textural kinetic feature x-direction Sobel filter had a set of coefficient values that reflected greater heterogeneity in contrast material uptake from time point to time point across the non–triple-negative cancers than in the triple-negative cancers.
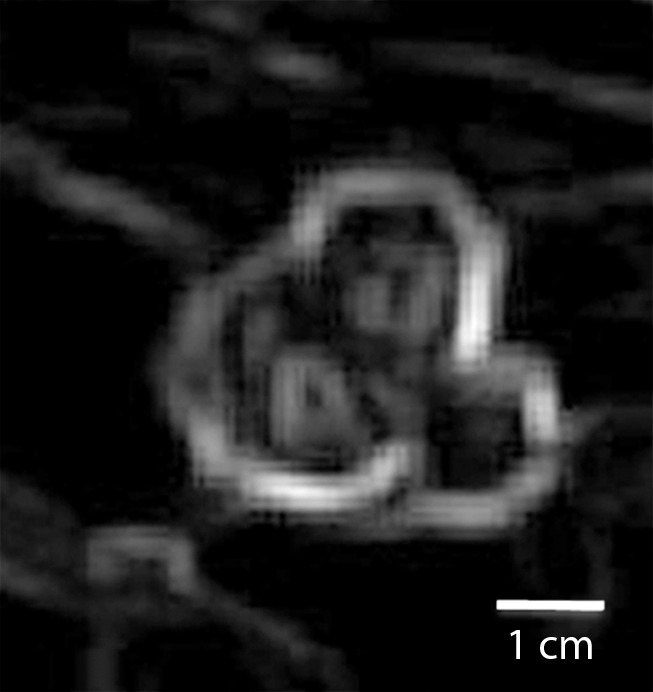
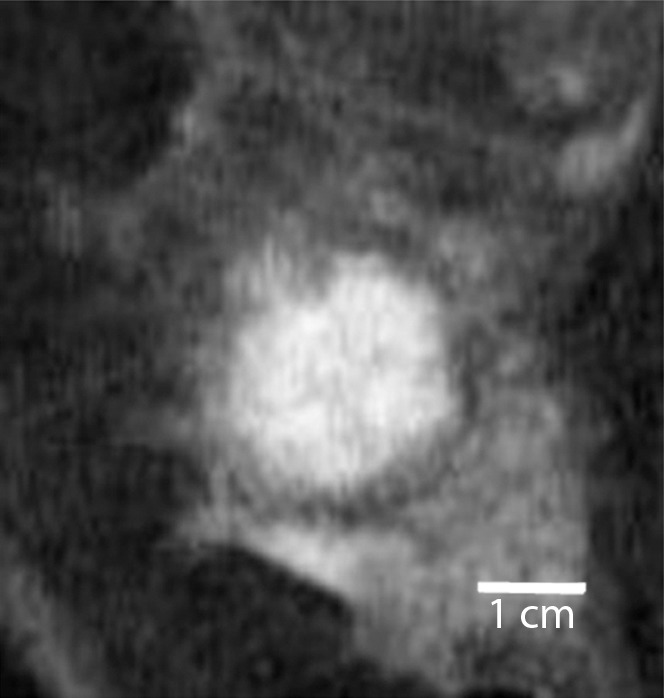
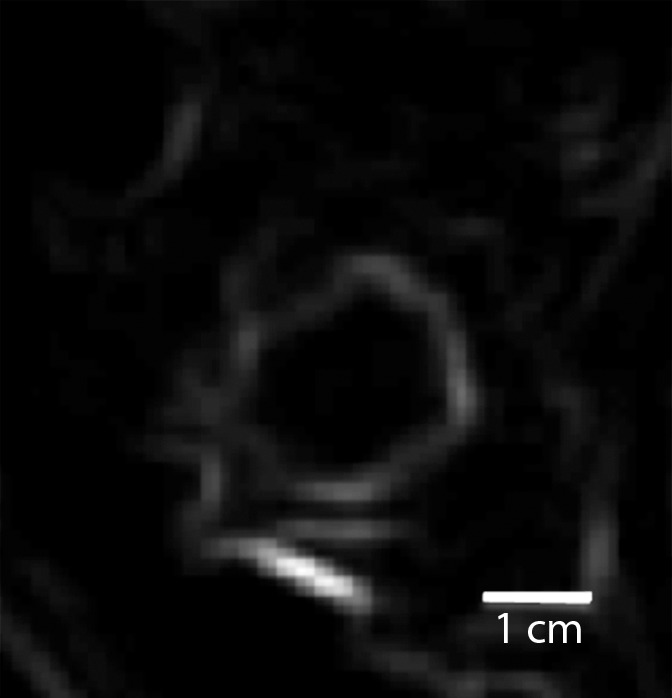
Triple-negative cancer versus fibroadenoma.—For the triple-negative cancer versus fibroadenoma classification task, the static texture features intensity average and intensity variance appeared to have greatest relevance. Compared with triple-negative cancers, fibroadenomas had higher localized texture values for both intensity average and intensity variance, which indicates that triple-negative lesions were far more heterogeneous at peak contrast than were fibroadenomas (Fig 1).
Figure 1a:
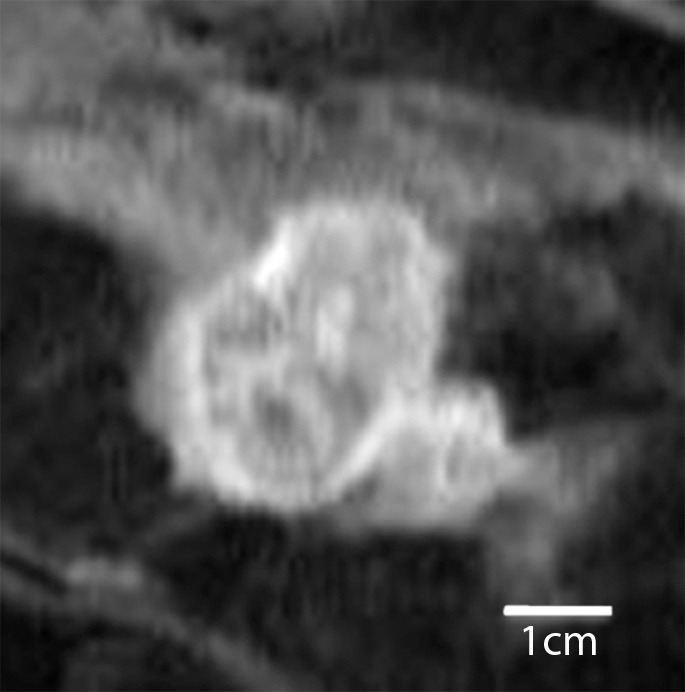
Comparison of enhanced appearance and textural features of triple-negative cancer and fibroadenoma. (a) Contrast-enhanced MR image (26/6.5, 30° flip angle, 1.5 T) and (b) static intensity variance feature map at peak enhancement in 44-year-old woman with triple-negative cancer. (c) Contrast-enhanced MR image (26/6.42; flip angle, 30°; 1.5 T) and (d) static intensity variance feature map at peak enhancement in 51-year-old woman with fibroadenoma.
Figure 1b:
Comparison of enhanced appearance and textural features of triple-negative cancer and fibroadenoma. (a) Contrast-enhanced MR image (26/6.5, 30° flip angle, 1.5 T) and (b) static intensity variance feature map at peak enhancement in 44-year-old woman with triple-negative cancer. (c) Contrast-enhanced MR image (26/6.42; flip angle, 30°; 1.5 T) and (d) static intensity variance feature map at peak enhancement in 51-year-old woman with fibroadenoma.
Figure 1c:
Comparison of enhanced appearance and textural features of triple-negative cancer and fibroadenoma. (a) Contrast-enhanced MR image (26/6.5, 30° flip angle, 1.5 T) and (b) static intensity variance feature map at peak enhancement in 44-year-old woman with triple-negative cancer. (c) Contrast-enhanced MR image (26/6.42; flip angle, 30°; 1.5 T) and (d) static intensity variance feature map at peak enhancement in 51-year-old woman with fibroadenoma.
Figure 1d:
Comparison of enhanced appearance and textural features of triple-negative cancer and fibroadenoma. (a) Contrast-enhanced MR image (26/6.5, 30° flip angle, 1.5 T) and (b) static intensity variance feature map at peak enhancement in 44-year-old woman with triple-negative cancer. (c) Contrast-enhanced MR image (26/6.42; flip angle, 30°; 1.5 T) and (d) static intensity variance feature map at peak enhancement in 51-year-old woman with fibroadenoma.
Triple-negative versus ER-positive cancers.—For the task of differentiating triple-negative cancers from ER-positive cancers, the static gray-level co-occurrence matrix texture feature intensity average and the textural kinetics feature x-direction Sobel filter were important descriptors (Fig 2; see Appendix E1 [online] for associated figures). The coefficient values for the kinetic feature x-direction Sobel filter indicate that the degree of homogeneity varies more as a function of contrast material uptake in ER-positive cancers than in the case of triple-negative cancers. No statistical significance was found between 1.5- and 3.0-T features for the triple-negative versus ER-positive cancer classification task. However, posthoc power analysis revealed a power of 0.01–0.30, indicating that although no difference was detected between feature values at the two magnet strengths, our sample sizes could not evaluate this question completely.
Figure 2a:

Comparison of dynamic enhanced appearance and textural discrimination between triple-negative cancer (TN) in 52-year-old woman and ER-positive cancer in 55-year-old woman. (a) Normalized signal intensity–time curves and (b) normalized mean x-direction Sobel filter map. Note that the two curve shapes are more distinct in the textural kinetic plot. Images associated with this plot can be found in Appendix E1 (online).
Figure 2b:

Comparison of dynamic enhanced appearance and textural discrimination between triple-negative cancer (TN) in 52-year-old woman and ER-positive cancer in 55-year-old woman. (a) Normalized signal intensity–time curves and (b) normalized mean x-direction Sobel filter map. Note that the two curve shapes are more distinct in the textural kinetic plot. Images associated with this plot can be found in Appendix E1 (online).
Triple-negative versus HER2-positive cancers.—In the differentiation of triple-negative cancers from HER2-positive cancers, a combination of the morphologic feature compactness, the static texture feature energy, and the textural kinetics feature contrast energy was most relevant. The higher value of compactness for the triple-negative cancers compared with the HER2-positive cancers suggests that triple-negative cancers have smoother borders than HER2-positive cancers. HER2-positive cancers are more heterogeneous at peak contrast material uptake, as demonstrated by the energy values, but the heterogeneity of contrast material uptake in triple-negative cancers varies more as a function of time than the heterogeneity of contrast material uptake in HER2-positive cancers, as reflected by the textural kinetics feature contrast energy (Fig 3). No significant difference was found between 1.5- and 3.0-T features for the triple-negative versus HER2-positive cancer classification task. Posthoc power analysis revealed a study power of 0.14–0.18 for the features compared; therefore, such a comparison would benefit from a larger data set.
Figure 3:

Comparison of dynamic enhanced appearance and textural kinetic discrimination between triple-negative cancer (TN) in 38-year-old woman and HER2-positive cancer in 61-year-old woman. Graphs show (a) normalized mean lesion contrast energy and (b) normalized mean lesion image intensity versus normalized time. Note that the time course of relative signal intensities is similar, whereas the time course of relative contrast energy varies widely between the two tumors.
Figure 3b:

Comparison of dynamic enhanced appearance and textural kinetic discrimination between triple-negative cancer (TN) in 38-year-old woman and HER2-positive cancer in 61-year-old woman. Graphs show (a) normalized mean lesion contrast energy and (b) normalized mean lesion image intensity versus normalized time. Note that the time course of relative signal intensities is similar, whereas the time course of relative contrast energy varies widely between the two tumors.
Performance of the Feature Set in the Differentiation of Lesion Classes
Among the classification tasks, we were best able to differentiate between triple-negative cancers and fibroadenoma with an Az of 0.97 (95% CI: 0.91, 1.00). None of the three fibroadenomas smaller than 10 mm in diameter were misclassified in this experiment, and two of three triple-negative lesions 10 mm or less in diameter were misclassified. However, the selected features were also able to help differentiate triple-negative cancers from ER-positive cancers (triple-negative vs ER-positive cancers: Az = 0.77 [95% CI: 0.63, 0.91]; two of the three triple-negative cancers ≤10 mm and one of the four ER-positive lesions ≤10 mm were misclassified) and HER2-positive cancers (triple-negative vs HER2-positive cancers: Az = 0.74 [95% CI: 0.58, 0.89]; one of three triple-negative cancers ≤10 mm and two of five HER2-positive lesions ≤10 mm were misclassified). Overall, we were able to differentiate triple-negative from non–triple-negative cancers with an Az of 0.74 (95% CI: 0.60, 0.87) (Table 3).
Discussion
CAD systems, like the one presented herein, have the potential to provide insight into the underlying tumor biology along with providing information about how a patient’s cancer may respond to targeted therapies (41). Although differences in lesion appearance on DCE MR images have been previously suggested in qualitative comparisons of molecular subtypes of cancer (10,13,22), in this study we quantified imaging differences between triple-negative and ER-positive cancers and triple-negative and HER2-positive cancers by means of computerized image analysis. Furthermore, this is a systematic comparison of triple-negative cancer and fibroadenoma, a common benign lesion with morphologic appearance and intensity kinetics features that resemble those of triple-negative cancer, confounding an accurate diagnosis at DCE MR imaging (4,10).
The particular lesion classification tasks were chosen on the basis of differentiating triple-negative cancers from fibroadenomas and for relevance to individualized therapy (eg, triple-negative cancer compared with HER2-positive or ER-positive cancer). As expected, there was substantial overlap in the morphologic features of triple-negative cancer and fibroadenoma. Thus, morphologic features were not useful for differentiating between these lesions. Instead, static texture features were found to differ substantially between these two lesion classes. This result echoes the findings of Schrading and Kuhl (4), who showed that radiologist-determined morphologic features did not contribute to the discernment between fibroadenomas and triple-negative cancers at DCE MR imaging. Conversely, lesion morphology was useful for differentiating triple-negative cancers from HER2-positive cancer classes. This is also consistent with the findings of Wang et al (14), who showed that triple-negative cancers have smooth circumscribed borders, whereas HER2-positive cancers are spiculated.
Although other CAD analyses use both static textural features of lesions and the functional dynamic assessment of lesion enhancement patterns, we used textural kinetic features for lesion classification. In all classification tasks—except for the differentiation of triple-negative cancers from fibroadenomas—textural kinetics features were identified as important discriminatory attributes, whereas more routine methods of analyzing dynamic enhancement patterns of lesions were not. It is possible that textural kinetics, which measure spatiotemporal changes in breast lesion appearance during contrast material uptake, capture unique aspects of the biologic heterogeneity of breast cancers. As MR imaging techniques evolve to allow for greater degrees of image acceleration without sacrificing image resolution, it is expected that textural kinetic analyses will provide an even richer source of data to explore the biologic heterogeneity of breast lesions.
Our study had limitations, and, as such, we emphasize that this is a feasibility study. The first limitation of the study is the small sample size. Second, lesion size should be explored as a possible limitation. Third, this histologic classification was limited to invasive cancer. Fourth, there was a mix of two magnet strengths used. Fifth, manual segmentation was used for feature extraction for all but peak enhancement, where automated extraction was used. Sixth, feed-forward feature selection is a locally optimal method. The number of features was large compared with the number of datasets. Finally, the classifier could have been biased by having multiple lesions from the same patient.
In conclusion, in our feasibility study, we have identified morphologic as well as both static and kinetic textural imaging phenotypes by means of DCE MR imaging that may be able to segregate breast cancer subtypes, and the development of such a CAD system is indeed feasible. Future work will address the use of a larger independent dataset for testing to mitigate power and bias, as well as the use of a multidiscriminant classifier.
Advances in Knowledge
■ Textural kinetics enabled high-yield discrimination between triple-negative breast cancer lesions (n = 21) and fibroadenomas (n = 12) that were suspicious for malignancy (area under the receiver operating characteristic curve [Az]: 0.97; 95% confidence interval [CI]: 0.91, 1.00).
■ Triple-negative breast cancers can be differentiated from estrogen receptor–positive breast cancers (n = 25) by using a combination of quantitative features and a computer-aided diagnosis (CAD) system (Az: 0.77; 95% CI: 0.63, 0.91).
■ Triple-negative breast cancers can be differentiated from human epidermal growth factor receptor 2–positive breast cancers (n = 18) by using a combination of quantitative features and a CAD system (Az: 0.74; 95% CI: 0.58, 0.89).
Implication for Patient Care
■ A dynamic contrast material–enhanced MR imaging signature for triple-negative breast cancer may become a useful biomarker of tumor response as vascular and other molecularly targeted therapies are introduced in the neoadjuvant setting.
APPENDIX
SUPPLEMENTAL TABLES
SUPPLEMENTAL FIGURES
Received May 22, 2012; revision requested July 24; revision received July 24, 2013; accepted August 20; final version accepted December 27.
Funding: Supported by National Institutes of Health grants R01CA136535-01, R01CA140772-01, and R03CA143991-01 to A.M. and grant P01CA85424 to M.D.S.
Disclosures of Conflicts of Interest: S.C.A. Financial activities related to the present article: none to disclose. Financial activities not related to the present article: has a patent pending; receives royalties from Vascuvis. Other relationships: none to disclose. M.A.R. No relevant conflicts of interest to disclose. S.E. No relevant conflicts of interest to disclose. J.E.T. Financial activities related to the present article: none to disclose. Financial activities not related to the present article: is on the scientific advisory board of IbRis; has patents issued and pending. Other relationships: none to disclose. M.D.F. No relevant conflicts of interest to disclose. P.Z. No relevant conflicts of interest to disclose. C.M. No relevant conflicts of interest to disclose. M.D.S. Financial activities related to the present article: none to disclose. Financial activities not related to the present article: institution received a grant from Siemens. Other relationships: none to disclose. A.M. Financial activities related to the present article: none to disclose. Financial activities not related to the present article: is co-founder and major stakeholder in IbRis; is majority stakeholder in vascuVis. Other relationships: none to disclose.
Abbreviations:
- Az
- area under the receiver operating characteristic curve
- CAD
- computer-aided diagnosis
- CI
- confidence interval
- DCE
- dynamic contrast material enhanced
- ER
- estrogen receptor
- HER2
- human epidermal growth factor receptor type 2
References
- 1.Reis-Filho JS, Tutt ANJ. Triple negative tumours: a critical review. Histopathology 2008;52(1):108–118. [DOI] [PubMed] [Google Scholar]
- 2.Stockmans G, Deraedt K, Wildiers H, Moerman P, Paridaens R. Triple-negative breast cancer. Curr Opin Oncol 2008;20(6):614–620. [DOI] [PubMed] [Google Scholar]
- 3.Haffty BG, Yang Q, Reiss M, et al. Locoregional relapse and distant metastasis in conservatively managed triple negative early-stage breast cancer. J Clin Oncol 2006;24(36):5652–5657. [DOI] [PubMed] [Google Scholar]
- 4.Schrading S, Kuhl CK. Mammographic, US, and MR imaging phenotypes of familial breast cancer. Radiology 2008;246(1):58–70. [DOI] [PubMed] [Google Scholar]
- 5.Tchou J, Wang LP, Sargen M, Sonnad S, Tomaszewski J, Schnall M. Do triple-negative breast cancers have a distinct imaging phenotype? Presented at the 29th Annual San Antonio Breast Cancer Symposium, San Antonio, Tex, December 14–17, 2006. [Google Scholar]
- 6.Lehman CD, Gatsonis C, Kuhl CK, et al. MRI evaluation of the contralateral breast in women with recently diagnosed breast cancer. N Engl J Med 2007;356(13):1295–1303. [DOI] [PubMed] [Google Scholar]
- 7.Veltman J, Mann R, Kok T, et al. Breast tumor characteristics of BRCA1 and BRCA2 gene mutation carriers on MRI. Eur Radiol 2008;18(5):931–938. [DOI] [PMC free article] [PubMed] [Google Scholar]
- 8.Shah P, Rosen M, Stopfer J, et al. Prospective study of breast MRI in BRCA1 and BRCA2 mutation carriers: effect of mutation status on cancer incidence. Breast Cancer Res Treat 2009;118(3):539–546. [DOI] [PMC free article] [PubMed] [Google Scholar]
- 9.Saslow D, Boetes C, Burke W, et al. American Cancer Society guidelines for breast screening with MRI as an adjunct to mammography. CA Cancer J Clin 2007;57(2):75–89. [DOI] [PubMed] [Google Scholar]
- 10.Uematsu T, Kasami M, Yuen S. Triple-negative breast cancer: correlation between MR imaging and pathologic findings. Radiology 2009;250(3):638–647. [DOI] [PubMed] [Google Scholar]
- 11.Youk JH, Son EJ, Chung J, Kim JA, Kim EK. Triple-negative invasive breast cancer on dynamic contrast-enhanced and diffusion-weighted MR imaging: comparison with other breast cancer subtypes. Eur Radiol 2012;22(8):1724–1734. [DOI] [PubMed] [Google Scholar]
- 12.Dogan BE, Gonzalez-Angulo AM, Gilcrease M, Dryden MJ, Yang WT. Multimodality imaging of triple receptor–negative tumors with mammography, ultrasound, and MRI. AJR Am J Roentgenol 2010;194(4):1160–1166. [DOI] [PubMed] [Google Scholar]
- 13.Chen J-H, Agrawal G, Feig B, et al. Triple-negative breast cancer: MRI features in 29 patients. Ann Oncol 2007;18(12):2042–2043. [DOI] [PubMed] [Google Scholar]
- 14.Wang Y, Ikeda DM, Narasimhan B, et al. Estrogen receptor–negative invasive breast cancer: imaging features of tumors with and without human epidermal growth factor receptor type 2 overexpression. Radiology 2008;246(2):367–375. [DOI] [PubMed] [Google Scholar]
- 15.American College of Radiology . American College of Radiology (ACR) Breast Imaging Reporting and Data System Atlas (BIRADS Atlas). Reston, Va: American College of Radiology, 2003. [Google Scholar]
- 16.Meinel LA, Stolpen AH, Berbaum KS, Fajardo LL, Reinhardt JM. Breast MRI lesion classification: improved performance of human readers with a backpropagation neural network computer-aided diagnosis (CAD) system. J Magn Reson Imaging 2007;25(1):89–95. [DOI] [PubMed] [Google Scholar]
- 17.Deurloo EE, Muller SH, Peterse JL, Besnard AP, Gilhuijs KG. Clinically and mammographically occult breast lesions on MR images: potential effect of computerized assessment on clinical reading. Radiology 2005;234(3):693–701. [DOI] [PubMed] [Google Scholar]
- 18.Meeuwis C, van de Ven SM, Stapper G, et al. Computer-aided detection (CAD) for breast MRI: evaluation of efficacy at 3.0 T. Eur Radiol 2010;20(3):522–528. [DOI] [PMC free article] [PubMed] [Google Scholar]
- 19.Arazi-Kleinman T, Causer PA, Jong RA, Hill K, Warner E. Can breast MRI computer-aided detection (CAD) improve radiologist accuracy for lesions detected at MRI screening and recommended for biopsy in a high-risk population? Clin Radiol 2009;64(12):1166–1174. [DOI] [PubMed] [Google Scholar]
- 20.Williams TC, DeMartini WB, Partridge SC, Peacock S, Lehman CD. Breast MR imaging: computer-aided evaluation program for discriminating benign from malignant lesions. Radiology 2007;244(1):94–103. [DOI] [PubMed] [Google Scholar]
- 21.Lehman CD, Peacock S, DeMartini WB, Chen X. A new automated software system to evaluate breast MR examinations: improved specificity without decreased sensitivity. AJR Am J Roentgenol 2006;187(1):51–56. [DOI] [PubMed] [Google Scholar]
- 22.Makkat S, Luypaert R, Stadnik T, et al. Deconvolution-based dynamic contrast-enhanced MR imaging of breast tumors: correlation of tumor blood flow with human epidermal growth factor receptor 2 status and clinicopathologic findings—preliminary results. Radiology 2008;249(2):471–482. [DOI] [PubMed] [Google Scholar]
- 23.Chen W, Giger ML, Bick U, Newstead GM. Automatic identification and classification of characteristic kinetic curves of breast lesions on DCE-MRI. Med Phys 2006;33(8):2878–2887. [DOI] [PubMed] [Google Scholar]
- 24.Jamieson AR, Giger ML, Drukker K, Li H, Yuan Y, Bhooshan N. Exploring nonlinear feature space dimension reduction and data representation in breast Cadx with Laplacian eigenmaps and t-SNE. Med Phys 2010;37(1):339–351. [DOI] [PMC free article] [PubMed] [Google Scholar]
- 25.Bhooshan N, Giger ML, Jansen SA, Li H, Lan L, Newstead GM. Cancerous breast lesions on dynamic contrast-enhanced MR images: computerized characterization for image-based prognostic markers. Radiology 2010;254(3):680–690. [DOI] [PMC free article] [PubMed] [Google Scholar]
- 26.Agliozzo S, De Luca M, Bracco C, et al. Computer-aided diagnosis for dynamic contrast-enhanced breast MRI of mass-like lesions using a multiparametric model combining a selection of morphological, kinetic, and spatiotemporal features. Med Phys 2012;39(4):1704–1715. [DOI] [PubMed] [Google Scholar]
- 27.Lee SH, Kim JH, Cho N, et al. Multilevel analysis of spatiotemporal association features for differentiation of tumor enhancement patterns in breast DCE-MRI. Med Phys 2010;37(8):3940–3956. [DOI] [PubMed] [Google Scholar]
- 28.Agner SC, Soman S, Libfeld E, et al. Textural kinetics: a novel dynamic contrast-enhanced (DCE)-MRI feature for breast lesion classification. J Digit Imaging 2011;24(3):446–463. [DOI] [PMC free article] [PubMed] [Google Scholar]
- 29.Kuhl CK, Mielcareck P, Klaschik S, et al. Dynamic breast MR imaging: are signal intensity time course data useful for differential diagnosis of enhancing lesions? Radiology 1999;211(1):101–110. [DOI] [PubMed] [Google Scholar]
- 30.Kinkel K, Helbich TH, Esserman LJ, et al. Dynamic high-spatial-resolution MR imaging of suspicious breast lesion: diagnostic criteria and interobserver variability. AJR Am J Roentgenol 2000;175(1):35–43. [DOI] [PubMed] [Google Scholar]
- 31.Agner SC, Soman S, Libfeld E, et al. Novel kinetic texture features for breast lesion classification on dynamic contrast enhanced (DCE) MRI. In: Giger ML, Karssemeijer N, eds. Proceedings of SPIE: medical imaging 2008—computer-aided diagnosis. Vol 6915. Bellingham, Wash: SPIE–The International Society for Optical Engineering, 2008; 69152C. [Google Scholar]
- 32.Agner SC, Xu J, Madabhushi A. Spectral embedding based active contour (SEAC) for lesion segmentation on breast dynamic contrast enhanced magnetic resonance imaging. Med Phys 2013;40(3):032305. [DOI] [PMC free article] [PubMed] [Google Scholar]
- 33.Chen W, Giger ML, Lan L, Bick U. Computerized interpretation of breast MRI: investigation of enhancement-variance dynamics. Med Phys 2004;31(5):1076–1082. [DOI] [PubMed] [Google Scholar]
- 34.Basu S, Chen W, Tchou J, et al. Comparison of triple-negative and estrogen receptor–positive/progesterone receptor–positive/HER2-negative breast carcinoma using quantitative fluorine-18 fluorodeoxyglucose/positron emission tomography imaging parameters: a potentially useful method for disease characterization. Cancer 2008;112(5):995–1000. [DOI] [PubMed] [Google Scholar]
- 35.Zheng Y, Englander S, Baloch S, et al. STEP: spatiotemporal enhancement pattern for MR-based breast tumor diagnosis. Med Phys 2009;36(7):3192–3204. [DOI] [PMC free article] [PubMed] [Google Scholar]
- 36.Chen W, Giger ML, Li H, Bick U, Newstead GM. Volumetric texture analysis of breast lesions on contrast-enhanced magnetic resonance images. Magn Reson Med 2007;58(3):562–571. [DOI] [PubMed] [Google Scholar]
- 37.Haralick RM, Shanmugam K, Dinstein IH. Textural features for image classification. IEEE Trans Syst Man Cybern 1973;3(6):610–621. [Google Scholar]
- 38.Duda RO, Hart PE, Stork DG. Pattern classification. 2nd ed. New York, NY: Wiley, 2001; 680. [Google Scholar]
- 39.Hupse R, Karssemeijer N. The effect of feature selection methods on computer-aided detection of masses in mammograms. Phys Med Biol 2010;55(10):2893–2904. [DOI] [PubMed] [Google Scholar]
- 40.Cortes C, Vapnik V. Support-vector networks. Mach Learn 1995;20(3):273–297. [Google Scholar]
- 41.Bentzen SM. Theragnostic imaging for radiation oncology: dose-painting by numbers. Lancet Oncol 2005;6(2):112–117. [DOI] [PubMed] [Google Scholar]
Associated Data
This section collects any data citations, data availability statements, or supplementary materials included in this article.