The chemical composition of breast tissue in terms of water, lipid, and protein contents can be accurately determined with a single scan by using photon-counting spectral CT imaging.
Abstract
Purpose
To investigate the feasibility of breast tissue characterization in terms of water, lipid, and protein contents with a spectral computed tomographic (CT) system based on a cadmium zinc telluride (CZT) photon-counting detector by using postmortem breasts.
Materials and Methods
Nineteen pairs of postmortem breasts were imaged with a CZT-based photon-counting spectral CT system with beam energy of 100 kVp. The mean glandular dose was estimated to be in the range of 1.8–2.2 mGy. The images were corrected for pulse pile-up and other artifacts by using spectral distortion corrections. Dual-energy decomposition was then applied to characterize each breast into water, lipid, and protein contents. The precision of the three-compartment characterization was evaluated by comparing the composition of right and left breasts, where the standard error of the estimations was determined. The results of dual-energy decomposition were compared by using averaged root mean square to chemical analysis, which was used as the reference standard.
Results
The standard errors of the estimations of the right-left correlations obtained from spectral CT were 7.4%, 6.7%, and 3.2% for water, lipid, and protein contents, respectively. Compared with the reference standard, the average root mean square error in breast tissue composition was 2.8%.
Conclusion
Spectral CT can be used to accurately quantify the water, lipid, and protein contents in breast tissue in a laboratory study by using postmortem specimens.
© RSNA, 2014
Introduction
Mammography is the current standard for breast cancer screening because of its impressive advantages for detection performance, imaging time, and cost-effectiveness (1–5). However, radiologists also widely recognize its limitations, especially for dense breasts (6–8). Inherent to the nature of the two-dimensional projection technique, overlapping breast parenchyma may obscure tumor identification and reduce its positive predictive value (9,10) even with the improved dynamic range offered by the recent advances in digital mammography systems (11–13). Despite the technical advances in mammography, the positive predictive value of malignant tumor detection may be as low as 20%, and benign findings account for a large portion of biopsy results (9). Therefore, it is critical to develop new image-based techniques to improve the predictive power of breast imaging.
A recent report suggests that in addition to irregular mass shape, spiculated mass margin, and patient age, high mammographic attenuation of a mass increases the likelihood of malignancy (14). However, high mass density by itself is not sufficiently accurate to avert the need for a biopsy. If lesions can be characterized quantitatively according to their chemical compositions, predictive capability might be improved. Previous reports (14–17) that used diffuse optical spectroscopy suggested that malignant tumors reduced (by ∼20%) lipid and increased (by >50%) water contents compared with normal breast tissues. There are also other reports that suggest a positive correlation between increased tissue water content and carcinogenesis (18). It was suggested (19) that increased cell water content not only promotes cell division and oncogene expression, but also accelerates respiration rate of cells, which enhances their ability to compete for nutrients with normal cells. The degree of malignancy increases with the degree of cell hydration (20). These reports indicate that sensitivity and specificity may be improved if the water, lipid, and protein contents can be accurately measured to better characterize a lesion according to its composition.
The three-compartment characterization of a lesion can be challenging with the current x-ray imaging technology. Unlike calcification or an iodinated contrast agent, the x-ray attenuation properties of water, lipid, and protein have small differences in the diagnostic energy range (21). Decomposition noise induced by image misregistration or spectral overlap may easily reduce the signal-to-noise ratio to the level where no reliable measurement can be obtained. Recent advances in spectral breast computed tomography (CT) based on energy-resolved photon-counting x-ray detectors offer unique advantages in such imaging tasks (22–26). Photon-counting detectors are able to count individual photons and sort them according to their energies with a typical energy resolution of a few kiloelectron-volts (27). Thus, a proper selection of the energy threshold can effectively reject the electronic noise and minimize the spectral overlap in dual-energy imaging. Moreover, spectral information is acquired simultaneously for different energy ranges within a single scan, which eliminates the need for additional radiation exposure and the potential misregistration artifacts.
The purpose of this study was to investigate the feasibility of breast tissue characterization in terms of water, lipid, and protein contents with a spectral CT system based on a cadmium zinc telluride (CZT) photon-counting detector by using postmortem breasts.
Materials and Methods
Photon-counting Spectral CT System
A bench-top spectral CT system was used for image acquisition, and it consisted of a tungsten target x-ray tube (Dynamax 78E; Machlett Laboratories, Stamford, Conn) with an x-ray generator (Optimus M200; Phillips Healthcare, Best, the Netherlands), a high-precision motor (Kollmorgen Goldline DDR D062M; Danaher Motion, Wood Dale, Ill) that served as the rotational sample platform, and a CZT-based photon-counting detector (eV2500; eV Products, Saxonburg, Pa). The photon-counting detector consisted of a linear row of 64 pixels with a pixel pitch of 0.8 mm. The thickness of the CZT crystal along the x-ray beam direction was 3 mm. A brass collimator shaped the entrance beam to the detector, collimating the height of each pixel to 0.8 mm. The detector has five user-definable energy thresholds. Fan-beam geometry was used with fore- and aft-collimators constructed out of lead sheets. The focal spot size of the x-ray tube was 0.6 mm. The source-to-detector distance and the source-to-object distance were 1.33 m and 0.93 m, respectively, and the magnification was ×1.4. To address the detector size limitation, a translation stage controlled by two-step motors was used to move the sample stage in both vertical and horizontal directions. Therefore, the overall field of view at the isocenter could be expanded up to 12 cm by stitching four scans together. A schematic of the CZT-based spectral CT system is presented in Figure 1.
Figure 1:

A schematic of the bench-top photon-counting spectral CT system.
Calibration Phantom and Postmortem Breasts
A cylindrical calibration phantom with a diameter of 3.175 cm was constructed from polymethylene plastic (Delrin; McMaster-Carr, Elmhurst, Ill), which has been shown previously to be a good candidate for representing the x-ray attenuation properties of protein (28,29). Two holes, with a diameter of 0.95 cm, were drilled in the phantom and were subsequently filled with water and vegetable oil. Thus, the three-compartment phantom consisted of the surrogate materials for water, lipid, and protein contents, respectively. The potential errors introduced by the calibration material selection were previously reported (21,28).
This postmortem study was exempt from institutional review board approval. Nineteen pairs (left and right) of breasts were acquired from the Willed Body Program in the University of California-Irvine School of Medicine. The breasts, including the skin, were surgically removed from the cadaver to the pectoralis major muscle and kept frozen inside plastic bags with careful labeling. The mass of the breasts varied from 136 g to 2330 g. The breast density range, measured by using cone-beam CT, was approximately 5%–70% (30). The breasts were removed from the freezer and kept at approximately 4°C for a day before the experiment. To prevent any water loss during the experiment, the breasts were wrapped with thin plastic and shaped into cylinders with a diameter of approximately 10 cm by using white polystyrene foam that is almost transparent to x-ray beam. Before each CT scan, samples were kept at room temperature for at least 30 minutes to allow for tissue relaxation.
Dual-Energy Image Acquisition and Processing
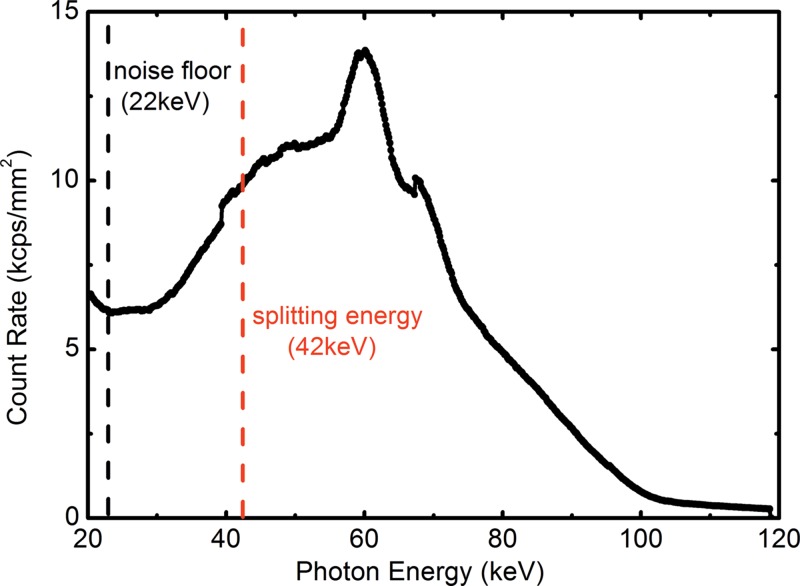
By using the energy discrimination capability of the CZT detector, the detected photons in a single exposure were sorted into the low- and high-energy bins, which are separated by splitting energy. The optimal imaging protocol, in terms of tube voltage and splitting energy for water, lipid, and protein decomposition, was previously reported (22). CT scans were acquired at beam energy of 100 kVp with a splitting energy at 42 keV. A prefiltration of 2 mm aluminum was used. The measured x-ray spectrum is shown in Figure 2 with the selection of the noise floor and the splitting energy. The mean glandular dose was estimated according to previous Monte Carlo simulations (31), and it was adjusted for the helical scanning mode with a pitch of 2. The mean glandular dose was approximately 2.0 mGy for a 14-cm breast of 30% glandularity. A flat field calibration was applied to correct the pixel nonuniformity by multiplying a gain factor obtained from the ratio between the corresponding pixel and the average count of all 64 pixels (32). Four helical scans with pitch of 2 were acquired to cover the whole three-dimensional volume of a breast, which was translated horizontally between each scan. Four acquisitions were properly aligned and interpolated to form a full field-of-view sonogram that consisted of 1229 projections over 360° with an angular increment of 0.29° per projection for each section. The number of projections was carefully calibrated according to the rotation speed of the sample stage and the CZT detector frame time. CT images were then reconstructed with filtered back-projection method. Depending on the breast size, the scanning time in this study was 1–7 hours. This was because of the small detector size (5–cm line detector).
Figure 2:
Graph shows experimentally measured tungsten anode spectrum at 100 kVp. The electronic noise floor and the splitting threshold between the low- and high-energy bins were noted as dashed lines at 22 and 42 keV, respectively.
The voxel values in the reconstructed dual-energy CT images were represented by the effective attenuation coefficients for the corresponding energy bins, which were used for dual-energy decomposition (22). The three-material decomposition was achieved with an additional constraint, which assumed that the total volume of water, lipid, and protein in each voxel equals the known voxel size. The calibration phantom was first imaged to determine the system matrix calibration coefficients (22). Then, the dual-energy signals of the postmortem breasts were measured over the entire volume, including the skin, and subsequently inputted into the system matrix to determine the image-based volumetric fractions of water, lipid, and protein.
Current CZT-based photon-counting detectors have discernible spectral distortions because of limited counting capability, pulse pile-up, charge sharing, and other artifacts (33–36). As a result, photons may be registered with incorrect energies and sorted into the wrong energy bins. Spectral distortion introduces undesired spectral overlap between the low- and high-energy images, which will deteriorate the accuracy for quantitative material decomposition. This is especially true in the case of water, lipid, and protein decomposition, where the x-ray attenuation difference is relatively small. To address this issue, a spectral distortion correction technique was applied in the projection domain by matching the recorded pixel values to the simulated ones in each energy bin (37). The technique has been validated in phantom studies, where the undesired spectral overlap between the low- and high-energy images can be effectively minimized (37). Dual-energy decomposition was then performed by using corrected images.
Chemical Analysis
Chemical analysis was used as the reference standard. The chemical analysis method was based on a standardized procedure devised by the U.S. Department of Agriculture to measure the content of water, lipid, lean, and mineral in a sample (38). Each postmortem breast was chemically decomposed into water, lipid, and protein contents right after imaging. Skin was also included in the chemical analysis so that the total volume under investigation was consistent with the image-based measurement. The measured masses of water, lipid, and protein contents were converted into volumes by using their known densities. The error from chemical analysis was estimated to be approximately 1% (30,39).
Statistical Analysis
The precision of the investigated the dual-energy decomposition technique was evaluated by the right-left breast correlations for water, lipid, and protein contents, respectively. The accuracy of the breast tissue compositional analysis was evaluated by comparing the volumetric fractions of water, lipid, and protein contents measured by using photon-counting spectral CT to the reference standard obtained from chemical analysis. Linear regression analysis was performed by using data analysis and graphing software (Origin; OriginLab, Northampton, Mass). Pearson correlation coefficient was used to evaluate the strength of the correlation. Standard error of the estimate was also used to investigate the deviation from the best fitted line. Error in quantitative decompositions was estimated with root mean square error for the water, lipid, and protein contents, respectively. In addition, the root mean square error in tissue compositional characterization was derived from the measured fractions of all three components in a given breast and was averaged over all breasts.
Results
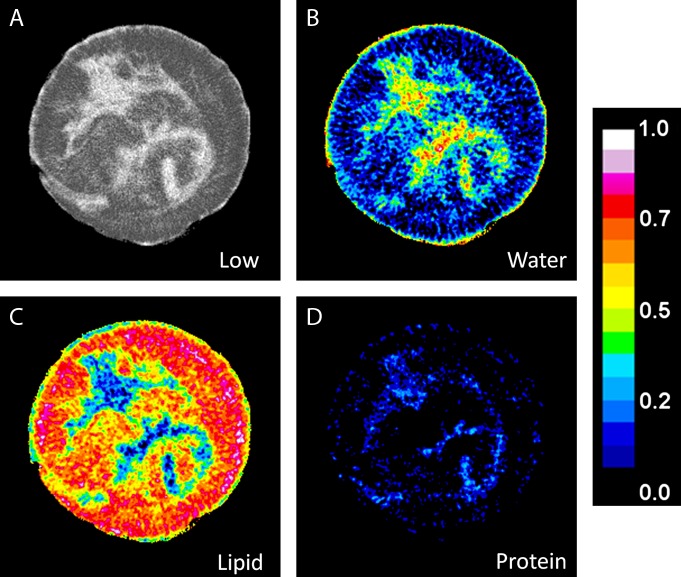
An example of the low-energy image with the decomposed water, lipid, and protein images of a postmortem breast are shown in Figure 3. Water is present in all different tissues in the breast; however, it has a much higher concentration in the fibroglandular tissue and the skin. On the other hand, lipid can only be seen in adipose tissue with minimal amount in the fibroglandular regions of the breast.
Figure 3:
A, Low-energy CT image of a postmortem breast, and the corresponding decomposition images for, B, water, C, lipid, and, D, protein. The color scale represents the absolute volumetric fraction for different components in a given voxel.
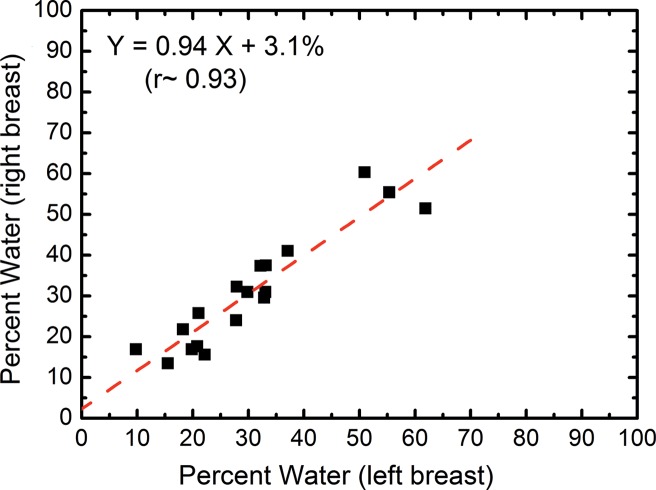
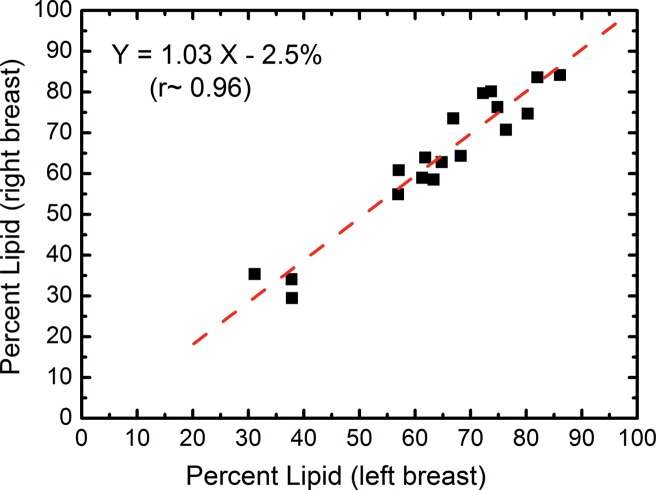
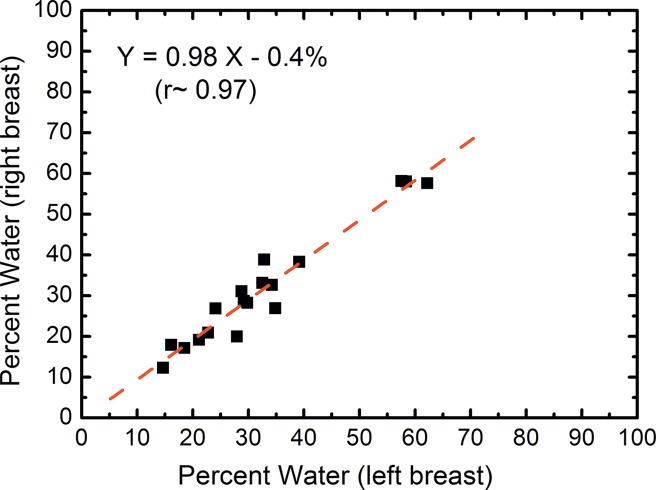
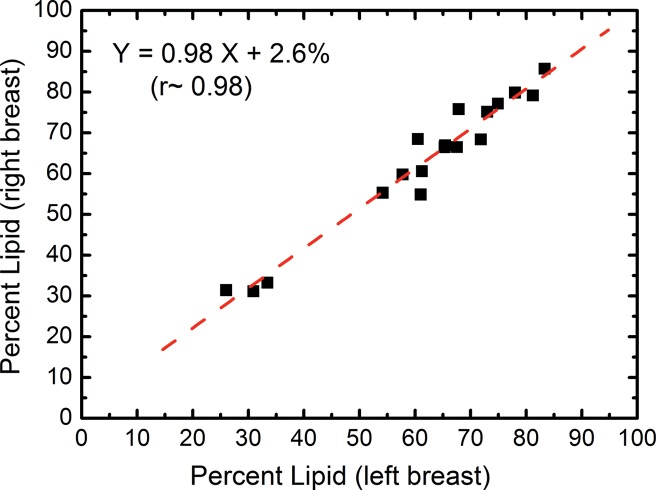
In the right-left correlation study, the chemical analysis shows excellent correlations with slopes approaching unity for water, lipid, and protein contents (Fig 4, Table 1). Breast tissue compositions measured with spectral CT imaging also showed excellent right-left correlations with slopes very close to unity. The result from the protein measurement was more scattered than those from water and lipid contents. This is because the measurement errors became larger when the small range of protein fractions in breast tissue was compared. Nevertheless, the absolute errors in the fractional measurement remained small. The standard error of the estimate for water, lipid, and protein contents were estimated to be 7.4%, 6.7%, and 3.2%, respectively.
Figure 4a:
Scatterplots show the right-left correlation of (a) water and (b) lipid contents measured from spectral CT by using dual-energy decomposition and (c, d) from chemical analysis. Linear fittings for all three contents are shown with dashed lines, which are in good agreement with the identity line.
Table 1.
Summary of the Linear Regression Analysis of the Right-Left Correlations of Breast Composition for Both Chemical Analysis and Spectral CT Measurements

Note.—SEE = standard error of the estimate.
Figure 4b:
Scatterplots show the right-left correlation of (a) water and (b) lipid contents measured from spectral CT by using dual-energy decomposition and (c, d) from chemical analysis. Linear fittings for all three contents are shown with dashed lines, which are in good agreement with the identity line.
Figure 4c:
Scatterplots show the right-left correlation of (a) water and (b) lipid contents measured from spectral CT by using dual-energy decomposition and (c, d) from chemical analysis. Linear fittings for all three contents are shown with dashed lines, which are in good agreement with the identity line.
Figure 4d:
Scatterplots show the right-left correlation of (a) water and (b) lipid contents measured from spectral CT by using dual-energy decomposition and (c, d) from chemical analysis. Linear fittings for all three contents are shown with dashed lines, which are in good agreement with the identity line.
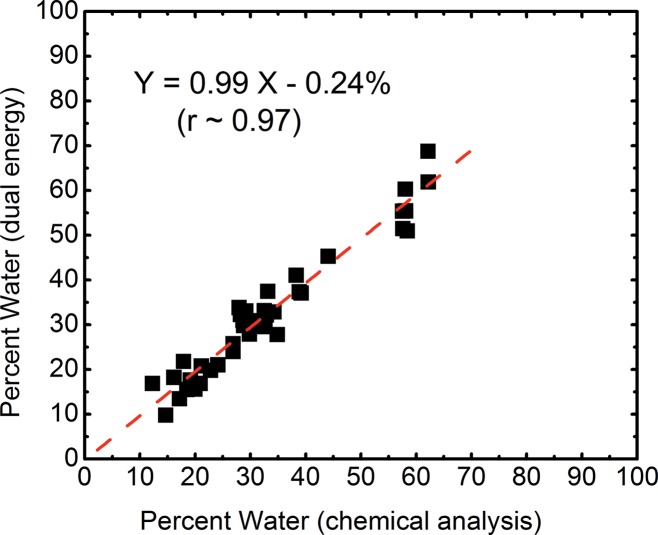
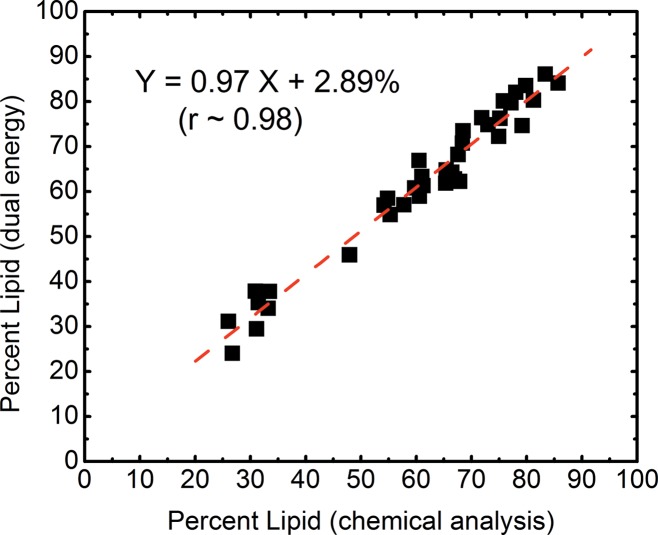
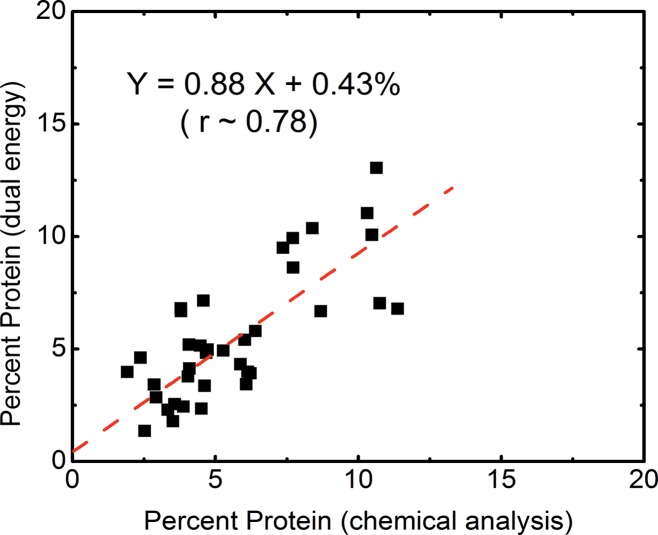
The volumetric fractions of water, lipid, and protein contents obtained from dual-energy decomposition were shown to have excellent agreement with respect to those from chemical analysis (Table 2). Good correlations between the spectral CT data and the reference standard were observed for all of the three tissue components (Fig 5). The root mean square errors for the dual-energy measurements of the water, lipid, and protein contents were estimated to be 3.5%, 3.3%, and 1.9%, respectively. The average root mean square error for all the breasts was approximately 2.8%.
Table 2.
Statistical Analysis of the Water, Lipid, and Protein Volumetric Fractions Measured with Spectral CT with Respect to the Reference Standard from Chemical Analysis

Note.—Data in parentheses are values from chemical analysis.
Figure 5a:
Scatterplots show correlations of the volumetric fractions of (a) water, (b) lipid, and (c) protein contents derived from dual-energy images and chemical analysis. Linear fittings for all three components are shown with dashed lines, which are in good agreement with the identity line.
Figure 5b:
Scatterplots show correlations of the volumetric fractions of (a) water, (b) lipid, and (c) protein contents derived from dual-energy images and chemical analysis. Linear fittings for all three components are shown with dashed lines, which are in good agreement with the identity line.
Figure 5c:
Scatterplots show correlations of the volumetric fractions of (a) water, (b) lipid, and (c) protein contents derived from dual-energy images and chemical analysis. Linear fittings for all three components are shown with dashed lines, which are in good agreement with the identity line.
Discussion
The proposed dual-energy decomposition technique by using the photon-counting spectral breast CT enables characterization of lesions according to their chemical composition. Several studies (40–43) reported the x-ray attenuation properties of normal and neoplastic breast tissues. Differences in linear attenuation coefficients between malignant and normal breast tissues can be significant in the low-energy range, especially when different tissue types from the same patient are compared. The differences in linear attenuation coefficient between malignant and normal tissues indicate that their water, lipid, and protein contents should be different. In this context, the discrimination capability for suspicious lesions might be improved if the composition of lesions can be accurately determined. Such information may increase the positive predictive value for diagnostic imaging and reduce the number of biopsies needed for suspicious lesions and the number of benign biopsy findings.
In addition, the proposed technique can provide quantitative metrics to potentially stratify women according to breast cancer risk. The current standard of care for breast density evaluation involves visual assessment of mammograms by using the four-category Breast Imaging Reporting and Data System. This subjective classification scheme is limited by its considerable intra- and interreader variability (44). At the same time, it would be difficult to use such a qualitative ranking in statistical cancer risk models. Breast density, defined as the fibroglandular ratio of the whole breast, has been widely recognized as a risk factor for breast cancer development. However, volumetric breast density quantification requires an accurate measurement of the fibroglandular and adipose volumes, which can be challenging with a single exposure. Dual-energy mammography has also been proposed to quantify breast density, but the accuracy may be affected by system calibration because of wide variations in the chemical composition of fibroglandular and adipose tissue (45). To extend the traditional two-compartment model into a three-compartment model, which decomposes breast tissue into its fundamental water, lipid, and protein contents, enables quantitative categorization according to breast composition. It also addresses the limitation with system calibration for dual-energy imaging, where the calibration phantom is easily standardized by using common materials. Thus, the water, lipid, and protein decomposition has the potential to provide cancer risk evaluation superior to that of mammographic breast density. Moreover, a previous report has suggested that water content of tissue can be affected by pathologic changes (46). It would be of great importance to study the correlation between composition changes in the surrounding tissue, such as increased water content, and the tumor genesis process. Additional relevant information to help characterize tumor progression and response may be provided by mapping the water fraction in tissue.
Because of the small differences in their x-ray attenuation properties, it is extremely challenging to quantify the three primary components (water, lipid, and protein) of a lesion by using standard x-ray images. Our study investigated the feasibility of dual-energy tissue compositional characterization by using a spectral CT system based on an energy-resolved photon-counting CZT detector. Postmortem breasts were imaged in this study so that the definitive tissue composition, in terms of water, lipid, and protein contents, can be derived from chemical analysis. Our results suggest that the chemical composition of breast tissue can be characterized accurately at a dose level of approximately 2 mGy with CZT-based spectral CT after spectral correction. The estimated error from dual-energy decomposition was less than 3%. Compared with a similar study that used a flat-panel–based cone-bean CT system, the accuracy for tissue characterization was improved by using only a third of the dose (28). Although our study used the whole volume of breast, the proposed technique can be readily implemented to characterize the chemical composition of lesions with small volumes. With a reliable technique for tissue characterization, future studies can be conducted to investigate the compositional differences between malignant and normal tissues.
The tissue compositional measurement from chemical analysis was in good agreement with previous reports (28,45), where the volumetric fractions of water, lipid, and protein were estimated to be 29%, 63%, and 7% for a breast with average breast density (47). These numbers matched well with the median values of our results. It should also be noted that the fractions of lipid and water is strongly correlated (r > 0.99) with a slope of −1.2. At the same time, protein fraction positively correlated (r = ∼0.95) to water with a slope of 0.2. Such correlations can be attributed to the fact that lipid and water were found primarily in adipose and glandular tissues, respectively, while protein can only be found in glandular tissue.
The tube voltage and splitting energy used in this study were based on a previously reported simulation study that maximized the dual-energy signal-to-noise ratio with respect to mean glandular dose (22). The low-energy photons carry useful information for material differentiation; however, they are also associated with high radiation dose. The selection of the splitting energy is thus critical for the dose efficiency and accuracy of the technique.
The postmortem breasts were kept frozen before the experiment. Therefore, the measured chemical composition may not reflect the exact property of in vivo breast tissue. Furthermore, the skin was included in both chemical analysis and dual-energy decomposition. However, it should not affect the accuracy determination because the compositions were compared for the same breast volume between the two techniques. In addition, a calibration phantom that consisted of water, vegetable oil, and polymethylene plastic was used to represent water, lipid, and protein, respectively. This may introduce errors in dual-energy decomposition (28). The accuracy of this study can be further improved by using calibration material that more closely resembles the x-ray attenuation property of protein. Another limitation is that our study analyzed the whole breast volume, where the region of interest can be objectively defined. However, in lesion studies, the measured chemical compositions may depend on the region of interest selection. It would be interesting to test the dual-energy decomposition technique by using small regions of interest for the evaluation of the associated inter-and intraobserver variability. Finally, the scanning time in this study is relatively long (1–7 hours) because of the small detector size. A full field-of-view detector that can cover the entire breast and an x-ray tube with sufficient power will be required for clinical implementation.
In summary, the postmortem study indicated that spectral CT imaging based on an energy-resolved photon-counting detector can be used to accurately characterize the chemical composition of breast tissue in terms of water, lipid, and protein contents with a relatively low radiation dose. In the future, the dual-energy compositional analysis of a lesion may be used to improve the sensitivity and specificity in breast cancer diagnosis. Such information may also help to manage individual cancer risk.
Advance in Knowledge
■ In a postmortem study, spectral CT based on an energy-resolved photon-counting detector accurately characterized breast tissue by the volumetric fractions of water, lipid, and protein contents, with an average root mean square error of less than 3% with respect to the reference standard from chemical analysis.
Implication for Patient Care
■ An accurate breast tissue characterization, in terms of its water, lipid, and protein contents, can potentially be used to differentiate malignant lesions from benign ones, which may reduce the number of false-positive biopsies.
Acknowledgments
Acknowledgments
The authors thank Pavlo Baturin, PhD, Bo Zhao, PhD, Farnaz Behroozi, BS, and Frances Yu, BS, for their assistance with data acquisition and image processing.
Received November 29, 2013; revision requested January 13, 2014; revision received February 25; accepted March 10; final version accepted March 14.
Funding: This research was supported by the National Institutes of Health (grant R01CA13687).
Disclosures of Conflicts of Interest: H.D. No relevant conflicts of interest to disclose. M.J.K. No relevant conflicts of interest to disclose. J.L.D. No relevant conflicts of interest to disclose. F.M. No relevant conflicts of interest to disclose. S.M. No relevant conflicts of interest to disclose.
Abbreviation:
- CZT
- cadmium zinc telluride
References
- 1.Sala M, Comas M, Macià F, Martinez J, Casamitjana M, Castells X. Implementation of digital mammography in a population-based breast cancer screening program: effect of screening round on recall rate and cancer detection. Radiology 2009;252(1):31–39. [DOI] [PubMed] [Google Scholar]
- 2.Zare Z, Faghihi Langroudi T. Findings of breast sonography in patients with foal asymmetric breast density on mammography. Iran Red Crescent Med J 2011;13(6):404–406. [PMC free article] [PubMed] [Google Scholar]
- 3.Shin HJ, Kim HH, Ahn JH, et al. Comparison of mammography, sonography, MRI and clinical examination in patients with locally advanced or inflammatory breast cancer who underwent neoadjuvant chemotherapy. Br J Radiol 2011;84(1003):612–620. [DOI] [PMC free article] [PubMed] [Google Scholar]
- 4.Houssami N, Miglioretti DL. Early detection of breast cancer the second time around: mammography in women with a personal history of breast cancer. Med J Aust 2011;194(9):439–440. [DOI] [PubMed] [Google Scholar]
- 5.Feig S. Comparison of costs and benefits of breast cancer screening with mammography, ultrasonography, and MRI. Obstet Gynecol Clin North Am 2011;38(1):179–196, ix. [DOI] [PubMed] [Google Scholar]
- 6.Bird RE, Wallace TW, Yankaskas BC. Analysis of cancers missed at screening mammography. Radiology 1992;184(3):613–617. [DOI] [PubMed] [Google Scholar]
- 7.Mandelson MT, Oestreicher N, Porter PL, et al. Breast density as a predictor of mammographic detection: comparison of interval- and screen-detected cancers. J Natl Cancer Inst 2000;92(13):1081–1087. [DOI] [PubMed] [Google Scholar]
- 8.Rosenberg RD, Hunt WC, Williamson MR, et al. Effects of age, breast density, ethnicity, and estrogen replacement therapy on screening mammographic sensitivity and cancer stage at diagnosis: review of 183,134 screening mammograms in Albuquerque, New Mexico. Radiology 1998;209(2):511–518. [DOI] [PubMed] [Google Scholar]
- 9.Poplack SP, Carney PA, Weiss JE, Titus-Ernstoff L, Goodrich ME, Tosteson AN. Screening mammography: costs and use of screening-related services. Radiology 2005;234(1):79–85. [DOI] [PubMed] [Google Scholar]
- 10.Woods RW, Sisney GS, Salkowski LR, Shinki K, Lin Y, Burnside ES. The mammographic density of a mass is a significant predictor of breast cancer. Radiology 2011;258(2):417–425. [DOI] [PMC free article] [PubMed] [Google Scholar]
- 11.Diekmann F, Freyer M, Diekmann S, et al. Evaluation of contrast-enhanced digital mammography. Eur J Radiol 2011;78(1):112–121. [DOI] [PubMed] [Google Scholar]
- 12.Pinker K, Perry N, Milner S, Mokbel K, Duffy S. Accuracy of breast cancer detection with full-field digital mammography and integral computer-aided detection correlated with breast density as assessed by a new automated volumetric breast density measurement system. Breast Cancer Res 2010;12(Suppl 3):P4. [Google Scholar]
- 13.Pinker K, Perry N, Milner S, Mokbel K, Duffy S. Sensitivity of integral computer-aided detection with full-field digital mammography for detection of breast cancer according to different histopathological tumor types and appearances. Breast Cancer Res 2010;12(Suppl 3):P13. [Google Scholar]
- 14.Chung SH, Cerussi AE, Klifa C, et al. In vivo water state measurements in breast cancer using broadband diffuse optical spectroscopy. Phys Med Biol 2008;53(23):6713–6727. [DOI] [PMC free article] [PubMed] [Google Scholar]
- 15.Cerussi A, Shah N, Hsiang D, Durkin A, Butler J, Tromberg BJ. In vivo absorption, scattering, and physiologic properties of 58 malignant breast tumors determined by broadband diffuse optical spectroscopy. J Biomed Opt 2006;11(4):044005. [DOI] [PubMed] [Google Scholar]
- 16.Tromberg BJ, Cerussi A, Shah N, et al. Imaging in breast cancer: diffuse optics in breast cancer: detecting tumors in pre-menopausal women and monitoring neoadjuvant chemotherapy. Breast Cancer Res 2005;7(6):279–285. [DOI] [PMC free article] [PubMed] [Google Scholar]
- 17.Haka AS, Shafer-Peltier KE, Fitzmaurice M, Crowe J, Dasari RR, Feld MS. Diagnosing breast cancer by using Raman spectroscopy. Proc Natl Acad Sci U S A 2005;102(35):12371–12376. [DOI] [PMC free article] [PubMed] [Google Scholar]
- 18.Olmstead E-G. Mammalian cell water: physiologic and clinical aspects. Philadelphia, Pa: Lea & Febiger, 1966; 185–195. [Google Scholar]
- 19.McIntyre GI. Increased cell hydration promotes both tumor growth and metastasis: a biochemical mechanism consistent with genetic signatures. Med Hypotheses 2007;69(5):1127–1130. [DOI] [PubMed] [Google Scholar]
- 20.McIntyre GI. Cell hydration as the primary factor in carcinogenesis: A unifying concept. Med Hypotheses 2006;66(3):518–526. [DOI] [PubMed] [Google Scholar]
- 21.Laidevant AD, Malkov S, Flowers CI, Kerlikowske K, Shepherd JA. Compositional breast imaging using a dual-energy mammography protocol. Med Phys 2010;37(1):164–174. [DOI] [PMC free article] [PubMed] [Google Scholar]
- 22.Ding H, Ducote JL, Molloi S. Breast composition measurement with a cadmium-zinc-telluride based spectral computed tomography system. Med Phys 2012;39(3):1289–1297. [DOI] [PMC free article] [PubMed] [Google Scholar]
- 23.Kalender WA, Beister M, Boone JM, Kolditz D, Vollmar SV, Weigel MC. High-resolution spiral CT of the breast at very low dose: concept and feasibility considerations. Eur Radiol 2012;22(1):1–8. [DOI] [PubMed] [Google Scholar]
- 24.Shikhaliev PM, Fritz SG. Photon counting spectral CT versus conventional CT: comparative evaluation for breast imaging application. Phys Med Biol 2011;56(7):1905–1930. [DOI] [PubMed] [Google Scholar]
- 25.Bornefalk H, Danielsson M. Photon-counting spectral computed tomography using silicon strip detectors: a feasibility study. Phys Med Biol 2010;55(7):1999–2022. [DOI] [PubMed] [Google Scholar]
- 26.Kalluri KS, Mahd M, Glick SJ. Investigation of energy weighting using an energy discriminating photon counting detector for breast CT. Med Phys 2013;40(8):081923. [DOI] [PMC free article] [PubMed] [Google Scholar]
- 27.Barber WC, Nygard E, Iwanczyk JS, et al. Characterization of a novel photon counting detector for clinical CT: count rate, energy resolution, and noise performance. In: Samei E, Hsieh J, eds. Proceedings of SPIE: medical imaging 2009—physics of medical imaging. Vol 7258. Bellingham, Wash: SPIE–The International Society for Optical Engineering, 2009; 725824. [Google Scholar]
- 28.Ding H, Ducote JL, Molloi S. Measurement of breast tissue composition with dual energy cone-beam computed tomography: a postmortem study. Med Phys 2013;40(6):061902. [DOI] [PMC free article] [PubMed] [Google Scholar]
- 29.Wilson JP, Mulligan K, Fan B, et al. Dual-energy X-ray absorptiometry-based body volume measurement for 4-compartment body composition. Am J Clin Nutr 2012;95(1):25–31. [DOI] [PMC free article] [PubMed] [Google Scholar]
- 30.Johnson T, Ding H, Le HQ, Ducote JL, Molloi S. Breast density quantification with cone-beam CT: a post-mortem study. Phys Med Biol 2013;58(23):8573–8591. [DOI] [PMC free article] [PubMed] [Google Scholar]
- 31.Boone JM. Normalized glandular dose (DgN) coefficients for arbitrary X-ray spectra in mammography: computer-fit values of Monte Carlo derived data. Med Phys 2002;29(5):869–875. [DOI] [PubMed] [Google Scholar]
- 32.Le Huy Q, Ducote JL, Molloi S. Radiation dose reduction using a CdZnTe-based computed tomography system: comparison to flat-panel detectors. Med Phys 2010;37(3):1225–1236. [DOI] [PMC free article] [PubMed] [Google Scholar]
- 33.Xu C, Danielsson M, Bornefalk H. Evaluation of energy loss and charge sharing in cadmium telluride detectors for photon-counting computed tomography. IEEE Trans Nucl Sci 2011;58(3):614–625. [Google Scholar]
- 34.Wang AS, Harrison D, Lobastov V, Tkaczyk JE. Pulse pileup statistics for energy discriminating photon counting x-ray detectors. Med Phys 2011;38(7):4265–4275. [DOI] [PubMed] [Google Scholar]
- 35.Strassburg M, Schroeter C, Hackenschmied P. CdTe/CZT under high flux irradiation. J Instrum 2011;6(1):C01055. [Google Scholar]
- 36.Taguchi K, Frey EC, Wang XL, Iwanczyk JS, Barber WC. An analytical model of the effects of pulse pileup on the energy spectrum recorded by energy resolved photon counting x-ray detectors. Med Phys 2010;37(8):3957–3969. [DOI] [PMC free article] [PubMed] [Google Scholar]
- 37.Ding H, Molloi S. Image-based spectral distortion correction for photon-counting x-ray detectors. Med Phys 2012;39(4):1864–1876. [DOI] [PMC free article] [PubMed] [Google Scholar]
- 38.United States Department of Agriculture , eds. Determination of fat CLG-FAT. Washington, DC: Food Safety and Inspection Service, Office of Public Health Science, 2009; 1–8. [Google Scholar]
- 39.Ducote JL, Klopfer MJ, Molloi S. Volumetric lean percentage measurement using dual energy mammography. Med Phys 2011;38(8):4498–4504. [DOI] [PMC free article] [PubMed] [Google Scholar]
- 40.Johns PC, Yaffe MJ. X-ray characterisation of normal and neoplastic breast tissues. Phys Med Biol 1987;32(6):675–695. [DOI] [PubMed] [Google Scholar]
- 41.Tomal A, Mazarro I, Kakuno EM, Poletti ME. Experimental determination of linear attenuation coefficient of normal, benign and malignant breast tissues. Radiat Meas 2010;45(9):1055–1059. [Google Scholar]
- 42.al-Bahri JS , Spyrou NM. Photon linear attenuation coefficients and water content of normal and pathological breast tissues. Appl Radiat Isot 1996;47(8):777–784. [DOI] [PubMed] [Google Scholar]
- 43.Chen RC, Longo R, Rigon L, et al. Measurement of the linear attenuation coefficients of breast tissues by synchrotron radiation computed tomography. Phys Med Biol 2010;55(17):4993–5005. [DOI] [PubMed] [Google Scholar]
- 44.Ciatto S, Houssami N, Apruzzese A, et al. Categorizing breast mammographic density: intra- and interobserver reproducibility of BI-RADS density categories. Breast 2005;14(4):269–275. [DOI] [PubMed] [Google Scholar]
- 45.Woodard HQ, White DR. The composition of body tissues. Br J Radiol 1986;59(708):1209–1218. [DOI] [PubMed] [Google Scholar]
- 46.Charles-Edwards EM, deSouza NM. Diffusion-weighted magnetic resonance imaging and its application to cancer. Cancer Imaging 2006;6:135–143. [DOI] [PMC free article] [PubMed] [Google Scholar]
- 47.Yaffe MJ, Boone JM, Packard N, et al. The myth of the 50-50 breast. Med Phys 2009;36(12):5437–5443. [DOI] [PMC free article] [PubMed] [Google Scholar]


