CT perfusion imaging is a promising technique for diagnosing primary or metastatic tumors, for assessing the efficacy of systemic or local tumor therapy, for predicting early response to anticancer treatments, and for monitoring tumor recurrence after therapy.
Abstract
With the introduction of molecularly targeted chemotherapeutics, there is an increasing need for defining new response criteria for therapeutic success because use of morphologic imaging alone may not fully assess tumor response. Computed tomographic (CT) perfusion imaging of the liver provides functional information about the microcirculation of normal parenchyma and focal liver lesions and is a promising technique for assessing the efficacy of various anticancer treatments. CT perfusion also shows promising results for diagnosing primary or metastatic tumors, for predicting early response to anticancer treatments, and for monitoring tumor recurrence after therapy. Many of the limitations of early CT perfusion studies performed in the liver, such as limited coverage, motion artifacts, and high radiation dose of CT, are being addressed by recent technical advances. These include a wide area detector with or without volumetric spiral or shuttle modes, motion correction algorithms, and new CT reconstruction technologies such as iterative algorithms. Although several issues related to perfusion imaging—such as paucity of large multicenter trials, limited accessibility of perfusion software, and lack of standardization in methods—remain unsolved, CT perfusion has now reached technical maturity, allowing for its use in assessing tumor vascularity in larger-scale prospective clinical trials. In this review, basic principles, current acquisition protocols, and pharmacokinetic models used for CT perfusion imaging of the liver are described. Various oncologic applications of CT perfusion of the liver are discussed and current challenges, as well as possible solutions, for CT perfusion are presented.
© RSNA, 2014
Learning Objectives:
After reading the article and taking the test, the reader will be able to:
■ Discuss the fundamental processes and pharmacokinetic models involved in CT perfusion
■ Demonstrate the unique characteristics of the liver in regard to CT perfusion
■ Explain the relationship between CT perfusion parameters and pathologic features of angiogenesis
■ Describe how CT perfusion parameters are altered in liver tumors
■ Discuss the limitations and possible solutions of past and current CT perfusion examinations
Accreditation and Designation Statement
The RSNA is accredited by the Accreditation Council for Continuing Medical Education (ACCME) to provide continuing medical education for physicians. The RSNA designates this journal-based activity for a maximum of 1.0 AMA PRA Category 1 Credit TM. Physicans should claim only the credit commensurate with the extent of their participation in the activity.
Disclosure Statement
The ACCME requires that the RSNA, as an accredited provider of CME, obtain signed disclosure statements from the authors, editors, and reviewers for this activity. For this journal-based CME activity, author disclosures are listed at the end of this article.
Introduction
In the field of oncology, accurate liver imaging is critically important for appropriate management of cancer patients. The liver is the second most common site of metastatic disease after lymph node metastases and the most common metastatic site in patients with colorectal cancer (1,2). Primary liver tumors are common, with hepatocellular carcinoma (HCC) representing the most common primary hepatic malignancy and the third most common cause of cancer-related death worldwide. Accurate imaging techniques for early detection, staging, and monitoring of liver disease are of utmost importance (3).
Currently, diagnosis and monitoring of liver diseases are primarily performed with morphologic imaging techniques such as computed tomography (CT), magnetic resonance (MR) imaging, and ultrasonography (US). Treatment effects of conventional chemotherapeutic agents are assessed after three to four cycles of chemotherapy (after about 1 to 2 months into the therapy) and changes in lesion sizes, as classified according to Response Evaluation Criteria in Solid Tumor (RECIST) or modified RECIST (mRECIST) for HCC, are used to render further treatment decisions (4,5). However, when treated with molecularly targeted therapeutic agents in oncology, lesions that may be responding to treatment may not change in size. Therefore, new imaging criteria are needed to better characterize treatment response in oncology. Moreover, molecularly targeted agents are often expensive and have potential serious side effects. Criteria that allow early assessment of treatment response to allow for treatment decisions, including potential termination of ineffective chemotherapy during early phases of treatment, could provide better therapy and help reduce health care costs (6,7). Imaging biomarkers can be used as a surrogate marker in determining treatment response for late-phase trials or clinical practice, where the goal is to assess the clinical outcome, as well as for phase II trials, where the aim is to demonstrate that drugs have an effect on tumor biology.
A more personalized approach of cancer treatment can be achieved either by assessment of tissue biomarkers obtained directly from tumor specimens following needle biopsies or noninvasively with imaging biomarkers. Although advances in whole genome sequencing have identified tumor development genes and susceptibility genetic biomarkers to allow tailored chemotherapeutic treatments (8,9), this approach has several drawbacks. First, tissue biopsy requires local anesthesia or patient sedation, and the invasive nature of needle biopsies carries inherent risks such as infection or bleeding. In addition, biopsies can potentially stimulate neoangiogenesis by damaging tumor tissue and increase metastatic risk by increasing the number of circulating tumor cells (10). Furthermore, sampling errors caused by obtaining tissue specimens from only small portions of the tumor may not yield a representative picture of tumor response. For example, samples obtained from necrotic portions of tumors would not depict accurate tumor viability. Imaging biomarkers, on the other hand, can allow assessment of tumor properties noninvasively that can readily be repeated at several time points and can be used to evaluate tumor response across an entire three-dimensional volume of tissue. As a matter of course, there might be potential advantages of combining the information from imaging and tissue or genetic biomarkers in cancer treatment.
Emerging functional and molecular imaging techniques using MR imaging, CT, US, positron emission tomography (PET), and optical-based technologies are being developed and have shown promising results for monitoring cancer more accurately than traditional morphologic imaging (11–17). Among these, CT is currently the most commonly used first-line imaging modality for staging and monitoring of diseases in oncology because of its wide availability and the availability of standardized CT protocols which yield reproducible imaging results. CT perfusion, the measurement of blood flow characteristics through dynamic CT acquisitions following intravenous administration of contrast agents, can easily be integrated into routine CT imaging protocols within the same imaging session. Several studies have shown that CT perfusion parameters correlate well with the presence and extent of tumor vessels (18–20), which could be leveraged for earlier detection of liver malignancies and more individualized monitoring of patients during treatment. In addition, CT perfusion can be integrated with PET examinations, allowing assessment of both the hemodynamic and metabolic tumor status.
Herein, we review the basic principles, current acquisition protocols, and pharmacokinetic models used for CT perfusion imaging of the liver. Potential clinical applications of CT perfusion imaging for earlier detection and treatment monitoring of hepatic malignancies and current challenges and potential solutions for this technique are discussed.
Basic Principles of CT Perfusion Imaging
Perfusion is the transport of blood to a unit volume of tissue per unit of time and usually refers to the blood transport at the capillary level. CT perfusion is based on the increase and subsequent decrease of contrast agent concentrations in tissues as a function of time. Because tissue attenuation measured with CT and expressed in Hounsfield units is directly proportional to the local concentration of contrast agent in the tissue (21,22), CT assessment of tissue perfusion is possible. This quantitative information cannot be obtained with conventional contrast material–enhanced CT where the degree of tumor enhancement at certain time-points (ie, arterial or portal venous phase) is just a mixed result of entering and exiting of contrast agent and thus is usually assessed qualitatively.
CT perfusion analysis is based on several fundamental requirements. One is sequential CT scanning of the same volume over time, performed before, during, and after intravenous administration of contrast agents to trace the temporal changes in CT attenuation in the tissue volume of interest. The tissue enhancement measured after contrast material injection can be divided into two phases based on the distribution of contrast agent in the intravascular or the extravascular-extracellular (interstitial) compartment (23,24). In the first phase, the enhancement is mainly due to the contrast material within the intravascular space (23,24). Later, in the second phase, tissue enhancement results as contrast material passes from the intravascular to the extravascular-extracellular space across the capillary basement membrane (23,24). Therefore, in the first phase, the enhancement is determined to a great extent by the blood flow, while in the second phase, the enhancement depends on the blood volume and the permeability of capillaries to the contrast agent (23,24). The contrast agent present in the volume of interest reflects the summed amount of contrast agent within the blood vessels and the contrast agent that has moved to the interstitial space by passive diffusion.
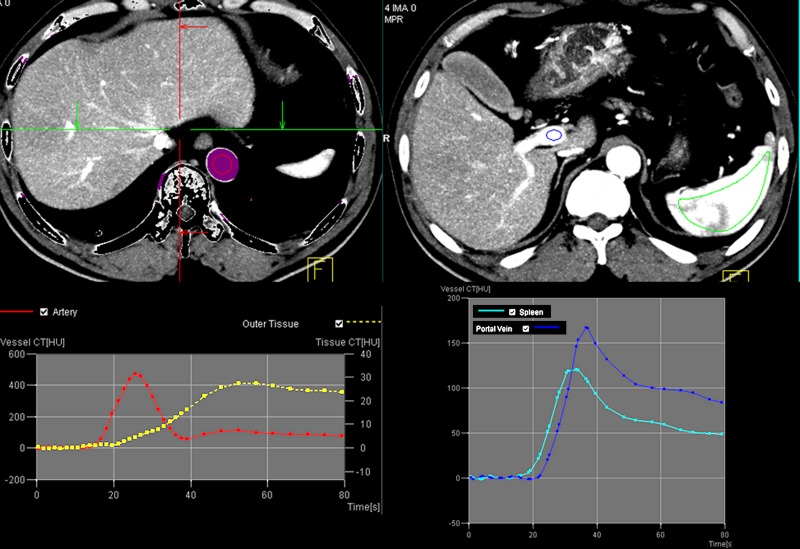
Another requirement for perfusion CT analysis is the selection of a vessel (usually an artery) supplying the tissue of interest to obtain a time-intensity curve (the arterial input function) by placing a region of interest (ROI) into the lumen of the vessel. Unlike in other organs, for which ROI is usually placed only onto the artery, ROIs for hepatic CT perfusion should be placed on both artery and portal vein because the liver has a dual blood supply from the hepatic artery and the portal vein. This unique dual input makes perfusion imaging of the liver challenging. This issue will be discussed in detail below. The time-intensity curve is then compared with the time-intensity curve obtained from the tissue being analyzed. This allows the estimation of intravascular properties, such as blood flow, as well as characteristics of extravascular and extracellular space, such as permeability.
A third requirement of CT perfusion analysis is the application of kinetic models to calculate various perfusion parameters in the tissues being analyzed. For liver CT perfusion, one of the three methods—including model-free maximum slope method, compartment model-based method, and distributed parameter model-based method—or their combination can be used. Figures 1 and 2 and a video clip (Movie E1 [online]) show the workflow of a routine clinical CT perfusion examination of the liver.
Figure 1:

Images from CT perfusion examination of HCC in a 58-year-old man. An unenhanced image and a series of dynamic images following intravenous administration of contrast agent are shown. Numbers in left upper corner represent time from injection of contrast agent in seconds.
Figure 2a:
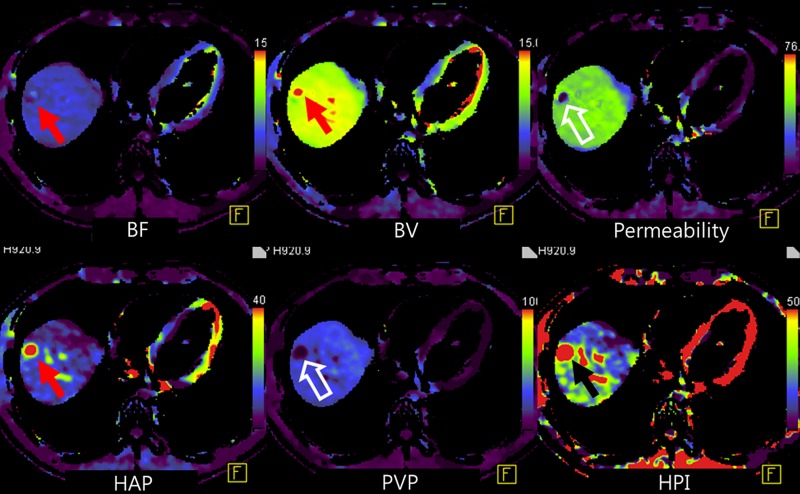
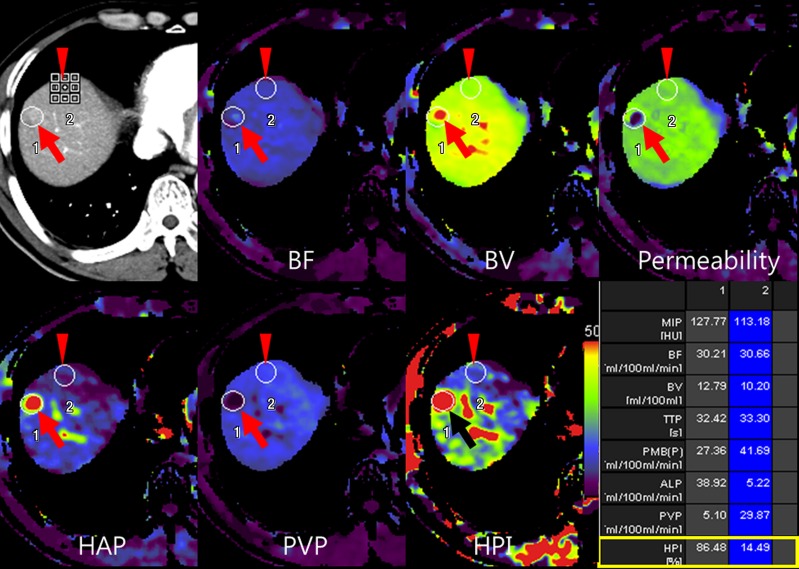
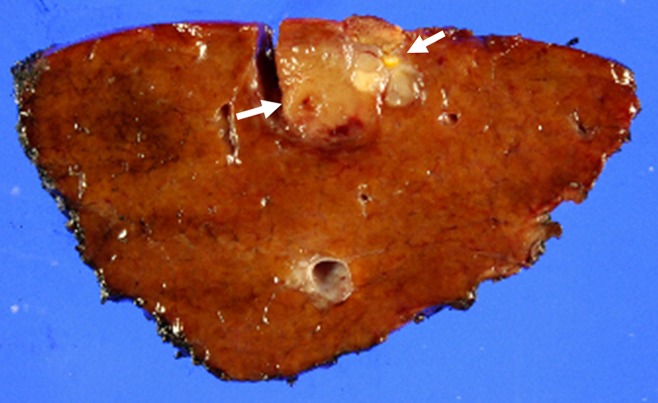
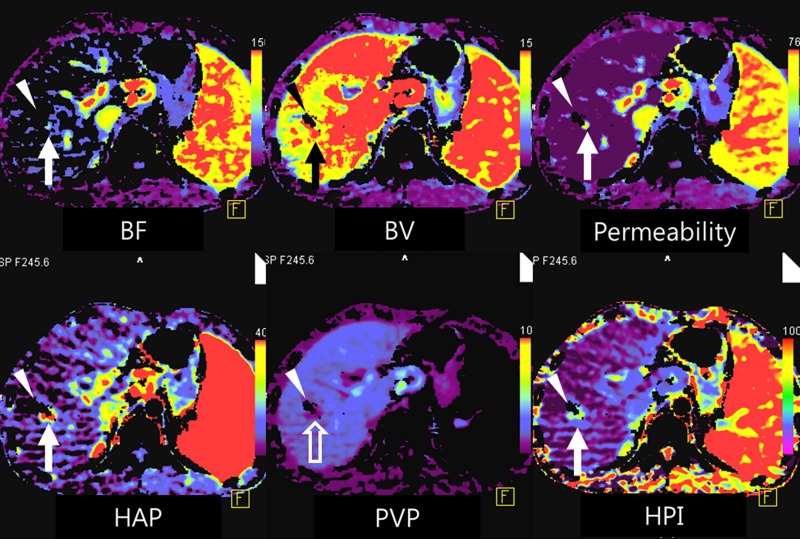
(a) After motion correction, ROI within proximal abdominal aorta is drawn to obtain arterial input function (red circle, top left image). For liver perfusion imaging, a second ROI is drawn within the portal vein to determine portal venous input function addressing unique character of dual blood supply in liver (blue circle, top right image). A third ROI is drawn over spleen, which allows separation of arterial and portal venous blood flow in the liver (green, top right image). Time-intensity curves are generated from abdominal aorta (red), portal vein (blue), and spleen (green). Yellow curve represents time-intensity curve obtained from ROI drawn over normal liver tissue. (b) Perfusion software used in this example automatically generates color-coded perfusion maps of entire liver representing blood flow (BF), blood volume (BV), permeability, hepatic arterial perfusion (HAP), portal venous perfusion (PVP), and hepatic perfusion index (HPI). Note increased blood flow, blood volume, HAP, and HPI (solid arrows) and decreased permeability and PVP (open arrows) in hepatic nodule can be appreciated by visual inspection. (c) After drawing additional ROIs over metastasis (arrow) and normal liver tissue (arrowhead), quantitative perfusion parameters are displayed. In this example, HPI of nodule (ROI 1) significantly increased to 86.48% compared with adjacent normal liver parenchyma (14.49%; ROI 2) (yellow box in lower right image). (d) Wedge resection confirmed 1.5-cm well-differentiated HCC (arrows). (Image courtesy of J. M. Lee.)
Figure 2b:
(a) After motion correction, ROI within proximal abdominal aorta is drawn to obtain arterial input function (red circle, top left image). For liver perfusion imaging, a second ROI is drawn within the portal vein to determine portal venous input function addressing unique character of dual blood supply in liver (blue circle, top right image). A third ROI is drawn over spleen, which allows separation of arterial and portal venous blood flow in the liver (green, top right image). Time-intensity curves are generated from abdominal aorta (red), portal vein (blue), and spleen (green). Yellow curve represents time-intensity curve obtained from ROI drawn over normal liver tissue. (b) Perfusion software used in this example automatically generates color-coded perfusion maps of entire liver representing blood flow (BF), blood volume (BV), permeability, hepatic arterial perfusion (HAP), portal venous perfusion (PVP), and hepatic perfusion index (HPI). Note increased blood flow, blood volume, HAP, and HPI (solid arrows) and decreased permeability and PVP (open arrows) in hepatic nodule can be appreciated by visual inspection. (c) After drawing additional ROIs over metastasis (arrow) and normal liver tissue (arrowhead), quantitative perfusion parameters are displayed. In this example, HPI of nodule (ROI 1) significantly increased to 86.48% compared with adjacent normal liver parenchyma (14.49%; ROI 2) (yellow box in lower right image). (d) Wedge resection confirmed 1.5-cm well-differentiated HCC (arrows). (Image courtesy of J. M. Lee.)
Figure 2c:
(a) After motion correction, ROI within proximal abdominal aorta is drawn to obtain arterial input function (red circle, top left image). For liver perfusion imaging, a second ROI is drawn within the portal vein to determine portal venous input function addressing unique character of dual blood supply in liver (blue circle, top right image). A third ROI is drawn over spleen, which allows separation of arterial and portal venous blood flow in the liver (green, top right image). Time-intensity curves are generated from abdominal aorta (red), portal vein (blue), and spleen (green). Yellow curve represents time-intensity curve obtained from ROI drawn over normal liver tissue. (b) Perfusion software used in this example automatically generates color-coded perfusion maps of entire liver representing blood flow (BF), blood volume (BV), permeability, hepatic arterial perfusion (HAP), portal venous perfusion (PVP), and hepatic perfusion index (HPI). Note increased blood flow, blood volume, HAP, and HPI (solid arrows) and decreased permeability and PVP (open arrows) in hepatic nodule can be appreciated by visual inspection. (c) After drawing additional ROIs over metastasis (arrow) and normal liver tissue (arrowhead), quantitative perfusion parameters are displayed. In this example, HPI of nodule (ROI 1) significantly increased to 86.48% compared with adjacent normal liver parenchyma (14.49%; ROI 2) (yellow box in lower right image). (d) Wedge resection confirmed 1.5-cm well-differentiated HCC (arrows). (Image courtesy of J. M. Lee.)
Figure 2d:
(a) After motion correction, ROI within proximal abdominal aorta is drawn to obtain arterial input function (red circle, top left image). For liver perfusion imaging, a second ROI is drawn within the portal vein to determine portal venous input function addressing unique character of dual blood supply in liver (blue circle, top right image). A third ROI is drawn over spleen, which allows separation of arterial and portal venous blood flow in the liver (green, top right image). Time-intensity curves are generated from abdominal aorta (red), portal vein (blue), and spleen (green). Yellow curve represents time-intensity curve obtained from ROI drawn over normal liver tissue. (b) Perfusion software used in this example automatically generates color-coded perfusion maps of entire liver representing blood flow (BF), blood volume (BV), permeability, hepatic arterial perfusion (HAP), portal venous perfusion (PVP), and hepatic perfusion index (HPI). Note increased blood flow, blood volume, HAP, and HPI (solid arrows) and decreased permeability and PVP (open arrows) in hepatic nodule can be appreciated by visual inspection. (c) After drawing additional ROIs over metastasis (arrow) and normal liver tissue (arrowhead), quantitative perfusion parameters are displayed. In this example, HPI of nodule (ROI 1) significantly increased to 86.48% compared with adjacent normal liver parenchyma (14.49%; ROI 2) (yellow box in lower right image). (d) Wedge resection confirmed 1.5-cm well-differentiated HCC (arrows). (Image courtesy of J. M. Lee.)
CT Acquisition Protocol
The typical CT perfusion protocol consists of a precontrast image acquisition followed by dynamic image acquisitions performed sequentially after intravenous injection of an iodinated CT contrast agent (24,25). The baseline precontrast CT scan can serve as a localizer to select the anatomic scan range for subsequent dynamic scanning. In the case of liver imaging, the scan range should ideally include the main portal vein to allow calculation of time-intensity curves of both the abdominal aorta and the portal vein. Modern CT scanners (>16–detector row scanners with or without volumetric spiral or shuttle scan modes) allow scanning of large volumes of liver tumors or even the entire liver with a dynamic scan range of up to 27 cm, allowing for inclusion of the portal vein in most patients (26,27).
The dynamic image acquisition includes first an intravascular phase study, second a delayed phase study, or both because the tissue enhancement seen following contrast agent administration can be divided into two phases based on its distribution in the intravascular or the extravascular compartment. The first phase study is composed of images acquired during the initial phase of contrast agent administration within 40 to 60 seconds. In this phase, the tissue enhancement is mainly due to the contrast agent within the intravascular space and is determined to a great extent by the blood flow. Later in the second phase, as contrast material passes from the intravascular to the extravascular component across the basement membrane of capillary, enhancement results from contrast agent distribution in both intravascular and extravascular components. Thus, tissue enhancement in this phase largely depends on the blood volume and capillary permeability. The second delayed phase study can be added 2–10 minutes after the first phase study (24,25,28). To accurately obtain time-intensity curves of tissue from the first pass of contrast agent, CT scans are acquired at high temporal resolution (eg, one image per second); for the second delayed phase, a lower temporal resolution may also be sufficient (eg, one image every 10 seconds) (24). Since the radiation dose can be substantially lowered at increased iodine conspicuity by using lower tube voltage (80 or 100 kVp) compared with 120 kVp with conventional CT, a tube voltage of 80 or 100 kVp along with a tube current of 50–120 mAs can be performed for CT perfusion imaging of the liver.
Contrast agents should be administered in small quantities at high flow rates to obtain a short and well-defined bolus. The iodine concentration of contrast materials should not be less than 300 mg iodine per milliliter and the total iodine dose injected should be approximately within the range of 12–18 g. A contrast bolus of 30–60 mL iodinated contrast agent followed by a 50-mL saline flush at an injection rate of 4 mL/sec or greater through an 18–20-gauge antecubital intravenous cannula is recommended. The amount of contrast material should be adjusted according to the concentration of the contrast agent (29). To obtain higher contrast-to-noise ratios, contrast agents with high iodine concentrations (≥ 350 mg iodine per milliliter) are usually recommended. Table E1 (online) summarizes published protocols of data acquisition and contrast agent administration for liver CT perfusion imaging. By virtue of recent advances in CT such as detector technology, contrast agent injection technique, and noise reduction algorithm, there is a trend in acquiring CT perfusion data by means of multidetector CT scanners (≥16-detector configuration), sharp-bolus injection technique using high-concentration of iodine (≥350 mg iodine per milliliter) at high injection rate (≥5 mL/sec), and lower tube voltage (80–100 kVp). These trends in image acquisition and contrast agent injection make liver CT perfusion more reliable and robust for the following reasons: The use of a multidetector CT scanner can be beneficial to assess heterogeneity of tumor angiogenesis by imaging tumor and/or tissue volume with a craniocaudal distance of at least 4 cm; all analysis methods, especially for blood flow measurement calculated by the maximum slope method, can benefit from a rapid injection of contrast agent; and the application of a noise reduction algorithm for low-tube-voltage CT images decreases radiation dose without significant increase in image noise as well as increased attenuation of iodine.
Calculation of CT Perfusion Parameters
After CT data acquisition, various CT perfusion parameters can be calculated by using either a model-free or a model-based approach, with the former being easier to implement. Regardless of the algorithm used, several imaging processing steps should be performed for the calculation of CT perfusion parameters. The imaging processing includes motion correction or image alignment, selection of arterial (and/or portal) input functions, ROI definition, and voxelwise computation of perfusion parameters. The perfusion analysis of the liver is calculated differently from other organs because the liver has a dual blood supply—the hepatic artery and the portal vein. The effective time-intensity curve obtained from liver tissue is therefore a result of an overlay of both the arterial and the portal venous components. The normal liver is predominantly supplied by the low-pressure portal vein (75%) and supplemented by high-pressure hepatic artery (25%). However, several diseases such as liver cirrhosis and primary and metastatic liver tumors lead to global or regional perfusion changes toward increased hepatic arterial blood flow and decreased portal venous flow, although the underlying mechanism is different among the diseases. In liver cirrhosis, deposition of collagen in the space of Disse and subsequent increased resistance to incoming sinusoidal blood flow are known to be responsible for the decreased portal flow, which is counteracted by an increase in hepatic arterial flow through the hepatic arterial buffer response (30). In HCC, however, increased hepatic arterial flow is mainly derived from the appearance of unpaired arteries that are not associated with portal vein branches. In the case of hepatic metastasis, proliferation of sinusoidal endothelial cells which is assisted by vascular endothelial growth factor expression primarily results in increased hepatic arterial flow (31). Therefore, dedicated methods that allow a separation of the arterial and portal venous components are required for liver perfusion image analysis as well as for the diagnosis of various liver diseases.
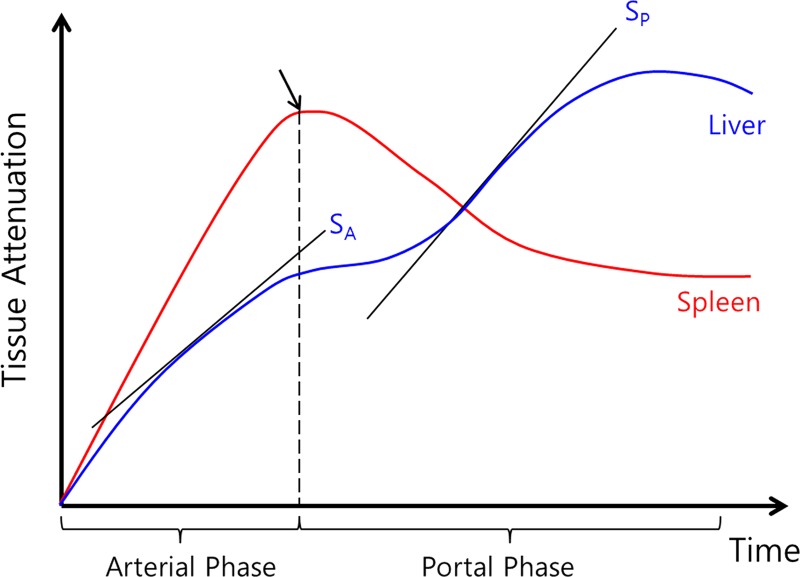
In the model-free maximum slope method, time to peak splenic enhancement (the end of arterial phase and beginning of the portal venous phase of liver perfusion) is used for separating HAP and PVP. The maximal slope of the liver time-intensity curve in both the arterial and portal venous phase is divided by the peak aortic and portal enhancement to calculate arterial and portal liver perfusion (in mL/min/100 mL), respectively (32–36) (Fig 3). Furthermore, the HPI, which is the ratio of the arterial perfusion to the total hepatic perfusion [HPI = arterial perfusion/(arterial + portal perfusion)], can be calculated (32,37). However, this approach does not allow calculating other perfusion parameters, such as blood volume, mean transit time (MTT), or capillary permeability surface product because it takes into account only the first-pass part of the liver enhancement curve before venous outflow. A major limitation of this method is that to satisfy the assumption of no venous outflow, a relatively high injection rate (15–20 mL/sec) must be used, which is not technically feasible in routine clinical practice (38).
Figure 3:
Plot of time-intensity curve of spleen and liver from CT perfusion study using maximum slope method. Diagram shows how maximum slope for arterial perfusion (SA) and portal perfusion (SP) are derived. Time to peak splenic enhancement (arrow) indicates end of arterial phase and beginning of portal venous phase of liver perfusion, which is used for separating arterial and portal venous phases. Maximal slope (SA or SP) of liver time-intensity curve in each phase is divided by peak aortic and portal enhancement to calculate both hepatic arterial and portal perfusion, respectively. (Reprinted, with permission, from reference 32.)
To obtain additional perfusion parameters, several kinetic model-based approaches have been developed (39,40). Table E1 (online) summarizes different kinetic models used for liver CT perfusion imaging in previous studies. Kinetic models applied to the liver vary according to the physiologic and hemodynamic assumptions made, including the following (41):
Single-Input versus Dual-Input Model
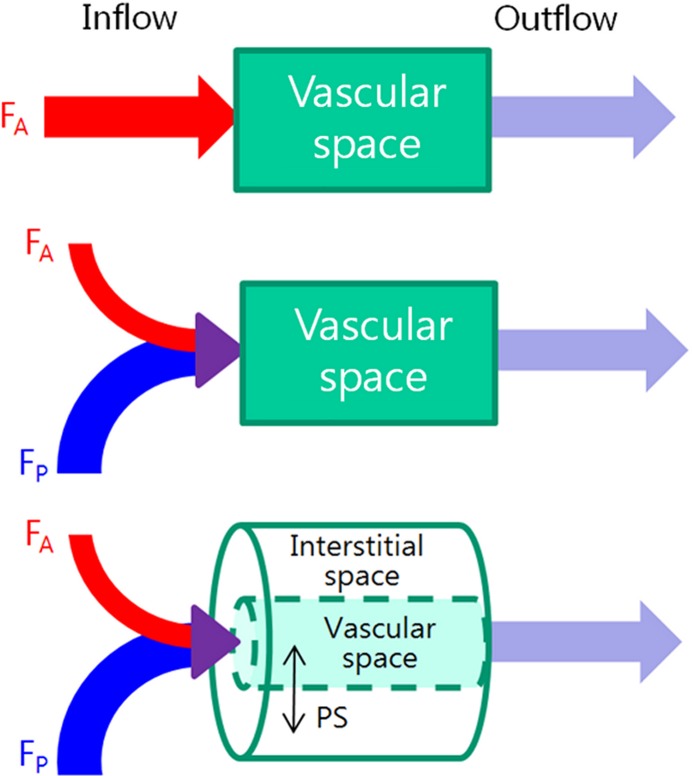
Unlike other organs, the unique dual vascular input to the liver from both the hepatic artery and portal vein makes data analysis of CT perfusion liver imaging challenging. To circumvent this problem, a single-input model for perfusion imaging of hepatic metastases has been proposed with the assumption that the vascular supply of liver metastases is predominantly arterial (Fig 4a). However, this assumption may not hold true for all histologic types of metastases as some liver metastases may have a mixed vascular supply (42,43). Ng et al (44) recently reported that a dual vascular input model (arterial and portal venous) for analysis of CT perfusion data sets improves test-retest reproducibility. Indeed, the separation of hepatic arterial and portal venous blood supply in normal liver tissue and liver lesions is important for characterization and treatment response evaluation of liver nodules (44–46). For instance, when hepatocellular dysplastic nodules evolve to HCC, the intranodular portal supply decreases while the intranodular arterial supply increases in parallel with formation of unpaired arteries. Therefore, separating tumor perfusion into arterial and portal components can potentially help detect early cancerous changes in hepatocellular nodules.
Figure 4a:
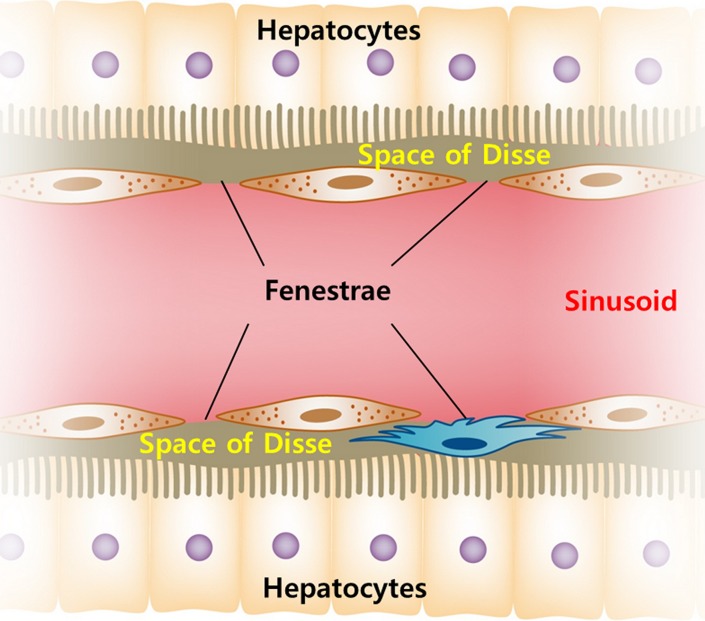
(a) Schematic diagrams show key features of single-input, dual-input, single-compartment, and dual-compartment models. Single-input model (top) assumes vascular supply to hepatic lesions is mainly from hepatic artery, although normal liver is supplied from both hepatic artery and portal vein. Dual-input model (middle) adopts physiologic status of liver which is supplied by low-pressure portal vein (75%) and supplemented by high-pressure hepatic artery (25%). Using single-compartment model (top and middle), only vascular compartment is considered. Dual-compartment model (bottom) assumes dynamic distribution of contrast agent between two compartments. Using a dual-compartment model, kinetic properties such as permeability surface area product (PS) can be quantified. (b) Behavior of normal liver can be approximated by a single-compartment model because the space of Disse (equivalent to interstitial space of other organs) communicates freely with sinusoids through fenestrae. However, in disease states such as liver cirrhosis, deposition of collagen impedes free exchange of contrast material between the two spaces, requiring use of dual-compartment model.
Single-Compartment versus Dual-Compartment Model
Single-compartment models assume that the intravenously administered contrast agent is confined to only one compartment (ie, the vascular space), whereas dual-compartment models assume that there is dynamic distribution of contrast agent between two compartments (ie, the vascular space and the interstitial space). Single-compartment models are computationally simpler and could be applied as an approximation for normal liver. This assumption can be made because the space of Disse (equivalent to extravascular-extracellular space in other organs) communicates freely with the sinusoids through relatively large fenestrae (Fig 4b) (45,46). However, the approximation may not be true in the diseased liver owing to increased resistance to incoming sinusoidal blood flow caused by deposition of collagen or tumor cells in the space of Disse and altered sinusoidal architecture through the loss of fenestrae between sinusoidal endothelial cells (30). Therefore, most CT perfusion studies of the liver have used a dual-compartment model to better reflect the microcirculation of the diseased liver resulting from tumor or cirrhosis, although dual-compartment models are computationally more demanding (43).
Figure 4b:
(a) Schematic diagrams show key features of single-input, dual-input, single-compartment, and dual-compartment models. Single-input model (top) assumes vascular supply to hepatic lesions is mainly from hepatic artery, although normal liver is supplied from both hepatic artery and portal vein. Dual-input model (middle) adopts physiologic status of liver which is supplied by low-pressure portal vein (75%) and supplemented by high-pressure hepatic artery (25%). Using single-compartment model (top and middle), only vascular compartment is considered. Dual-compartment model (bottom) assumes dynamic distribution of contrast agent between two compartments. Using a dual-compartment model, kinetic properties such as permeability surface area product (PS) can be quantified. (b) Behavior of normal liver can be approximated by a single-compartment model because the space of Disse (equivalent to interstitial space of other organs) communicates freely with sinusoids through fenestrae. However, in disease states such as liver cirrhosis, deposition of collagen impedes free exchange of contrast material between the two spaces, requiring use of dual-compartment model.
Dual-Compartment Model versus Distributed Parameter Model
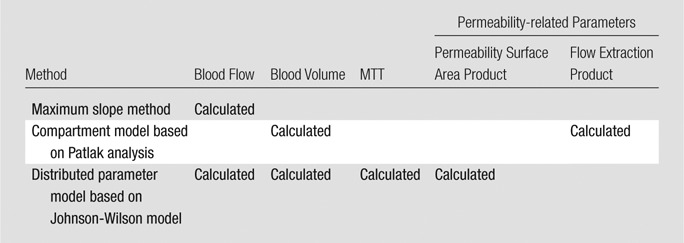
In dual-compartment models, the assumption is made that there is instantaneous mixing or equilibrium of the contrast medium along the entire course of a vessel in which solute concentration is spatially uniform. In other words, there is no concentration difference within the vasculature of tumors. This assumption can be made based on the hypothesis that all vessels have matched vessels with flow of solute in the opposite direction. However, this is not true in tumor because it does not take into account immature tumor vascularity, and this may result in underestimating perfusion values in organs with rapid vascular transit. Furthermore, the separate determination of blood flow and extraction fraction is not possible especially when the exchange of contrast agent is neither diffusion- nor flow-limited (47). One example of a compartment model is the Patlak model (48), in which only blood volume and blood flow extraction product, which is a product of blood flow and contrast agent extraction fraction, can be calculated. In contrast, distributed parameter models take into account a concentration gradient within the vascular space in the time domain. While a simple distributed parameter model was first proposed by Johnson and Wilson (49), Axel (50) has introduced the distributed parameter model for brain perfusion CT imaging. With the use of an analytic solution in the time domain, the distributed parameter model enables the simultaneous determination of four perfusion parameters: blood flow, blood volume, MTT, and permeability (Table). A more detailed overview on different perfusion models can be found in previous publications (24,41,51). Although studies regarding the interchangeability of CT perfusion parameters between the two models are lacking, it has been reported that there is a disagreement of parameter values such as blood volume and permeability between the methods, indicating that the measurement techniques cannot be directly interchanged (52). According to the report by Goh et al (52), the mean difference of permeability and blood volume in 44 colorectal cancers was −3.6 mL/100 mL/min and −3.9 mL/100 mL, respectively. In addition, the coefficient of variation was 37.4% for permeability and 46.5% for blood volume. The authors suggested that the difference in perfusion values between the two analytic methods may be mainly due to the use of different modeling techniques based on different assumptions regarding contrast material distribution. The distributed parameter model takes into account the varying intravascular concentration gradients from the arterial inlet to the venous outlet within the capillaries, while the compartment model assumes that the compartments are well mixed without any concentration gradient and that there is no backward flux from the extravascular extracellular compartment to the intravascular compartment. These conceptual and mathematic differences may have contributed to the disagreement (52).
Comparison of Different Analytic Methods Regarding the Parameters Derived
CT Perfusion Parameters
Single-compartment models allow for estimates of blood flow, blood volume, and MTT. Blood flow refers to the volume flow rate of blood through the vasculature (expressed as mL/min/100 mL). Blood volume is the volume of blood within the vasculature that is actually flowing (expressed in units of mL/100 mL). MTT is average time it takes for blood to traverse between the arterial inflow and the venous outflow, measured in seconds. Generally, dual-compartment models are necessary to extract parameters that describe the interstitial space, that is, permeability surface area product and flow extraction product. Permeability surface area product is the product of permeability and the total surface area of capillary endothelium in a unit mass of tissue or tumor (measured as mL/min/100 mL). Flow extraction product is the product of blood flow and the extraction fraction, which is the fraction of contrast agent arriving at the tissue that leaks into the extravascular space in a single passage through the vasculature (measured as mL/min/100 mL). These parameters cannot be derived by using a single-compartment model. The Table presents the comparative results of different analytic methods regarding the parameters derived.
The relationship between CT perfusion parameters and the pathologic features of tumor angiogenesis is complex (29). Blood volume and blood flow are known to correlate with microvessel density within the tumor. Between them, blood volume tends to more closely reflect the density of tumor microvessels than blood flow, as blood flow in the absence of an autoregulatory mechanism (which is underdeveloped in tumor vessels) can be easily affected by cardiac output, while blood volume is not. Permeability-related values such as permeability surface area product and flow extraction product are surrogates for vascular leakiness directly related to poorly formed vascular basement membrane. Decreased MTT usually reflects the presence of arteriovenous shunts, which are frequently demonstrated in the tumor.
Applications in Clinical Oncologic Imaging of the Liver
Since Miles et al (32) first described the potential usefulness of liver CT perfusion in 1993, there has been a gradual increase in clinical usage of CT perfusion imaging in liver tumors. Published clinical applications of liver CT perfusion include early detection of tumors, assessing disease prognosis based on tumor vascularity, monitoring therapeutic effects of various treatment regimens including antiangiogenic drugs, and early identification of tumor recurrence after treatment (Tables E2 and E3 [online]).
General Introduction: Alteration of CT Perfusion Parameters in Liver Tumors
Initial reports focused on how CT perfusion parameters change in liver tumors. Early work by Miles et al (36,37,53) and Blomley et al (33) on CT perfusion imaging of liver metastases showed increased arterial perfusion in liver metastases, which was confirmed by other investigators, regardless of the modality (CT and MR imaging), pharmacokinetic model, or whether the subjects studied were human or animals. Leggett et al (35) and Reiner et al (54) also reported significantly increased HAP and decreased PVP in patients with metastatic diseases mainly from colorectal cancer when compared with adjacent normal parenchyma (35,54). Guyennon et al (55) demonstrated that metastatic neuroendocrine tumor showed significantly higher HPI, blood flow, blood volume, and permeability surface area product, and significantly shorter MTT, than adjacent parenchyma in 16 patients. Lefort et al (56) reported similar results in 16 patients with biopsy-proven liver metastases from neuroendocrine tumor. They also showed that blood flow and MTT values obtained by means of CT perfusion were correlated with those obtained by means of contrast-enhanced US (correlation coefficient = 0.58 and 0.52, respectively) (56). They stated that the use of destruction-replenishment sequence in contrast-enhanced US, which is different from conventional first-pass study and the use of different assumptions regarding contrast agent distribution (instant mixing without a concentration gradient for contrast-enhanced US and varying intravascular concentration gradients from the arterial inlet to the venous outlet for CT) may have contributed to the significant but weak correlation between the two modalities that they reported (56).
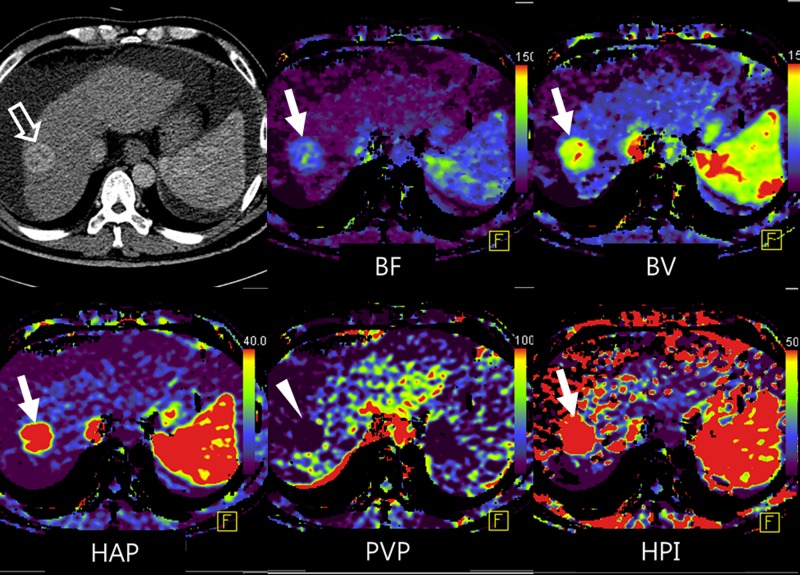
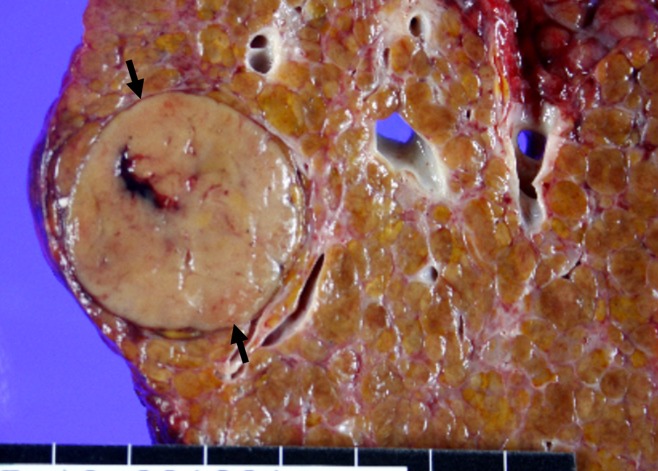
Although there is a wide range of overlap in blood supply patterns among various types of hepatocellular nodules such as dysplastic nodules, early HCC, and overt HCC, it is well known that when hepatocellular nodules evolve into HCC, the intranodular portal supply decreases while the arterial supply increases in parallel with formation of unpaired arteries (57). Ippolito et al demonstrated significantly increased HAP and HPI with significantly decreased PVP in HCCs compared with adjacent normal parenchyma by using a maximum slope model (58–60) (Figs 2, 5). These observations were confirmed by other investigators using MR perfusion with a dual-input, single-compartment model (61). HCCs show higher perfusion values compared with the adjacent normal liver tissue, reflecting their hypervascular nature (58,62,63). More specifically, Sahani et al (62) and Zhu et al (63) reported that HCC demonstrated higher blood flow, blood volume, and permeability surface area product and shorter MTT than the background liver parenchyma on CT perfusion images (Figs 2, 5). In addition to these parameters, HCCs also demonstrated a higher HAP and HPI as they specifically reflect the growth of new unpaired arterial blood vessels and a blood supply most exclusively derived from arterial circulation in HCC nodules (58–60) (Figs 2, 5). Although HAP and HPI can increase in both metastasis and HCC compared with adjacent normal parenchyma, total blood flow and HAP are much higher in HCC than in hypovascular metastases (64).
Figure 5a:
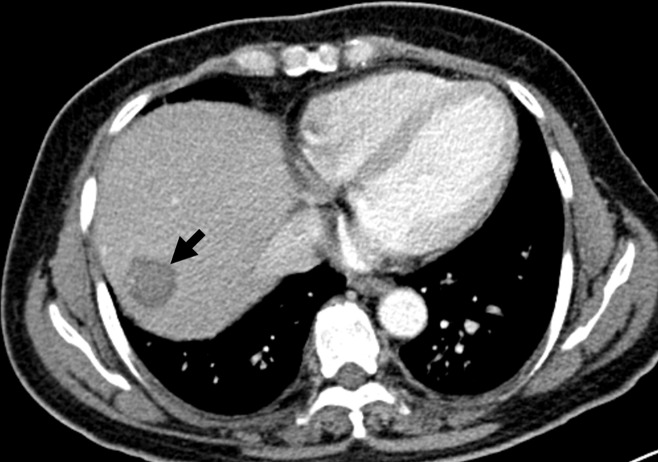
Representative example of HCC shows typical findings at perfusion CT. (a) Arterial phase image (top left) shows 3.2-cm hyperenhancing mass (open arrow) in segment VIII of liver. Color-coded CT perfusion maps show increased blood flow (BF) (top middle), blood volume (BV) (top right), HAP (bottom left), and HPI (bottom right) of tumor (solid arrows) compared with adjacent normal hepatic parenchyma. Note marked decrease in PVP of tumor (arrowhead, bottom middle). (b) Photograph of gross specimen after liver transplantation confirms encapsulated, well-differentiated HCC (arrows). (Image courtesy of J. M. Lee.)
Figure 5b:
Representative example of HCC shows typical findings at perfusion CT. (a) Arterial phase image (top left) shows 3.2-cm hyperenhancing mass (open arrow) in segment VIII of liver. Color-coded CT perfusion maps show increased blood flow (BF) (top middle), blood volume (BV) (top right), HAP (bottom left), and HPI (bottom right) of tumor (solid arrows) compared with adjacent normal hepatic parenchyma. Note marked decrease in PVP of tumor (arrowhead, bottom middle). (b) Photograph of gross specimen after liver transplantation confirms encapsulated, well-differentiated HCC (arrows). (Image courtesy of J. M. Lee.)
Early Detection of Liver Tumors
Early cancer detection is the key for successful treatment and a favorable prognosis in patients with liver tumors. For example, the 4-year survival rate in patients with cirrhosis and HCC who met liver transplantation criteria was 85% among patients who underwent liver transplantation (65), whereas the prognosis of patients not eligible for transplantation owing to advanced, symptomatic HCC was dismal, with a 5-year survival rate of less than 5% (66). This discrepancy suggests that earlier detection of HCC is critical for better patient outcome. Similarly, exclusion of hepatic micrometastatic disease could obviate unnecessary, potentially toxic chemotherapy in patients without metastases. Current routine CT and MR imaging, however, are not sensitive enough in the detection of micrometastases due to the lack of apparent morphologic changes.
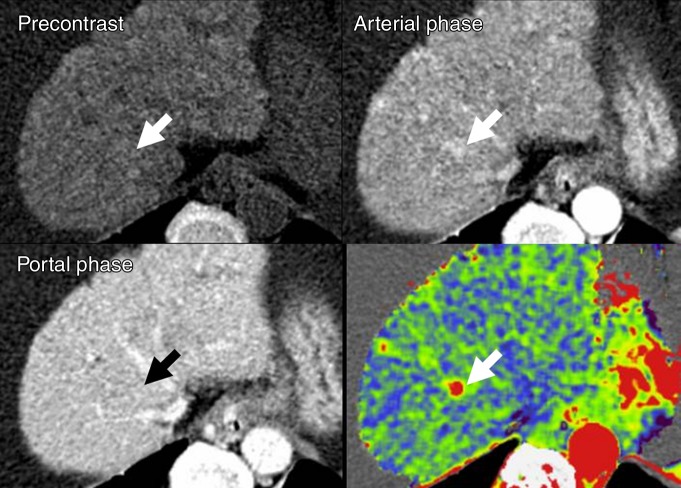
Several studies have shown that earlier detection of liver metastases could be accomplished by means of CT perfusion imaging, since morphologically occult metastases may cause detectable quantitative perfusion changes of the liver parenchyma. This hypothesis was proven on both a global basis with Doppler US and a regional basis with perfusion CT. Leen et al (67) showed that the 5-year survival of patients after curative surgery for colorectal cancer was 91% in patients with normal hepatic Doppler perfusion index (defined as the ratio of the hepatic arterial to the sum of hepatic arterial blood flow and portal venous blood flow) and 29% in patients with abnormal hepatic Doppler perfusion index (≥ 0.3). Hepatic arterial and portal venous blood flows were calculated from the product of velocity averaged over time and cross-sectional area of the vessel, which were measured at common hepatic artery and intrahepatic portal vein, respectively. By using CT perfusion, Cuenod et al (45) found a decrease in total liver perfusion (sum of HAP and PVP), mainly due to a decrease in portal perfusion and an increase in MTT using the distributed parameter model in rats with both occult and overt liver metastases from colorectal carcinoma. However, changes in perfusion parameters were smaller in rats with occult metastases than in those with overt metastases. Tsushima et al (68) and Shi et al (69) also demonstrated increased HAP and HPI with decrease of PVP in apparently normal liver tissue with occult metastases on CT perfusion images, when compared with liver in patients without metastases and in control rats, respectively. These results suggest that CT perfusion may be used to predict the presence of micrometastases in an otherwise morphologically normal-appearing liver, potentially altering management of patients. In contrast, CT perfusion imaging has not been evaluated for earlier detection of HCC in a surveillance program. This is likely due to the high radiation dose associated with repetitive CT perfusion scans and the relatively high costs compared with currently recommended US screening of increased-risk patients (30). An interesting alternative to perfusion CT imaging for earlier HCC detection was proposed by Kim et al (70), introducing the concept of whole-liver quantitative color mapping CT displays based on data sets from routine triple-phase liver CT examinations and discussed in the subsection addressing the issue of radiation dose. In their study the arterial enhancement fraction (AEF), a value that is similar to HPI, was calculated and the per-lesion sensitivity for detecting HCC significantly increased when adding color maps of AEF (88.8%) compared with standard image analysis (71.7%) without increasing radiation exposure (70) (Fig 6).
Figure 6:
Whole-liver quantitative color mapping CT improves detection of a small, 1.3-cm HCC (arrow) in segment VIII, missed at triple-phase CT on unenhanced (top left), arterial (top right), and portal venous phase (bottom left) images. Note several hypervascular foci without clear associated washout on portal venous phase image. In contrast, on color map image of AEF (similar to HPI on CT perfusion images) (bottom right) obtained from triple-phase CT, HCC is well depicted with increased AEF. HCC was pathologically proven after liver transplantation (not shown). (Images courtesy of K. W. Kim and J. M. Lee.)
Although HCC usually occurs in the background of liver cirrhosis in which perfusion changes are similar to those in HCC, the impact of cirrhosis in detecting HCCs on perfusion CT images has not yet been investigated.
Assessment of Prognosis Based on Tumor Perfusion
One of the key elements of tumor physiology that influences the aggressiveness of cancer and its response to treatment is tumor neoangiogenesis; the presence of high vascularity usually suggests aggressive behavior and is associated with a worse outcome (71). Tumor angiogenesis is defined as the process of developing new capillary blood vessels, resulting in tumor vascularization (72). This process, which is integral to the growth and spread of tumors, consists of several dynamic processes, mediated by a host of growth factors, such as vascular endothelial growth factor, fibroblast growth factor, and platelet-derived endothelial cell growth factor (72,73). CT perfusion may reflect tumor aggressiveness and therefore may allow for the prediction of prognosis based on tumor vascularity because it can provide indirect information regarding tumor neoangiogenesis. Indeed, reports relating pathologic assessments of tumor angiogenesis to CT perfusion parameters have supported the hypothesis that peak tumor enhancement and blood volume correlate most closely with the expression of vascular endothelial growth factor and microvessel density in various tumors (18,74–77).
The meaning of response prediction is predicting the likelihood of treatment achieving the desired outcome. Therefore, predicting treatment response will depend on the treatment intent. Most commonly, the intent is a prolongation of survival and yet there is currently little evidence that perfusion measurements correlate with survival. Change in perfusion before a change in size is only useful where a change in tumor size is the treatment intent (eg, neoadjuvant therapy). Reduction in tumor size has not been shown to be a surrogate for survival. In a clinical context, therefore, identifying a change in perfusion early in the treatment period would only be useful if there is a clearly identifiable change in the management of the patient. However, investigation regarding this issue is lacking until now.
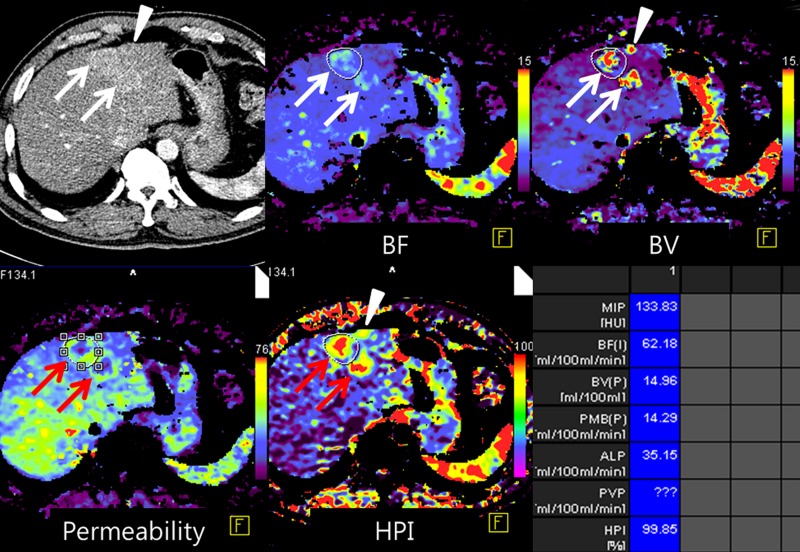
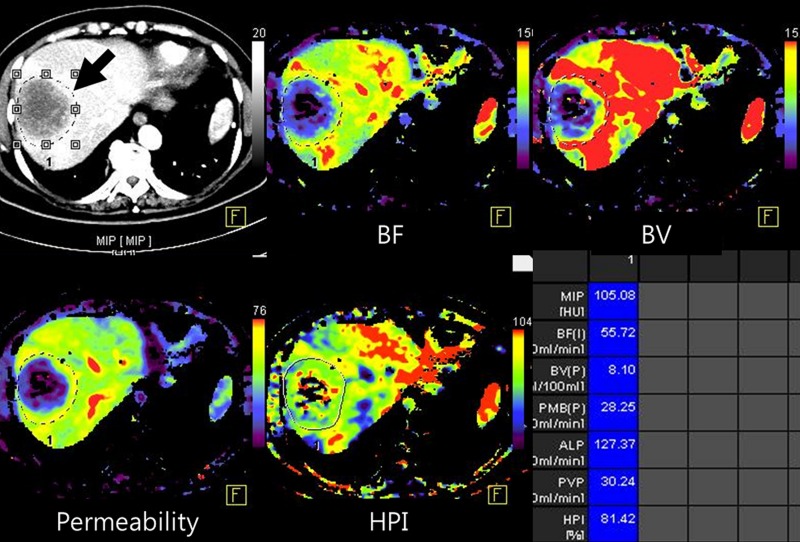
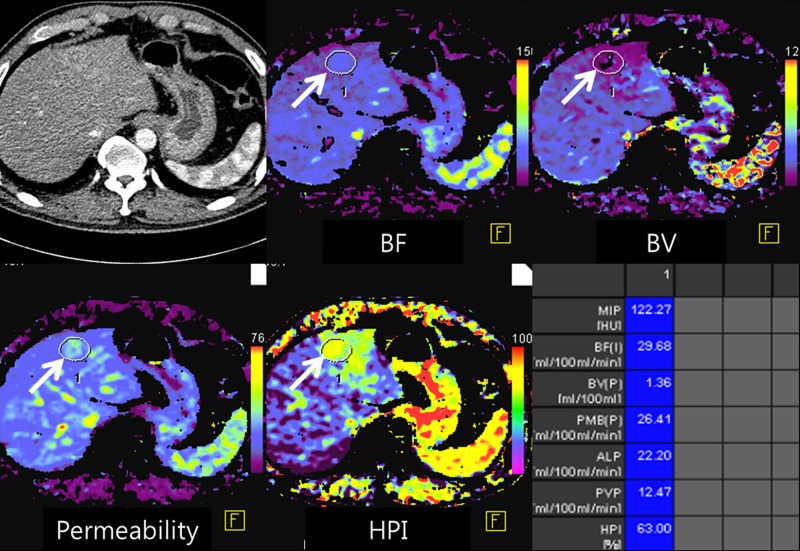
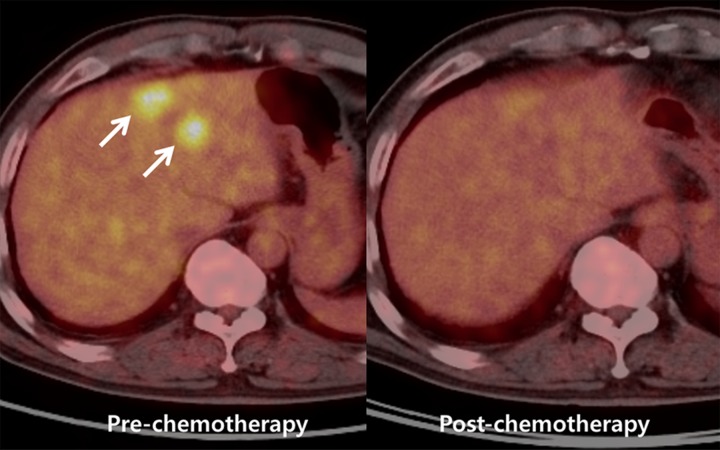
There are several reports to suggest that CT perfusion parameters of the liver are related to prognosis in patients with liver metastases (12,35,36,78). For example, in a study by Miles et al (78), the relationship between HPI and survival was evaluated in a series of 80 patients with colorectal cancer. Patients were stratified into three groups on the basis of HPI on perfusion CT images and the presence of visible metastasis on conventional CT images (group I: no visible metastases at CT and HPI < 0.35; group II: no visible metastases at CT and HPI ≥ 0.35; and group III: patients with overt liver metastases at CT). The hazard ratios were 13.5 (95% confidence interval: 1.6, 111) between groups I and II and 3.5 (95% confidence interval: 1.5, 8.5) between groups II and III. Stratification of survival risk by means of perfusion CT appeared to be superior to the Dukes classification, which is a staging system for colorectal cancer based on the depth of tumor invasion and lymph node involvement. Miles et al concluded that if the HPI of normal-looking liver parenchyma was greater than 0.35, patients may eventually develop overt metastases, leading to poor survival (78). Leggett et al (35) suggested that decreased PVP of less than 0.25 mL/min/mL may indicate the progression of liver metastasis in a study of 27 patients with colorectal cancer. However, there are conflicting results in the literature. In a series of 13 patients with hepatic metastases from a range of primary tumors, Miles et al (36) found that there were significant positive correlations between the survival of the patient and HAP obtained at both the lesion core (correlation coefficient = 0.69) and the rim (correlation coefficient = 0.78) of metastasis. However, there was no significant correlation between survival and PVP of metastases. Recently, Kim et al (12) showed the potential of CT perfusion for early prediction of prognosis after chemotherapy in 17 patients with liver metastasis from colon cancer by demonstrating a significantly greater reduction rate of blood flow and flow extraction fraction in responders versus nonresponders after only one cycle of cytotoxic chemotherapy (Figs 7, 8). They also showed a positive and significant correlation between CT perfusion parameters and volume-based PET parameters (Fig 7). Anzidei et al (79) also reported that lesions responding positively to chemotherapy showed significantly higher permeability surface area product at baseline CT perfusion than nonresponding lesions in 18 patients with colorectal liver metastases.
Figure 7a:
Images show perfusion CT improving detection of liver metastases from rectal cancer and identifying early treatment response after chemotherapy. (a) On arterial phase CT image (top left), two ill-defined, enhancing lesions (arrows) are in the left hepatic lobe. On color-coded CT perfusion maps, both metastases (arrows) show increased blood flow (BF) (top middle), blood volume (BV) (top right), permeability (bottom right), and HPI (bottom right) compared with adjacent normal hepatic parenchyma. Note, additional tiny metastatic focus (arrowhead) is clearly visualized on perfusion maps with increased blood volume and HPI but not well visualized on arterial phase CT image (top left). (b) CT perfusion images obtained after one cycle of chemotherapy show marked decrease in blood flow, blood volume, and HPI of the tumor (arrow). (c) PET/CT image before chemotherapy shows strong FDG uptake in both dominant metastases (arrows). Posttreatment PET/CT image (one cycle) also showed marked decrease of FDG uptake, indicating good treatment response.
Figure 8a:
Images show perfusion CT enabling prediction of early treatment response after chemotherapy for liver metastases from sigmoid colon cancer. (a) Baseline CT perfusion image of liver before chemotherapy shows large, 6.2-cm low-attenuating mass (arrow) at dome of liver. Liver metastases show decreased blood flow (BF) (top middle), blood volume (BV) (top right), and permeability (bottom left) and increased HPI (bottom middle) compared with adjacent normal parenchyma. (b) On perfusion CT scan after one cycle cytotoxic chemotherapy with capecitabine and oxaloplatin, tumor does not show change in size or attenuation (top left), indicating no response to chemotherapy based on RECIST. However, substantial decrease in perfusion parameters suggests tumor response. (c) Three cycles of chemotherapy later, CT findings confirmed partial response based on RECIST with a marked decrease (6.2 to 2.9 cm) in tumor size. MIP = maximum intensity projection.
Figure 7b:
Images show perfusion CT improving detection of liver metastases from rectal cancer and identifying early treatment response after chemotherapy. (a) On arterial phase CT image (top left), two ill-defined, enhancing lesions (arrows) are in the left hepatic lobe. On color-coded CT perfusion maps, both metastases (arrows) show increased blood flow (BF) (top middle), blood volume (BV) (top right), permeability (bottom right), and HPI (bottom right) compared with adjacent normal hepatic parenchyma. Note, additional tiny metastatic focus (arrowhead) is clearly visualized on perfusion maps with increased blood volume and HPI but not well visualized on arterial phase CT image (top left). (b) CT perfusion images obtained after one cycle of chemotherapy show marked decrease in blood flow, blood volume, and HPI of the tumor (arrow). (c) PET/CT image before chemotherapy shows strong FDG uptake in both dominant metastases (arrows). Posttreatment PET/CT image (one cycle) also showed marked decrease of FDG uptake, indicating good treatment response.
Figure 7c:
Images show perfusion CT improving detection of liver metastases from rectal cancer and identifying early treatment response after chemotherapy. (a) On arterial phase CT image (top left), two ill-defined, enhancing lesions (arrows) are in the left hepatic lobe. On color-coded CT perfusion maps, both metastases (arrows) show increased blood flow (BF) (top middle), blood volume (BV) (top right), permeability (bottom right), and HPI (bottom right) compared with adjacent normal hepatic parenchyma. Note, additional tiny metastatic focus (arrowhead) is clearly visualized on perfusion maps with increased blood volume and HPI but not well visualized on arterial phase CT image (top left). (b) CT perfusion images obtained after one cycle of chemotherapy show marked decrease in blood flow, blood volume, and HPI of the tumor (arrow). (c) PET/CT image before chemotherapy shows strong FDG uptake in both dominant metastases (arrows). Posttreatment PET/CT image (one cycle) also showed marked decrease of FDG uptake, indicating good treatment response.
Figure 8b:
Images show perfusion CT enabling prediction of early treatment response after chemotherapy for liver metastases from sigmoid colon cancer. (a) Baseline CT perfusion image of liver before chemotherapy shows large, 6.2-cm low-attenuating mass (arrow) at dome of liver. Liver metastases show decreased blood flow (BF) (top middle), blood volume (BV) (top right), and permeability (bottom left) and increased HPI (bottom middle) compared with adjacent normal parenchyma. (b) On perfusion CT scan after one cycle cytotoxic chemotherapy with capecitabine and oxaloplatin, tumor does not show change in size or attenuation (top left), indicating no response to chemotherapy based on RECIST. However, substantial decrease in perfusion parameters suggests tumor response. (c) Three cycles of chemotherapy later, CT findings confirmed partial response based on RECIST with a marked decrease (6.2 to 2.9 cm) in tumor size. MIP = maximum intensity projection.
Figure 8c:
Images show perfusion CT enabling prediction of early treatment response after chemotherapy for liver metastases from sigmoid colon cancer. (a) Baseline CT perfusion image of liver before chemotherapy shows large, 6.2-cm low-attenuating mass (arrow) at dome of liver. Liver metastases show decreased blood flow (BF) (top middle), blood volume (BV) (top right), and permeability (bottom left) and increased HPI (bottom middle) compared with adjacent normal parenchyma. (b) On perfusion CT scan after one cycle cytotoxic chemotherapy with capecitabine and oxaloplatin, tumor does not show change in size or attenuation (top left), indicating no response to chemotherapy based on RECIST. However, substantial decrease in perfusion parameters suggests tumor response. (c) Three cycles of chemotherapy later, CT findings confirmed partial response based on RECIST with a marked decrease (6.2 to 2.9 cm) in tumor size. MIP = maximum intensity projection.
For HCC, tumors with poor prognosis tended to show higher baseline blood flow and blood volume and shorter baseline MTT, suggesting higher vascularity along with extensive intratumoral arteriovenous shunts. For example, according to a recent report by Jiang et al (80), patients with progression-free survival longer than 6 months had significantly longer baseline MTT (mean ± standard deviation, 8.27 seconds ± 2.24) than those with progression-free survival of 6 months or less (5.64 seconds ± 2.43), in 23 HCC patients who received bevacizumab in combination with gemcitabine and oxaliplatin, while baseline tumor size and attenuation did not correlate with clinical outcome. Petralia et al (81) reported that baseline blood flow and blood volume were significantly higher in 12 HCC patients with progressive disease than in six patients with stable disease after thalidomide treatment. Zhu et al (63) also demonstrated that patients with progressive HCCs after treatment had shorter baseline MTT values than those with stable disease or partial response. However, there are conflicting results in the literature correlating histologic grade of HCCs with CT perfusion parameters. In a report by Sahani et al (62), well-differentiated HCC showed a higher blood flow, blood volume, and permeability and a shorter MTT than moderately and poorly differentiated HCC at CT perfusion. In contrast, Ippolito et al (60) found no significant correlation between CT perfusion parameters and HCC grade. Although the researchers in the former study speculated that a larger tumor diameter (mean, 9 cm) and the presence of tumor necrosis in the high-grade tumor group may account for lower blood flow and blood volume, further studies with larger study populations are warranted to investigate the relationship between CT perfusion parameters and histologic grade of HCC.
However, because most previous studies investigating the prognostic or predictive role of CT perfusion parameters have used statistical associations based on retrospectively acquired data and there has been little prospective validation for imaging biomarkers, there is little clinical implementation of these “prediction tools” to actually guide patient management. Therefore, this issue should be addressed and proved with prospective clinical trials in the future.
Monitoring Therapeutic Effects
With the emergence of novel molecular targeted agents such as antiangiogenic drugs, imaging techniques that directly assess tumor vascular supply have shown promising results in terms of monitoring of therapeutic response. Antiangiogenic therapy inhibits vascular formation, thus inhibiting tumor progression indirectly. Therefore, despite effective treatment of antiangiogenic drugs, changes in tumor size can be minimal and the therapeutic antiangiogenic treatment results based on imaging can be underestimated due to cytostatic effect which suppresses growth and multiplication of cancer cells, rather than cytotoxic effect that destroys cancer cells. Indeed, early clinical trials have indicated that standard response criteria that use tumor size or other structural criteria may not be suitable for monitoring the effects of these drugs (80). Existing imaging techniques such as fluorodeoxyglucose (FDG) PET, that are not directed at the vascular system, also may be inappropriate because antiangiogenic drugs may induce uncoupling of tumor perfusion and other aspects of tumor physiology such as glucose metabolism (82,83) and because FDG PET shows low (55%–61%) sensitivity in the diagnosis of HCC (84). Treatment monitoring after local-regional therapy such as transarterial chemoembolization (TACE) for HCC is sometimes challenging because tumor necrosis may not always be paralleled by a reduction in tumor size. The increased use of local-regional therapies in the treatment of HCC has raised the issue of the best modality to measure treatment response (85). CT perfusion can be a promising technique to monitor treatment response for molecular targeted agents and for local-regional therapies since it allows quantification of hemodynamic changes within the tumor.
Several studies have shown that CT perfusion imaging allows posttreatment assessment of differences in tumor perfusion before overt changes in tumor size (Table E3 [online]). Although there were some discrepancies among studies, there was a trend toward showing a decrease in blood flow, blood volume, HPI, and permeability, as well as an increase of MTT after treatment regardless of the imaging modality used (CT vs MR imaging), the therapeutic agent administered (standard chemotherapeutics vs antiangiogenic agents), type of liver tumors imaged (primary vs metastatic liver lesions), and the subject studied (human vs different animal models) (Figs 7, 8). For instance, Ren et al (86) recently showed the usefulness of CT perfusion for early response assessment following anticancer treatment in 100 mice with human colon cancer xenografts. Blood flow, blood volume, and flow extraction product of the tumors were significantly reduced as early as 1 day after treatment with either an antiangiogenic agent (bevacizumab) or a single radiation treatment. Those changes in perfusion parameters occurred significantly faster than changes in the tumor volume. These data suggest that CT perfusion parameters can be used as predictive biomarkers for earlier posttreatment response assessment before overt changes in tumor size occur.
In patients, Xiong et al (87) and Ng et al (88) showed a significant decrease in blood flow and/or blood volume after one cycle of the antiangiogenic drug SU6668 in six patients with liver metastases and as early as 2 days following antiangiogenic treatment with bevacizumab in 24 patients with metastatic carcinoid tumor, respectively. Kim et al (12) also showed a significant reduction of blood flow and flow extraction product in nine patients who received only one cycle of cytotoxic chemotherapy for hepatic metastasis from colorectal cancer (Figs 7, 8). Following local-regional therapy, Kan et al (89) demonstrated a significant decrease in blood flow, blood volume, and permeability, while showing a significant increase in MTT immediately and 2 days after TACE in 14 rats with liver metastasis (from murine mammary cancer cells). Changes in CT perfusion parameters tended to be higher in rats treated with a higher dose of embolic material (1 mg vs 3 mg of 50-μm polyvinyl alcohol particle) (89). A significant decrease in blood flow, blood volume, and permeability, and a significant increase in MTT were also observed 1 week after TACE in another study with 14 rabbit VX2 liver tumors (90). In patients with HCC, Yang et al (91) demonstrated a significant decrease in HAP and HPI in HCCs at 4 weeks after TACE.
Although these pilot studies are promising and show a potential role of perfusion CT for more accurate monitoring treatment response compared with traditional morphologic imaging, additional studies are warranted to assess the value of CT perfusion as a true surrogate marker for predicting long-term treatment response in patients.
Diagnosing Tumor Recurrence
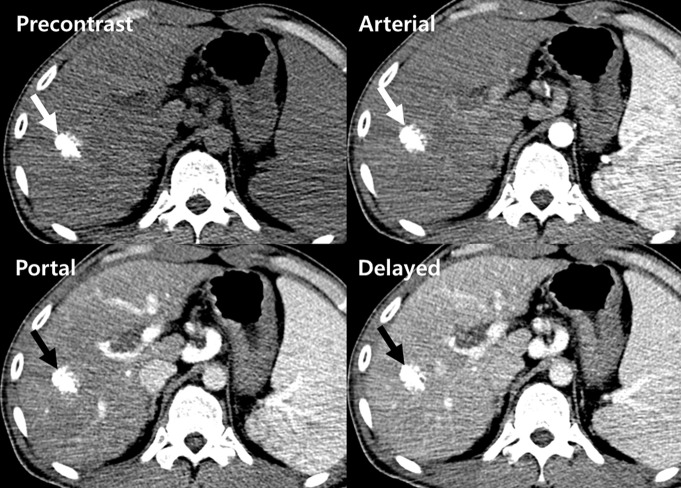
CT perfusion imaging has been used for early identification of tumor recurrence after various imaging-guided therapies of liver tumors including both primary and metastatic tumors (Table E3 [online]). Mahnken et al (92) reported the usefulness of quantitative volumetric AEF color mapping created from conventional triple-phase CT scanning for the early detection of recurrent tumor after radiofrequency (RF) ablation for liver metastasis. The authors observed that AEF values were significantly higher for parenchyma (62% ± 23) that developed additional metastases after RF ablation when compared with liver parenchyma (39% ± 20) that did not develop metastases during follow-up in 53 patients treated with RF ablation for liver metastases. Furthermore, they concluded that a locally increased AEF indicated an elevated risk for future tumor relapse in those areas (92). In addition, it was shown that marginal lesions with high HAP (>50 mL/min/100 g) and low hepatic portal perfusion (<10 mL/min/100 g) represented recurrent tumor tissue after RF ablation for liver metastases in 11 patients with an increased risk for local RF ablation–site tumor recurrence (93). Furthermore, areas of recurrent tumors on CT perfusion images were well matched with hot spots on PET/CT images. Ippolito et al (94) also reported that residual HCC within TACE-treated areas showed significantly higher blood flow, HAP, and HPI than compactly lipiodolized area or adjacent cirrhotic parenchyma (Fig 9). However, the role of perfusion CT in predicting recurrence after local-regional treatment is uncertain until now. Indeed, Choi et al (90) reported that for the areas where the recurrence eventually occurred at 4 weeks after TACE, CT perfusion parameters obtained 1 week after TACE did not help predict future recurrence in their study using 14 rabbits with VX2 tumor model. Early identification of tumor recurrence around RF defect or lipiodolized nodule is sometimes challenging with conventional CT because tumor recurrence around RF defect can be confused with reactive hyperemia around RF-ablated area and because HCC recurrence around lipiodolized nodule can be obscured by beam-hardening artifacts that occurred due to high attenuation of accumulated lipiodol (Fig 9). Perfusion CT may play an important role in these aspects, being noteworthy in patient management. However, further studies with larger study populations are again needed to assess the role of CT perfusion in diagnosing tumor recurrence early.
Figure 9a:
Images show perfusion CT facilitating diagnosis of local recurrence after TACE for HCC. (a) On precontrast (top left), arterial (top right), portal venous (bottom left), and delayed (bottom right) phase perfusion CT images 30 days after treatment, a densely lipiodol-laden nodule (arrow) is in right lobe of liver. No definite enhancing viable tumor focus is seen on conventional CT scans. (b) Color maps of perfusion CT, however, show area (arrows) of increased blood flow (BF) (top left), blood volume (BV) (top middle), permeability (top right), HAP (bottom left), and HPI (bottom right) and decreased PVP (bottom middle), indicating recurred/residual HCC at leading edge of tumor (arrowheads). (c) Arterial phase image (left) obtained 1 month after perfusion CT shows increased size of enhancing viable tumor (arrow) around faint lipiodol residuals (arrowhead), with washout on portal venous phase image (right), confirming recurrent/residual disease.
Figure 9b:
Images show perfusion CT facilitating diagnosis of local recurrence after TACE for HCC. (a) On precontrast (top left), arterial (top right), portal venous (bottom left), and delayed (bottom right) phase perfusion CT images 30 days after treatment, a densely lipiodol-laden nodule (arrow) is in right lobe of liver. No definite enhancing viable tumor focus is seen on conventional CT scans. (b) Color maps of perfusion CT, however, show area (arrows) of increased blood flow (BF) (top left), blood volume (BV) (top middle), permeability (top right), HAP (bottom left), and HPI (bottom right) and decreased PVP (bottom middle), indicating recurred/residual HCC at leading edge of tumor (arrowheads). (c) Arterial phase image (left) obtained 1 month after perfusion CT shows increased size of enhancing viable tumor (arrow) around faint lipiodol residuals (arrowhead), with washout on portal venous phase image (right), confirming recurrent/residual disease.
Figure 9c:
Images show perfusion CT facilitating diagnosis of local recurrence after TACE for HCC. (a) On precontrast (top left), arterial (top right), portal venous (bottom left), and delayed (bottom right) phase perfusion CT images 30 days after treatment, a densely lipiodol-laden nodule (arrow) is in right lobe of liver. No definite enhancing viable tumor focus is seen on conventional CT scans. (b) Color maps of perfusion CT, however, show area (arrows) of increased blood flow (BF) (top left), blood volume (BV) (top middle), permeability (top right), HAP (bottom left), and HPI (bottom right) and decreased PVP (bottom middle), indicating recurred/residual HCC at leading edge of tumor (arrowheads). (c) Arterial phase image (left) obtained 1 month after perfusion CT shows increased size of enhancing viable tumor (arrow) around faint lipiodol residuals (arrowhead), with washout on portal venous phase image (right), confirming recurrent/residual disease.
Current Challenges and Future Directions
Radiation Dose
Among several challenges of CT perfusion, the high radiation exposure is one of the most serious issues with this technique, in particular considering that cancer patients may need to undergo repetitive imaging examinations to monitor treatment response. Also, exposure to high radiation is not acceptable for early detection surveillance programs. Depending on the technique used, radiation doses ranging between 7.3 and 30.6 mSv have been reported for CT perfusion imaging of the liver (Table E1 [online]). Therefore, to make whole-liver volume perfusion CT feasible, in particular for early tumor detection, technical improvements in terms of radiation dose reduction have to be accomplished (95). To lower radiation dose, tube voltage and/or milliampere-seconds have been decreased in abdominal CT by some authors (96–98). The low-tube-voltage technique (for example, 80 kVp) can substantially increase the contrast enhancement of vascular and parenchymal structures by approximating the k edge of iodine (33.2 KeV). This, however, results in increased noise levels and beam hardening artifacts owing to reduced photon flux, compromising the quantitative accuracy of the technique. Recently, iterative reconstruction techniques have been introduced to address the trade-off between radiation dose and image quality. Iterative reconstruction algorithms help reduce the quantum noise and pixel variance associated with standard filtered back projection reconstruction algorithms by partially correcting for the fluctuations in projection measurement due to limited photon statistics, with essentially no trade-off in spatial resolution (99). By using an iterative reconstruction algorithm for liver CT perfusion imaging, Negi et al (100) showed that radiation exposure could be reduced by 45% without affecting hepatic perfusion values in 60 patients.
Another alternative to decrease radiation dose for HCC detection has been proposed by Kim et al (70), introducing the concept of whole-liver quantitative color mapping CT displays based on data sets from routine triple-phase liver CT examinations (Fig 6). Instead of acquiring a whole-liver perfusion imaging data set, they calculated the AEF, a value that is similar to HPI. AEF was defined as the ratio of the absolute increase of attenuation during the arterial phase to the absolute increment of attenuation during the portal venous phase: AEF = [(HUA−HUU)/(HUP−HUU)] x 100, where HU is the attenuation, A is arterial phase, P is portal phase, and U is unenhanced scan. The authors hypothesized that, in the arterial phase, the attenuation increase of the liver is mainly from the hepatic artery while the portal flow is limited, which reflects the HAP. In the portal venous phase, as contrast material remains in the hepatic artery as well as in the hepatic vein, the increase of the liver attenuation is maximal, thereby reflecting an approximation of the total hepatic perfusion (101). Therefore, AEF is considered to indirectly reflect the ratio of arterial liver perfusion to that of total liver perfusion, which is known as the HPI (102) (Fig 6). Indeed, there was strong correlation (correlation coefficient = 0.91) between HPI obtained from perfusion CT and AEF calculated from triple-phase liver CT in 10 rats with VX2 liver tumor (103). With this approach, a three-dimensional color-coded AEF display overlaid onto the anatomic liver CT images can be obtained, allowing radiologists to better detect nodules with increased HAP. Although other perfusion parameters cannot be obtained by using this method, if AEF could be further validated in additional studies, it could be used as an alternative CT perfusion parameter that may substantially increase the detection performance of HCC without adding additional radiation exposure.
Protocol Standardization
The lack of standards on CT perfusion data acquisition and reporting has been another challenge for a more widespread use of CT perfusion imaging in the clinic. This limitation has been recently addressed by developing standardized protocols for CT and MR perfusion imaging within the radiology community, such as the Quantitative Imaging Biomarkers Alliance (http://qibawiki.rsna.org/) (104) or the ECMC consensus document (29).
Reproducibility
Reproducible data acquisition is one of the prerequisites of a new imaging technique to gain more widespread acceptance in the clinic. Several studies have addressed reproducibility of CT perfusion imaging of the liver in both human and animal models (33,54,62,79,86,89,105,106). Stewart et al (105) calculated a coefficient of variation of 5.7% for HAP of normal liver tissue and of 1.4% for VX2 liver tumors in five rabbits. In six rats with liver tumors, there was no significant difference in blood flow, blood volume, MTT, and permeability surface area product values measured at two CT examinations of the same tumor on the same day (P = .2–.5) and interobserver agreements among two independent readers was high (89). In another study in eight human colon cancer xenografts, high interclass correlation coefficients for blood flow (0.93), blood volume (0.88), and flow extraction product (0.88) obtained from two consecutive CT perfusion acquisitions obtained at the same time also suggested good reproducibility (86). In four patients with HCC, Sahani et al (62) also reported a high correlation (correlation coefficient, 0.9) and a low variability (mean, 4%; range, 1%–13%) of perfusion parameters between two successive liver perfusion CT scans. Despite the above optimistic publications, there is still a recognized need for more reproducibility studies for CT perfusion measurements in various liver applications because most previous studies were performed on a single-center basis and enrolled a limited number of subjects. Additionally, future studies should be performed to assess other factors that determine the quality of CT perfusion images such as cardiac output and CT acquisition parameters which affect iodine sensitivity and image noise (29). Although there are few studies directly comparing different analysis methods of CT perfusion data sets (52,107), it is still unclear whether various perfusion values calculated using different analysis methods from different manufacturers result in reproducible data (29).
Motion Correction
Unlike the head, neck, and pelvis, which are less prone to respiratory motion, the liver is one of the most challenging organs for perfusion imaging, owing to considerable nonuniform and large motion during respiration. To compensate for respiratory motion, either shallow breathing or intermittent breath holding performed by the patient is recommended (29). In addition to breathing control, it is also recommended that motion due to breathing should be compensated for by image registration software using motion correction tools (29). Although several nonrigid registration approaches, including free-form deformation method, viscous fluid deformation model, and volume-preserving fluid registration method, have been proposed (108–110), there have been few studies that assessed the effects of motion compensation on quantitative liver CT perfusion imaging results. In general, most investigators agree that higher accuracy, reproducibility, and inter- or intraobserver agreement regarding quantification of liver perfusion parameters cannot be achieved without motion correction (103,111,112). For example, Ng et al (112) recently reported that absolute values and reproducibility of CT perfusion parameters were markedly influenced by motion and the best overall reproducibility was obtained with motion correction using an automated registration method. In another study, the majority (approximately 60%) of liver perfusion data sets could not be reliably quantified without motion correction while automated motion correction allowed analysis of all data sets (106).
Other Issues
Tumors are spatially and temporally heterogeneous. Therefore, functional assessment derived from a single tumor level (or time) may not reflect perfusion in the tumor as a whole. However, results regarding the usefulness of wider z-axis coverage or volumes of interest to account for this heterogeneity are contradicting (113,114). Some researchers suggested that increasing z-axis coverage does not improve reproducibility of quantitative perfusion measurements for colorectal cancer (113) while others reported that multisection CT perfusion techniques may provide more reproducible results for perfusion parameters than single-section CT perfusion in animal tumor model (114). Despite these conflicting results, it is recommended that CT systems should be able to image a tissue volume with a cranial-caudal distance of at least 4 cm and that tumor volumes of interest should encompass the whole tumor to minimize the effect of heterogeneity of parameter values within the tumor (29). When there is evidence of tumor necrosis, an application of additional volumes of interest avoiding necrotic areas is usually recommended.
Conclusion
CT perfusion imaging of the liver provides functional information about the microcirculation of normal parenchyma and focal neoplastic lesions of the liver. It is a promising technique for diagnosing primary or metastatic tumors, for assessing the efficacy of systemic or local tumor therapy, for predicting early response to anticancer treatments, and for monitoring tumor recurrence after therapy. Many of the limitations of early CT perfusion studies, such as limited coverage, motion artifacts, and high radiation dose of CT, are being addressed by recent technical developments. They include wide area detectors with or without volumetric spiral or shuttle modes, motion correction algorithms, and new reconstruction technologies such as iterative algorithms. However, several issues related to CT perfusion imaging remain unsolved. First, most perfusion studies in the liver were performed in small, predominantly single-center studies. Confirmation with larger or multicenter trials is therefore needed. Second, there is variability in image acquisition protocol and kinetic models implemented on vendor software by equipment manufacturers and only a few commercial software packages are currently available (and U.S. Food and Drug Administration approved or CE labeled [Conformité Européenne]) to perform such analyses. As a consequence, many research groups have created in-house software for data evaluation. Not surprisingly, this has led to disparate efforts in developing analysis tools, which are often academia-specific and nonstandardized. The lack of standardization in image acquisition and the methods applied for data analysis is an acknowledged issue by researchers in the field of perfusion imaging, and there is fortunately increasing efforts toward the standardization and harmonization of both data acquisition and analysis. Such developments are of paramount importance for the wider clinical acceptance of the technique and industry-academia collaborations are being developed to address such challenges (115). Third, although reproducibility of CT perfusion measurements has been documented in several studies, there is a need to confirm these encouraging results with larger, multi-institutional studies. Fourth, although there are several perfusion CT studies predicting prognosis or monitoring treatment response, data relating perfusion measurements to long-term clinical endpoints are lacking. To address this issue, further studies using overall survival or progression-free survival as more robust endpoints are needed. Finally, because most studies of CT perfusion to date have been small retrospective studies, further larger-scale prospective validation studies are strongly required. Despite these unsolved issues, CT perfusion has reached technical maturity allowing for its use in assessment of tumor vascularity in clinical trials.
Essentials
■ The liver is one of the most challenging organs for perfusion imaging, due to its unique dual vascular supply and considerable nonuniform motion during respiration.
■ Current CT perfusion protocols enable measurements of blood flow characteristics through dynamic CT acquisitions following intravenous administration of contrast agents; these protocols can be easily integrated into routine CT imaging protocols within the same imaging session.
■ CT perfusion of the liver is a promising technique for assessing the efficacy of various anticancer therapies, for diagnosing primary or metastatic tumors, for predicting early response to anticancer treatments, and for monitoring tumor recurrence after therapy.
■ Several issues related to hepatic CT perfusion such as radiation dose, reproducibility, protocol standardization, and motion correction need to be solved.
SUPPLEMENTAL TABLES
MOVIE
Received January 11, 2013; revision requested February 27; revision received June 9; accepted July 9; final version accepted July 31; final review by author March 27, 2014.
S.H.K. supported by a grant from Seoul National University Hospital Fund (04-2011-0270); A.K. and J.K.W. supported by Stanford Department of Radiology pilot grant.
Funding: Supported by the National Institutes of Health (grant R01 CA155289-01A1) (J.K.W.).
Disclosures of Conflicts of Interest: S.H.K. No relevant conflicts of interest to disclose. A.K. No relevant conflicts of interest to disclose. J.K.W. Financial activities related to the present article: none to disclose. Financial activities not related to the present article: consultant to Bracco. Other relationships: none to disclose.
Abbreviations:
- AEF
- arterial enhancement fraction
- FDG
- fluorodeoxyglucose
- HAP
- hepatic arterial perfusion
- HCC
- hepatocellular carcinoma
- HPI
- hepatic perfusion index
- MTT
- mean transit time
- PVP
- portal venous perfusion
- RECIST
- Response Evaluation Criteria in Solid Tumor
- ROI
- region of interest
- TACE
- transarterial chemoembolization
References
- 1.Paley MR, Ros PR. Hepatic metastases. Radiol Clin North Am 1998;36(2):349–363. [DOI] [PubMed] [Google Scholar]
- 2.Weiss L, Grundmann E, Torhorst J, et al. Haematogenous metastatic patterns in colonic carcinoma: an analysis of 1541 necropsies. J Pathol 1986;150(3):195–203. [DOI] [PubMed] [Google Scholar]
- 3.Fung J, Marsh W. The quandary over liver transplantation for hepatocellular carcinoma: the greater sin? Liver Transpl 2002;8(9):775–777. [DOI] [PubMed] [Google Scholar]
- 4.Eisenhauer EA, Therasse P, Bogaerts J, et al. New response evaluation criteria in solid tumours: revised RECIST guideline (version 1.1). Eur J Cancer 2009;45(2):228–247. [DOI] [PubMed] [Google Scholar]
- 5.Lencioni R, Llovet JM. Modified RECIST (mRECIST) assessment for hepatocellular carcinoma. Semin Liver Dis 2010;30(1):52–60. [DOI] [PubMed] [Google Scholar]
- 6.Cascorbi I. The promises of personalized medicine. Eur J Clin Pharmacol 2010;66(8):749–754. [DOI] [PubMed] [Google Scholar]
- 7.Collins CD, Purohit S, Podolsky RH, et al. The application of genomic and proteomic technologies in predictive, preventive and personalized medicine. Vascul Pharmacol 2006;45(5):258–267. [DOI] [PubMed] [Google Scholar]
- 8.Bhoori S, Toffanin S, Sposito C, et al. Personalized molecular targeted therapy in advanced, recurrent hepatocellular carcinoma after liver transplantation: a proof of principle. J Hepatol 2010;52(5):771–775. [DOI] [PubMed] [Google Scholar]
- 9.Hoshida Y, Toffanin S, Lachenmayer A, Villanueva A, Minguez B, Llovet JM. Molecular classification and novel targets in hepatocellular carcinoma: recent advancements. Semin Liver Dis 2010;30(1):35–51. [DOI] [PMC free article] [PubMed] [Google Scholar]
- 10.Kim H, Folks KD, Guo L, et al. Early therapy evaluation of combined cetuximab and irinotecan in orthotopic pancreatic tumor xenografts by dynamic contrast-enhanced magnetic resonance imaging. Mol Imaging 2011;10(3):153–167. [PMC free article] [PubMed] [Google Scholar]
- 11.Weissleder R, Mahmood U. Molecular imaging. Radiology 2001;219(2):316–333. [DOI] [PubMed] [Google Scholar]
- 12.Kim DH, Kim SH, Im SA, et al. Intermodality comparison between 3D perfusion CT and 18F-FDG PET/CT imaging for predicting early tumor response in patients with liver metastasis after chemotherapy: preliminary results of a prospective study. Eur J Radiol 2012;81(11):3542–3550. [DOI] [PubMed] [Google Scholar]
- 13.Cyran CC, von Einem JC, Paprottka PM, et al. Dynamic contrast-enhanced computed tomography imaging biomarkers correlated with immunohistochemistry for monitoring the effects of sorafenib on experimental prostate carcinomas. Invest Radiol 2012;47(1):49–57. [DOI] [PubMed] [Google Scholar]
- 14.Deshpande N, Pysz MA, Willmann JK. Molecular ultrasound assessment of tumor angiogenesis. Angiogenesis 2010;13(2):175–188. [DOI] [PMC free article] [PubMed] [Google Scholar]
- 15.Deshpande N, Needles A, Willmann JK. Molecular ultrasound imaging: current status and future directions. Clin Radiol 2010;65(7):567–581. [DOI] [PMC free article] [PubMed] [Google Scholar]
- 16.Pysz MA, Willmann JK. Targeted contrast-enhanced ultrasound: an emerging technology in abdominal and pelvic imaging. Gastroenterology 2011;140(3):785–790. [DOI] [PMC free article] [PubMed] [Google Scholar]
- 17.Kovar JL, Simpson MA, Schutz-Geschwender A, Olive DM. A systematic approach to the development of fluorescent contrast agents for optical imaging of mouse cancer models. Anal Biochem 2007;367(1):1–12. [DOI] [PubMed] [Google Scholar]
- 18.Goh V, Halligan S, Daley F, Wellsted DM, Guenther T, Bartram CI. Colorectal tumor vascularity: quantitative assessment with multidetector CT—do tumor perfusion measurements reflect angiogenesis? Radiology 2008;249(2):510–517. [DOI] [PubMed] [Google Scholar]
- 19.Ash L, Teknos TN, Gandhi D, Patel S, Mukherji SK. Head and neck squamous cell carcinoma: CT perfusion can help noninvasively predict intratumoral microvessel density. Radiology 2009;251(2):422–428. [DOI] [PubMed] [Google Scholar]
- 20.Kim JW, Jeong YY, Chang NK, et al. Perfusion CT in colorectal cancer: comparison of perfusion parameters with tumor grade and microvessel density. Korean J Radiol 2012;13(Suppl 1):S89–S97. [DOI] [PMC free article] [PubMed] [Google Scholar]
- 21.Lee TY, Ellis RJ, Dunscombe PB, et al. Quantitative computed tomography of the brain with xenon enhancement: a phantom study with the GE9800 scanner. Phys Med Biol 1990;35(7):925–935. [DOI] [PubMed] [Google Scholar]
- 22.Axel L. Cerebral blood flow determination by rapid-sequence computed tomography: theoretical analysis. Radiology 1980;137(3):679–686. [DOI] [PubMed] [Google Scholar]
- 23.Miles KA. Tumour angiogenesis and its relation to contrast enhancement on computed tomography: a review. Eur J Radiol 1999;30(3):198–205. [DOI] [PubMed] [Google Scholar]
- 24.Sahani DV. Perfusion CT: an overview of technique and clinical applications. http://cds.ismrm.org/protected/10MProceedings/files/Tues%20E09_02%20Sahani.pdf. Accessed May 8, 2012.
- 25.Miles KA. Perfusion CT for the assessment of tumour vascularity: which protocol? Br J Radiol 2003;76(Spec No 1):S36–S42. [DOI] [PubMed] [Google Scholar]
- 26.Kambadakone AR, Sahani DV. Body perfusion CT: technique, clinical applications, and advances. Radiol Clin North Am 2009;47(1):161–178. [DOI] [PubMed] [Google Scholar]
- 27.Meijerink MR, van Waesberghe JH, van der Weide L, van den Tol P, Meijer S, van Kuijk C. Total-liver-volume perfusion CT using 3-D image fusion to improve detection and characterization of liver metastases. Eur Radiol 2008;18(10):2345–2354. [DOI] [PubMed] [Google Scholar]
- 28.Miles KA, Charnsangavej C, Lee FT, Fishman EK, Horton K, Lee TY. Application of CT in the investigation of angiogenesis in oncology. Acad Radiol 2000;7(10):840–850. [DOI] [PubMed] [Google Scholar]
- 29.Miles KA, Lee TY, Goh V, et al. Current status and guidelines for the assessment of tumour vascular support with dynamic contrast-enhanced computed tomography. Eur Radiol 2012;22(7):1430–1441. [DOI] [PubMed] [Google Scholar]
- 30.Pandharipande PV, Krinsky GA, Rusinek H, Lee VS. Perfusion imaging of the liver: current challenges and future goals. Radiology 2005;234(3):661–673. [DOI] [PubMed] [Google Scholar]
- 31.Takeda A, Stoeltzing O, Ahmad SA, et al. Role of angiogenesis in the development and growth of liver metastasis. Ann Surg Oncol 2002;9(7):610–616. [DOI] [PubMed] [Google Scholar]
- 32.Miles KA, Hayball MP, Dixon AK. Functional images of hepatic perfusion obtained with dynamic CT. Radiology 1993;188(2):405–411. [DOI] [PubMed] [Google Scholar]
- 33.Blomley MJ, Coulden R, Dawson P, et al. Liver perfusion studied with ultrafast CT. J Comput Assist Tomogr 1995;19(3):424–433. [DOI] [PubMed] [Google Scholar]
- 34.Tsushima Y, Blomley JK, Kusano S, Endo K. The portal component of hepatic perfusion measured by dynamic CT: an indicator of hepatic parenchymal damage. Dig Dis Sci 1999;44(8):1632–1638. [DOI] [PubMed] [Google Scholar]
- 35.Leggett DA, Kelley BB, Bunce IH, Miles KA. Colorectal cancer: diagnostic potential of CT measurements of hepatic perfusion and implications for contrast enhancement protocols. Radiology 1997;205(3):716–720. [DOI] [PubMed] [Google Scholar]
- 36.Miles KA, Leggett DA, Kelley BB, Hayball MP, Sinnatamby R, Bunce I. In vivo assessment of neovascularization of liver metastases using perfusion CT. Br J Radiol 1998;71(843):276–281. [DOI] [PubMed] [Google Scholar]
- 37.Dugdale PE, Miles KA. Hepatic metastases: the value of quantitative assessment of contrast enhancement on computed tomography. Eur J Radiol 1999;30(3):206–213. [DOI] [PubMed] [Google Scholar]
- 38.Brandt TD, Neiman HL, Dragowski MJ, Bulawa W, Claykamp G. Ultrasound assessment of normal renal dimensions. J Ultrasound Med 1982;1(2):49–52. [DOI] [PubMed] [Google Scholar]
- 39.Brix G, Griebel J, Kiessling F, Wenz F. Tracer kinetic modelling of tumour angiogenesis based on dynamic contrast-enhanced CT and MRI measurements. Eur J Nucl Med Mol Imaging 2010;37(Suppl 1):S30–S51. [DOI] [PubMed] [Google Scholar]
- 40.Sourbron SP, Buckley DL. Tracer kinetic modelling in MRI: estimating perfusion and capillary permeability. Phys Med Biol 2012;57(2):R1–R33. [DOI] [PubMed] [Google Scholar]
- 41.Thng CH, Koh TS, Collins DJ, Koh DM. Perfusion magnetic resonance imaging of the liver. World J Gastroenterol 2010;16(13):1598–1609. [DOI] [PMC free article] [PubMed] [Google Scholar]
- 42.Liu Y, Matsui O. Changes of intratumoral microvessels and blood perfusion during establishment of hepatic metastases in mice. Radiology 2007;243(2):386–395. [DOI] [PubMed] [Google Scholar]
- 43.Koh TS, Thng CH, Lee PS, et al. Hepatic metastases: in vivo assessment of perfusion parameters at dynamic contrast-enhanced MR imaging with dual-input two-compartment tracer kinetics model. Radiology 2008;249(1):307–320. [DOI] [PubMed] [Google Scholar]
- 44.Ng CS, Chandler AG, Wei W, et al. Effect of dual vascular input functions on CT perfusion parameter values and reproducibility in liver tumors and normal liver. J Comput Assist Tomogr 2012;36(4):388–393. [DOI] [PMC free article] [PubMed] [Google Scholar]
- 45.Cuenod C, Leconte I, Siauve N, et al. Early changes in liver perfusion caused by occult metastases in rats: detection with quantitative CT. Radiology 2001;218(2):556–561. [DOI] [PubMed] [Google Scholar]
- 46.Materne R, Van Beers BE, Smith AM, et al. Non-invasive quantification of liver perfusion with dynamic computed tomography and a dual-input one-compartmental model. Clin Sci (Lond) 2000;99(6):517–525. [PubMed] [Google Scholar]
- 47.Lee TY, Stewart E. Scientific basis and validation. In: Miles KA, Cuenod CA, eds. Multidetector computed tomography in oncology: CT perfusion imaging. London, England: Informa Healthcare, 2007; 15–46. [Google Scholar]
- 48.Patlak CS, Blasberg RG, Fenstermacher JD. Graphical evaluation of blood-to-brain transfer constants from multiple-time uptake data. J Cereb Blood Flow Metab 1983;3(1):1–7. [DOI] [PubMed] [Google Scholar]
- 49.Johnson JA, Wilson TA. A model for capillary exchange. Am J Physiol 1966;210(6):1299–1303. [DOI] [PubMed] [Google Scholar]
- 50.Axel L. Tissue mean transit time from dynamic computed tomography by a simple deconvolution technique. Invest Radiol 1983;18(1):94–99. [DOI] [PubMed] [Google Scholar]
- 51.Petralia G, Bonello L, Viotti S, Preda L, d’Andrea G, Bellomi M. CT perfusion in oncology: how to do it. Cancer Imaging 2010;10:8–19. [DOI] [PMC free article] [PubMed] [Google Scholar]
- 52.Goh V, Halligan S, Bartram CI. Quantitative tumor perfusion assessment with multidetector CT: are measurements from two commercial software packages interchangeable? Radiology 2007;242(3):777–782. [DOI] [PubMed] [Google Scholar]
- 53.Miles KA, Kelley BB. Altered perfusion adjacent to hepatic metastases. Clin Radiol 1997;52(2):162–163. [DOI] [PubMed] [Google Scholar]
- 54.Reiner CS, Goetti R, Burger IA, et al. Liver perfusion imaging in patients with primary and metastatic liver malignancy: prospective comparison between 99mTc-MAA spect and dynamic CT perfusion. Acad Radiol 2012;19(5):613–621. [DOI] [PubMed] [Google Scholar]
- 55.Guyennon A, Mihaila M, Palma J, Lombard-Bohas C, Chayvialle JA, Pilleul F. Perfusion characterization of liver metastases from endocrine tumors: computed tomography perfusion. World J Radiol 2010;2(11):449–454. [DOI] [PMC free article] [PubMed] [Google Scholar]
- 56.Lefort T, Pilleul F, Mulé S, et al. Correlation and agreement between contrast-enhanced ultrasonography and perfusion computed tomography for assessment of liver metastases from endocrine tumors: normalization enhances correlation. Ultrasound Med Biol 2012;38(6):953–961. [DOI] [PubMed] [Google Scholar]
- 57.Matsui O, Kobayashi S, Sanada J, et al. Hepatocelluar nodules in liver cirrhosis: hemodynamic evaluation (angiography-assisted CT) with special reference to multi-step hepatocarcinogenesis. Abdom Imaging 2011;36(3):264–272. [DOI] [PMC free article] [PubMed] [Google Scholar]
- 58.Ippolito D, Sironi S, Pozzi M, et al. Hepatocellular carcinoma in cirrhotic liver disease: functional computed tomography with perfusion imaging in the assessment of tumor vascularization. Acad Radiol 2008;15(7):919–927. [DOI] [PubMed] [Google Scholar]
- 59.Ippolito D, Sironi S, Pozzi M, et al. Perfusion CT in cirrhotic patients with early stage hepatocellular carcinoma: assessment of tumor-related vascularization. Eur J Radiol 2010;73(1):148–152. [DOI] [PubMed] [Google Scholar]
- 60.Ippolito D, Capraro C, Casiraghi A, Cestari C, Sironi S. Quantitative assessment of tumour associated neovascularisation in patients with liver cirrhosis and hepatocellular carcinoma: role of dynamic-CT perfusion imaging. Eur Radiol 2012;22(4):803–811. [DOI] [PubMed] [Google Scholar]
- 61.Johnson RS, Rusinek H, Mikheev A, et al. Perfusion quantification in hepatocellular carcinoma using dynamic contrast-enhanced MRI [abstr]. In: Proceedings of the Sixteenth Meeting of the International Society for Magnetic Resonance in Medicine. Berkeley, Calif: International Society for Magnetic Resonance in Medicine, 2008; 2616. [Google Scholar]
- 62.Sahani DV, Holalkere NS, Mueller PR, Zhu AX. Advanced hepatocellular carcinoma: CT perfusion of liver and tumor tissue—initial experience. Radiology 2007;243(3):736–743. [DOI] [PubMed] [Google Scholar]
- 63.Zhu AX, Holalkere NS, Muzikansky A, Horgan K, Sahani DV. Early antiangiogenic activity of bevacizumab evaluated by computed tomography perfusion scan in patients with advanced hepatocellular carcinoma. Oncologist 2008;13(2):120–125. [DOI] [PubMed] [Google Scholar]
- 64.Abdullah SS, Pialat JB, Wiart M, et al. Characterization of hepatocellular carcinoma and colorectal liver metastasis by means of perfusion MRI. J Magn Reson Imaging 2008;28(2):390–395. [DOI] [PubMed] [Google Scholar]
- 65.Mazzaferro V, Regalia E, Doci R, et al. Liver transplantation for the treatment of small hepatocellular carcinomas in patients with cirrhosis. N Engl J Med 1996;334(11):693–699. [DOI] [PubMed] [Google Scholar]
- 66.El-Serag HB, Mason AC. Rising incidence of hepatocellular carcinoma in the United States. N Engl J Med 1999;340(10):745–750. [DOI] [PubMed] [Google Scholar]
- 67.Leen E, Goldberg JA, Angerson WJ, McArdle CS. Potential role of doppler perfusion index in selection of patients with colorectal cancer for adjuvant chemotherapy. Lancet 2000;355(9197):34–37. [DOI] [PubMed] [Google Scholar]
- 68.Tsushima Y, Blomley MJ, Yokoyama H, Kusano S, Endo K. Does the presence of distant and local malignancy alter parenchymal perfusion in apparently disease-free areas of the liver? Dig Dis Sci 2001;46(10):2113–2119. [DOI] [PubMed] [Google Scholar]
- 69.Shi GF, Wang SJ, Wang Q, et al. Effect of perfusion CT scan on hepatic hemodynamic changes in rats with liver micrometastases [in Chinese]. Ai Zheng 2006;25(7):849–854. [PubMed] [Google Scholar]
- 70.Kim KW, Lee JM, Klotz E, et al. Quantitative CT color mapping of the arterial enhancement fraction of the liver to detect hepatocellular carcinoma. Radiology 2009;250(2):425–434. [DOI] [PubMed] [Google Scholar]
- 71.Henderson E, Milosevic MF, Haider MA, Yeung IW. Functional CT imaging of prostate cancer. Phys Med Biol 2003;48(18):3085–3100. [DOI] [PubMed] [Google Scholar]
- 72.Cuenod CA, Fournier L, Balvay D, Guinebretière JM. Tumor angiogenesis: pathophysiology and implications for contrast-enhanced MRI and CT assessment. Abdom Imaging 2006;31(2):188–193. [DOI] [PubMed] [Google Scholar]
- 73.Phongkitkarun S, Kobayashi S, Kan Z, Lee TY, Charnsangavej C. Quantification of angiogenesis by functional computed tomography in a Matrigel model in rats. Acad Radiol 2004;11(5):573–582. [DOI] [PubMed] [Google Scholar]
- 74.Chen WX, Min PQ, Song B, Xiao BL, Liu Y, Ge YH. Single-level dynamic spiral CT of hepatocellular carcinoma: correlation between imaging features and density of tumor microvessels. World J Gastroenterol 2004;10(1):67–72. [DOI] [PMC free article] [PubMed] [Google Scholar]
- 75.Yi CA, Lee KS, Kim EA, et al. Solitary pulmonary nodules: dynamic enhanced multi-detector row CT study and comparison with vascular endothelial growth factor and microvessel density. Radiology 2004;233(1):191–199. [DOI] [PubMed] [Google Scholar]
- 76.Chen Y, Zhang J, Dai J, Feng X, Lu H, Zhou C. Angiogenesis of renal cell carcinoma: perfusion CT findings. Abdom Imaging 2010;35(5):622–628. [DOI] [PubMed] [Google Scholar]
- 77.Xie Q, Zhang J, Wu PH, et al. Bladder transitional cell carcinoma: correlation of contrast enhancement on computed tomography with histological grade and tumour angiogenesis. Clin Radiol 2005;60(2):215–223. [DOI] [PubMed] [Google Scholar]
- 78.Miles KA, Colyvas K, Griffiths MR, Bunce IH. Colon cancer: risk stratification using hepatic perfusion CT [abstr]. Eur Radiol 2004;14(Suppl 2):129. [Google Scholar]
- 79.Anzidei M, Napoli A, Zaccagna F, et al. Liver metastases from colorectal cancer treated with conventional and antiangiogenetic chemotherapy: evaluation with liver computed tomography perfusion and magnetic resonance diffusion-weighted imaging. J Comput Assist Tomogr 2011;35(6):690–696. [DOI] [PubMed] [Google Scholar]
- 80.Jiang T, Kambadakone A, Kulkarni NM, Zhu AX, Sahani DV. Monitoring response to antiangiogenic treatment and predicting outcomes in advanced hepatocellular carcinoma using image biomarkers, CT perfusion, tumor density, and tumor size (RECIST). Invest Radiol 2012;47(1):11–17. [DOI] [PubMed] [Google Scholar]
- 81.Petralia G, Fazio N, Bonello L, D’Andrea G, Radice D, Bellomi M. Perfusion computed tomography in patients with hepatocellular carcinoma treated with thalidomide: initial experience. J Comput Assist Tomogr 2011;35(2):195–201. [DOI] [PubMed] [Google Scholar]
- 82.Mullani N, Herbst R, Abbruzzese J, et al. Antiangiogenic treatment with endostatin results in uncoupling of blood flow and glucose metabolism in human tumors. Clin Positron Imaging 2000;3(4):151. [DOI] [PubMed] [Google Scholar]
- 83.Willett CG, Boucher Y, di Tomaso E, et al. Direct evidence that the VEGF-specific antibody bevacizumab has antivascular effects in human rectal cancer. Nat Med 2004;10(2):145–147. [DOI] [PMC free article] [PubMed] [Google Scholar]
- 84.Wudel LJ, Jr, Delbeke D, Morris D, et al. The role of [18F]fluorodeoxyglucose positron emission tomography imaging in the evaluation of hepatocellular carcinoma. Am Surg 2003;69(2):117–124; discussion 124–126. [PubMed] [Google Scholar]
- 85.Forner A, Ayuso C, Varela M, et al. Evaluation of tumor response after locoregional therapies in hepatocellular carcinoma: are response evaluation criteria in solid tumors reliable? Cancer 2009;115(3):616–623. [DOI] [PubMed] [Google Scholar]
- 86.Ren Y, Fleischmann D, Foygel K, et al. Antiangiogenic and radiation therapy: early effects on in vivo computed tomography perfusion parameters in human colon cancer xenografts in mice. Invest Radiol 2012;47(1):25–32. [DOI] [PMC free article] [PubMed] [Google Scholar]
- 87.Xiong HQ, Herbst R, Faria SC, et al. A phase I surrogate endpoint study of SU6668 in patients with solid tumors. Invest New Drugs 2004;22(4):459–466. [DOI] [PubMed] [Google Scholar]
- 88.Ng CS, Charnsangavej C, Wei W, Yao JC. Perfusion CT findings in patients with metastatic carcinoid tumors undergoing bevacizumab and interferon therapy. AJR Am J Roentgenol 2011;196(3):569–576. [DOI] [PubMed] [Google Scholar]
- 89.Kan Z, Kobayashi S, Phongkitkarun S, Charnsangavej C. Functional CT quantification of tumor perfusion after transhepatic arterial embolization in a rat model. Radiology 2005;237(1):144–150. [DOI] [PubMed] [Google Scholar]
- 90.Choi SH, Chung JW, Kim HC, et al. The role of perfusion CT as a follow-up modality after transcatheter arterial chemoembolization: an experimental study in a rabbit model. Invest Radiol 2010;45(7):427–436. [DOI] [PubMed] [Google Scholar]
- 91.Yang L, Zhang XM, Tan BX, Liu M, Dong GL, Zhai ZH. Computed tomographic perfusion imaging for the therapeutic response of chemoembolization for hepatocellular carcinoma. J Comput Assist Tomogr 2012;36(2):226–230. [DOI] [PubMed] [Google Scholar]
- 92.Mahnken AH, Klotz E, Schreiber S, et al. Volumetric arterial enhancement fraction predicts tumor recurrence after hepatic radiofrequency ablation of liver metastases: initial results. AJR Am J Roentgenol 2011;196(5):W573–W579. [DOI] [PubMed] [Google Scholar]
- 93.Meijerink MR, van Waesberghe JH, van der Weide L, et al. Early detection of local RFA site recurrence using total liver volume perfusion CT initial experience. Acad Radiol 2009;16(10):1215–1222. [DOI] [PubMed] [Google Scholar]
- 94.Ippolito D, Bonaffini PA, Ratti L, et al. Hepatocellular carcinoma treated with transarterial chemoembolization: dynamic perfusion CT in the assessment of residual tumor. World J Gastroenterol 2010;16(47):5993–6000. [DOI] [PMC free article] [PubMed] [Google Scholar]
- 95.Wang J, Li T, Lu H, Liang Z. Penalized weighted least-squares approach to sinogram noise reduction and image reconstruction for low-dose X-ray computed tomography. IEEE Trans Med Imaging 2006;25(10):1272–1283. [DOI] [PMC free article] [PubMed] [Google Scholar]
- 96.Marin D, Nelson RC, Samei E, et al. Hypervascular liver tumors: low tube voltage, high tube current multidetector CT during late hepatic arterial phase for detection—initial clinical experience. Radiology 2009;251(3):771–779. [DOI] [PubMed] [Google Scholar]
- 97.Schindera ST, Nelson RC, Mukundan S, Jr, et al. Hypervascular liver tumors: low tube voltage, high tube current multi-detector row CT for enhanced detection—phantom study. Radiology 2008;246(1):125–132. [DOI] [PubMed] [Google Scholar]
- 98.Marin D, Nelson RC, Barnhart H, et al. Detection of pancreatic tumors, image quality, and radiation dose during the pancreatic parenchymal phase: effect of a low-tube-voltage, high-tube-current CT technique—preliminary results. Radiology 2010;256(2):450–459. [DOI] [PubMed] [Google Scholar]
- 99.Fitzpatrick TJ, Neiman BH. Histoplasma capsulatum infection associated with gastric ulcer and fatal hemorrhage. AMA Arch Intern Med 1953;91(1):49–55. [DOI] [PubMed] [Google Scholar]
- 100.Negi N, Yoshikawa T, Ohno Y, et al. Hepatic CT perfusion measurements: a feasibility study for radiation dose reduction using new image reconstruction method. Eur J Radiol 2012;81(11):3048–3054. [DOI] [PubMed] [Google Scholar]
- 101.Platt JF, Francis IR, Ellis JH, Reige KA. Liver metastases: early detection based on abnormal contrast material enhancement at dual-phase helical CT. Radiology 1997;205(1):49–53. [DOI] [PubMed] [Google Scholar]
- 102.Quiroga S, Sebastià C, Pallisa E, Castellà E, Pérez-Lafuente M, Alvarez-Castells A. Improved diagnosis of hepatic perfusion disorders: value of hepatic arterial phase imaging during helical CT. RadioGraphics 2001;21(1):65–81, 288–294. [DOI] [PubMed] [Google Scholar]
- 103.Kim KW, Lee JM, Kim JH, et al. CT color mapping of the arterial enhancement fraction of VX2 carcinoma implanted in rabbit liver: comparison with perfusion CT. AJR Am J Roentgenol 2011;196(1):102–108. [DOI] [PubMed] [Google Scholar]
- 104.Quantitative Imaging Biomarkers Alliance (QIBA) . RSNA. http://qibawiki.rsna.org/index.php?title=DCE-MRI_subctte. Updated April 30, 2014. Accessed March 20, 2014.
- 105.Stewart EE, Chen X, Hadway J, Lee TY. Hepatic perfusion in a tumor model using DCE-CT: an accuracy and precision study. Phys Med Biol 2008;53(16):4249–4267. [DOI] [PubMed] [Google Scholar]
- 106.Goetti R, Reiner CS, Knuth A, et al. Quantitative perfusion analysis of malignant liver tumors: dynamic computed tomography and contrast-enhanced ultrasound. Invest Radiol 2012;47(1):18–24. [DOI] [PubMed] [Google Scholar]
- 107.Bisdas S, Konstantinou G, Surlan-Popovic K, et al. Dynamic contrast-enhanced CT of head and neck tumors: comparison of first-pass and permeability perfusion measurements using two different commercially available tracer kinetics models. Acad Radiol 2008;15(12):1580–1589. [DOI] [PubMed] [Google Scholar]
- 108.Christensen GE, Rabbitt RD, Miller MI. Deformable templates using large deformation kinematics. IEEE Trans Image Process 1996;5(10):1435–1447. [DOI] [PubMed] [Google Scholar]
- 109.Rueckert D, Sonoda LI, Hayes C, Hill DL, Leach MO, Hawkes DJ. Nonrigid registration using free-form deformations: application to breast MR images. IEEE Trans Med Imaging 1999;18(8):712–721. [DOI] [PubMed] [Google Scholar]
- 110.Noblet V, Heinrich C, Heitz F, Armspach JP. 3-D deformable image registration: a topology preservation scheme based on hierarchical deformation models and interval analysis optimization. IEEE Trans Image Process 2005;14(5):553–566. [DOI] [PubMed] [Google Scholar]
- 111.Ng CS, Raunig DL, Jackson EF, et al. Reproducibility of perfusion parameters in dynamic contrast-enhanced MRI of lung and liver tumors: effect on estimates of patient sample size in clinical trials and on individual patient responses. AJR Am J Roentgenol 2010;194(2):W134–W140. [DOI] [PubMed] [Google Scholar]
- 112.Ng CS, Chandler AG, Wei W, et al. Reproducibility of CT perfusion parameters in liver tumors and normal liver. Radiology 2011;260(3):762–770. [DOI] [PMC free article] [PubMed] [Google Scholar]
- 113.Goh V, Halligan S, Gartner L, Bassett P, Bartram CI. Quantitative colorectal cancer perfusion measurement by multidetector-row CT: does greater tumour coverage improve measurement reproducibility? Br J Radiol 2006;79(943):578–583. [DOI] [PubMed] [Google Scholar]
- 114.Hakimé A, Peddi H, Hines-Peralta AU, et al. CT perfusion for determination of pharmacologically mediated blood flow changes in an animal tumor model. Radiology 2007;243(3):712–719. [DOI] [PubMed] [Google Scholar]
- 115.Meijerink MR, van Waesberghe JH, van Schaik C, et al. Perfusion CT and US of colorectal cancer liver metastases: a correlative study of two dynamic imaging modalities. Ultrasound Med Biol 2010;36(10):1626–1636. [DOI] [PubMed] [Google Scholar]
Associated Data
This section collects any data citations, data availability statements, or supplementary materials included in this article.


