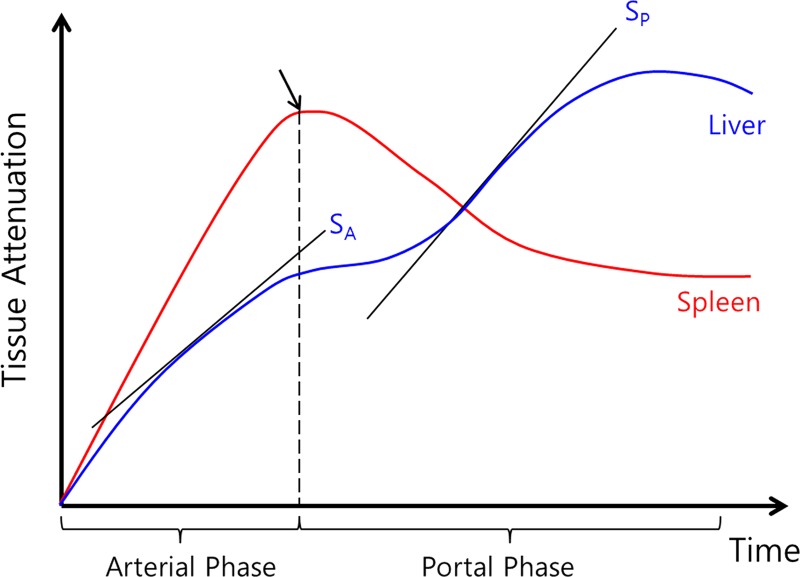
Figure 3:
Plot of time-intensity curve of spleen and liver from CT perfusion study using maximum slope method. Diagram shows how maximum slope for arterial perfusion (SA) and portal perfusion (SP) are derived. Time to peak splenic enhancement (arrow) indicates end of arterial phase and beginning of portal venous phase of liver perfusion, which is used for separating arterial and portal venous phases. Maximal slope (SA or SP) of liver time-intensity curve in each phase is divided by peak aortic and portal enhancement to calculate both hepatic arterial and portal perfusion, respectively. (Reprinted, with permission, from reference 32.)

