The extent of coronary plaque in asymptomatic diabetic patients is related to body mass index and duration of diabetes.
Abstract
Purpose
To determine the relationship between coronary plaque detected with coronary computed tomographic (CT) angiography and clinical parameters and cardiovascular risk factors in asymptomatic patients with diabetes.
Materials and Methods
All patients signed institutional review board–approved informed consent forms before enrollment. Two hundred twenty-four asymptomatic diabetic patients (121 men; mean patient age, 61.8 years; mean duration of diabetes, 10.4 years) underwent coronary CT angiography. Total coronary artery wall volume in all three vessels was measured by using semiautomated software. The coronary plaque volume index (PVI) was determined by dividing the wall volume by the coronary length. The relationship between the PVI and cardiovascular risk factors was determined with multivariable analysis.
Results
The mean PVI (±standard deviation) was 11.2 mm2 ± 2.7. The mean coronary artery calcium (CAC) score (determined with the Agatston method) was 382; 67% of total plaque was noncalcified. The PVI was related to age (standardized β = 0.32, P < .001), male sex (standardized β = 0.36, P < .001), body mass index (BMI) (standardized β = 0.26, P < .001), and duration of diabetes (standardized β = 0.14, P = .03). A greater percentage of soft plaque was present in younger individuals with a shorter disease duration (P = .02). The soft plaque percentage was directly related to BMI (P = .002). Patients with discrepancies between CAC score and PVI rank quartiles had a higher percentage of soft and fibrous plaque (18.7% ± 3.3 vs 17.4% ± 3.5 [P = .008] and 52.2% ± 7.2 vs 47.2% ± 8.8 [P < .0001], respectively).
Conclusion
In asymptomatic diabetic patients, BMI was the primary modifiable risk factor that was associated with total and soft coronary plaque as assessed with coronary CT angiography.
© RSNA, 2014
Clinical trial registration no. NCT00488033
Introduction
Diabetes affects approximately 8% of the U.S. population, and the prevalence of diabetes has increased dramatically during the past 20 years (1). Cardiovascular disease accounts for approximately 75% of mortality in patients with diabetes (2). Asymptomatic diabetic patients had a 16% prevalence of silent myocardial infarction at diagnosis (3). Studies have shown that asymptomatic cardiovascular disease in a diabetic population is both detectable (4–6) and prevalent (7).
Given the high prevalence of cardiovascular disease in patients with diabetes, noninvasive imaging methods may be useful for identifying high-risk patients. The coronary artery calcium (CAC) score is a strong prognostic indicator of cardiovascular disease in both nondiabetic individuals (8–12) and diabetic patients (13,14). However, the CAC score has low specificity (approximately 40%) for cardiovascular disease outcomes in diabetic patients (14). The CAC score also shows little change despite low-density lipoprotein–lowering therapy that effectively reduces cardiovascular events (15). This apparent contradiction between the use of the CAC score for risk prediction but the inability to modify the CAC score suggests that noncalcified plaque may also be relevant. Intravascular ultrasonography (US) can help quantify noncalcified and calcified coronary artery plaque (16) but is unsuitable for screening purposes.
Coronary computed tomographic (CT) angiography is emerging as a viable approach for the quantification of both calcified and noncalcified plaque (17–19). The method has been successfully validated for plaque volume in relation to histologic examination and intravascular US (20,21). Plaque identified with coronary CT angiography has been related to acute coronary syndromes in symptomatic patients (22). To our knowledge, the use of coronary CT angiography to noninvasively evaluate total plaque volume in at-risk diabetic patients has not yet been demonstrated. The purpose of this study was to determine the relationship between coronary plaque detected with coronary CT angiography and clinical parameters and cardiovascular risk factors in asymptomatic diabetic patients.
Materials and Methods
Patient Population
The study population consisted of all available subjects randomized to the coronary CT angiography screening arm of the Screening for Asymptomatic Obstructive Coronary Artery Disease among High-Risk Diabetic Patients Using CT Angiography, Following Core 64 Trial (Factor-64 trial, clinical trial no. NCT00488033), an ongoing, prospective study designed to evaluate the effect of randomization to screening coronary CT angiography in an asymptomatic diabetic population. All patients signed institutional review board–approved informed consent forms before enrollment. Inclusion criteria included (a) men aged at least 50 years or women aged at least 55 years with a history of diabetes mellitus documented for at least 3 years or (b) men aged at least 40 years or women aged at least 45 years with a history of diabetes mellitus documented for at least 5 years. Exclusion criteria included known coronary artery disease, symptomatic cerebral vascular disease, or symptomatic peripheral vascular disease (see Appendix E1 [online] for a complete listing of inclusion and exclusion criteria). The authors had full control of the data and the information submitted for publication.
Clinical and laboratory characteristics were obtained at enrollment. Any further laboratory studies were performed only as clinically indicated. Participant characteristics included age, sex, type of diabetes, duration of diabetes, CAC score, ethnicity, height, weight, blood pressure, smoking history, hemoglobin A1c (HbA1c) level, fasting glucose level, high-sensitivity C-reactive protein (hsCRP) level, high-density lipoprotein cholesterol (HDL-C) level, low-density lipoprotein cholesterol (LDL-C) level, triglycerides level, hypertension, hyperlipidemia, diabetic complications, and medications.
CT Angiography Protocol
Imaging was performed with a 64-section coronary CT scanner (Aquilion 64; Toshiba America Medical Systems, Tustin, Calif). The CAC score was obtained from unenhanced scans by using 3 mm of collimation at 3-mm section increments and calculated with use of the Agatston method. CT angiography was performed with retrospective gating at 120 kV and 350–600 mA, with a gantry rotation time of 400 msec. Heart rate was controlled to less than 60 beats per minute with oral metoprolol. Vasodilation was achieved with 0.4 mg sublingual nitroglycerine. Contrast material (iopamidol 370 [Isovue, Bracco Diagnostics, Melville, NY]) was injected into the right antecubital vein with automated bolus tracking at 180 HU. Reconstruction with use of phaseXact software (Toshiba America Medical Systems) was performed by using the FC43 “regular” kernel at 75% of the R-R interval. If the phase was not optimal for image analysis, subsequent data sets were reconstructed on the basis of an operator-determined phase of the R-R interval. The mean effective dose for coronary CT angiography (±standard deviation) was 12 mSv ± 2.
Image Analysis
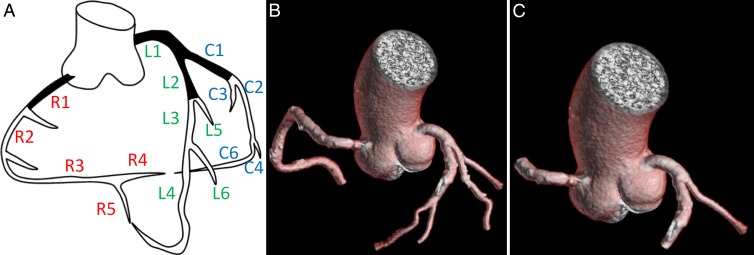
Analysis was performed with a Vitrea fX workstation (model V6.3; Vital Images, Minnetonka, Minn) by using SUREplaque software (Vital Images) for subtype quantification. Validation of SUREplaque software in comparison to intravascular US has been previously reported (18,23,24). Image analysis was performed by two readers blinded to all clinical parameters (A.C.K. and G.C., each with 1 year of experience) and was overseen by a cardiologist (C.T.S.) with 5 years of experience in cardiac CT angiography. Segmentation was performed by using the Coronary Evaluation Using Multidetector CT Angiography Using 64 Detectors (CORE-64) model (Fig 1) (25); plaque subtype quantification was adapted from the method used by Rinehart et al (24).
Figure 1:
Coronary artery segment anatomy used in current study and adapted from that used by Miller et al (25). A, Segmental nomenclature for coronary artery territories. Not pictured are C5 (third obtuse marginal), C7 (left posterior descending), and C8 (ramus intermedius) segments. B, Full segmentation of arteries more than 2 mm in diameter. C, Segmentation in same patient shows proximal segments C1, L1, L2, and R1.
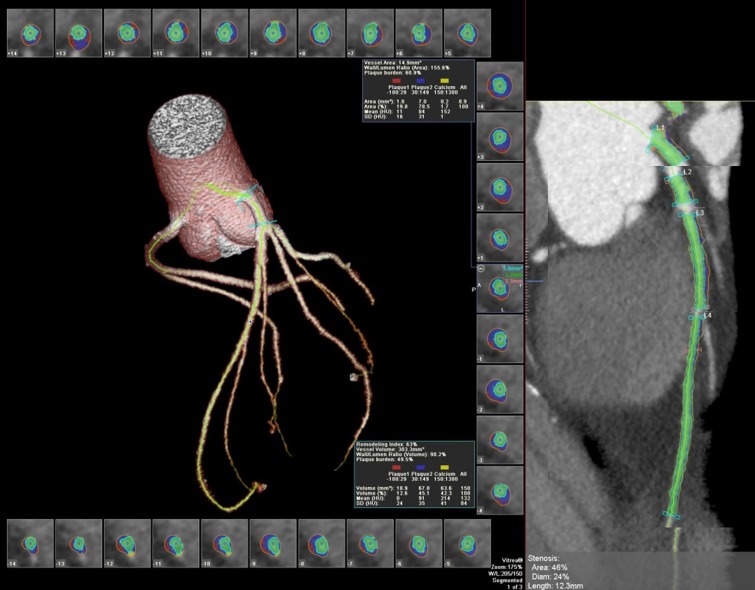
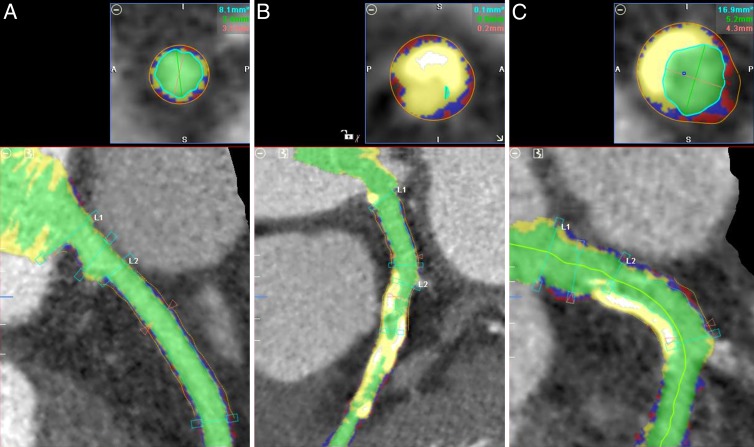
Plaque volume and subtype parameters were measured as follows: Segments were measured from the beginning of the ostia and continued until the proximal edge of a side branch, with the next segment starting from the distal edge of the bifurcation. All vessels with a luminal diameter of at least 2.0 mm were included (Fig 2). All automated contouring of the external vessel wall and internal lumen was reviewed on the basis of 0.5-mm-thick sections. Manual contouring of the centerline, luminal boundary, and vessel wall boundary was performed when there were clear deviations of the automated software’s ability to appropriately determine the true location of the vessel boundaries. Plaque volume was calculated by subtracting the lumen volume from the total vessel volume. Plaque volumes were normalized by coronary artery length to determine the plaque volume index (PVI, in square millimeters). Plaque subtypes have previously been defined (24) as “soft” plaque (−100 to 30 HU), “fibrous” plaque (>30 but <150 HU), and “calcified” plaque (150–1300 HU) (Fig 3) and expressed as a percentage of overall plaque volume to generate the soft-tissue plaque fraction (in percentage), fibrous plaque fraction (in percentage), and calcified plaque fraction (in percentage). In preliminary analysis, mean lumen density in the right coronary artery was found to be representative of lumen density in the left coronary artery. Thus, right coronary artery lumen density was measured and used in subsequent statistical analysis (discussed further below).
Figure 2:
Segmentation of left anterior descending artery with vascular model and coronary cross sections. Plaque subtypes are shown as follows: red = soft plaque, blue = fibrous plaque, yellow = calcified plaque. Green = luminal area. Note exclusion of ostia during segmentation. Plaque volume is the sum of all plaque component volumes.
Figure 3:
Automated plaque detection. Red = soft plaque, blue = fibrous plaque, yellow = calcified plaque, green = luminal area. A, Image in patient with minimal plaque. PVI = 6.4 mm2, soft PVI = 1.5 mm2, fibrous PVI = 3.3 mm2, calcified PVI = 1.6 mm2. B, Image in patient with large amounts of calcified plaque. PVI = 20.1 mm2, soft PVI = 2.5 mm2, fibrous PVI = 6.1 mm2, calcified PVI = 11.5 mm2. C, Image in patient with both calcified plaque (upper left) and mixed plaque (lower right). PVI = 16.9 mm2, soft PVI = 3.5 mm2, fibrous PVI = 7.1 mm2, calcified PVI = 6.2 mm2.
We observed that plaque was more prominent in proximal vessels and was more reliably identified in proximal rather than distal vessels. Proximal PVI (L1, L2, C1, and R1 segments as defined with the CORE-64 segmentation method [25], proximal PVI) was compared with full coronary artery analysis (total PVI) in a random sampling of 50% of the study cohort. The time to analyze proximal plaque versus full plaque volume was measured with a stopwatch in 20 consecutive subjects. We also performed an identical analysis of proximal versus full coronary plaque extent in 25 consecutive nondiabetic and asymptomatic volunteer study subjects (age range, 58–86 years; mean age, 66.8 years; median age, 65 years; 11 men, 14 women).
Statistical Analysis
Analysis was performed with software (SPSS v. 15; SPSS, Chicago, Ill). The χ2 statistic and the Student t test were used to determine differences in the characteristic of men and women and the difference between proximal and total analysis time. The intraclass correlation coefficient was used to determine inter- and intrareader reproducibility. The Pearson coefficient was used to evaluate the correlation of proximal and total analysis. Correlation of quantitative parameters to clinical risk factors was performed by using the Spearman coefficient. Linear regression with forced variable entry was performed to assess clinical predictors of plaque burden and CAC score and was reported by using standardized β coefficients. Determination of final regression models was made by examining correlations, tolerance, variance inflation factor, and colinearity diagnostics (eigenvalues and condition index). Final models included significant and noncolinear clinical variables. Comparison of quartile risk stratifications according to CAC score and HbA1c level in relationship to PVI was performed with χ2 analysis. P < .05 was considered indicative of a significant difference.
Results
Clinical Characteristics
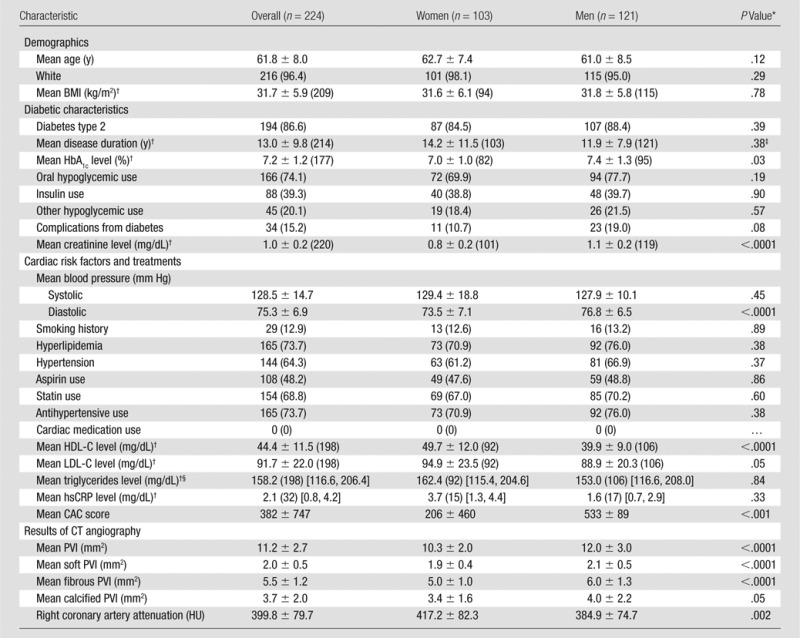
There were 224 patients in the CT angiography arm of the Factor-64 study (121 men [54%]; 216 white patients [96.4%]; average age, 61.8 years ± 8) (Table 1). All patients had diabetes; 194 of the 224 patients (86.6%) had type 2 diabetes. The mean disease duration was 13.0 years ± 9.8. The mean HbA1c level was 7.2% ± 1.2. Eighty-eight of the 224 patients (39.3%) used insulin, and a history of diabetic complications was present in 34 patients (15.2%). One hundred sixty-five of the 224 patients (73.7%) had hyperlipidemia, and 144 (64.3%) had hypertension. Statins were used by 154 of the 224 patients (68.8%). Only 29 of the 224 patients (12.9%) had a history of smoking. The mean hsCRP level was within normal limits at 2.1 mg/L (95% confidence interval: 0.8, 4.2). The mean BMI was 31.7 kg/m2 ± 5.9.
Table 1.
Summary of Patient Characteristics
Note.—Except where indicated, data are numbers of patients, with percentages in parentheses. BMI = body mass index.
P values refer to comparison between sexes.
Numbers in parentheses are the number of patients in whom data were obtained.
Log-transformed years.
Numbers in brackets are 95% confidence intervals.
The mean CAC score was 206 ± 460 in women and 533 ± 89 in men. The mean proximal PVI was 11.2 mm2 ± 2.7, with 18% soft plaque, 49% fibrous plaque, and 33% calcified plaque (Table 1). The proximal PVI was greater in men than in women (P < .0001), but the relative composition of the plaque was similar between men and women.
Reproducibility Analysis
Intrareader reproducibility was evaluated for two readers (A.C.K. and G.C.). There was approximately 2 months between initial and subsequent reading sessions. Intrareader agreement was excellent, with all correlation coefficients greater than 0.93 (Table E1 [online]). Interreader agreement for three independent readers (A.C.K., G.C., C.T.S.) was excellent for both total PVI and proximal PVI (intraclass correlation coefficient = 0.96 and 0.97, respectively). Soft plaque quantification had strong reproducibility (intraclass correlation coefficient = 0.96 and 0.97 for total and proximal plaque, respectively).
Proximal versus Full Coronary Artery Segmentation for Plaque Volume
The mean total PVI and proximal PVI was 8.1 mm2 ± 1.6 and 10.3 mm2± 2.0, respectively (P < .0001) (n = 104 patients). Plaque analysis times were approximately 3.5 times lower for proximal segment versus full coronary artery analysis (6.4 minutes ± 1.8 vs 22.8 minutes ± 4.2, respectively; P < .0001). The correlation coefficient between proximal and full coronary segmentation for PVI was r = 0.82 (P < .0001). The correlation between proximal and full coronary artery segmentation in the nondiabetic control group was similar to that in the diabetic group (r = 0.80, P < .001) (Table E2 [online]). The correlation between traditional risk factors (age, cholesterol level, CAC score, creatinine level) and plaque volume was stronger for proximal plaque versus total plaque. In addition, the CAC score showed a higher correlation with proximal plaque index versus total plaque index (r = 0.57 vs 0.47, respectively; P < .001). Because of these relationships, the proximal coronary artery PVI was used in subsequent analyses. Of 896 proximal coronary segments, seven were excluded owing to motion artifact. One L1 segment was not present as an anatomic variant.
Cardiovascular Risk Factors Associated with Plaque Quantification
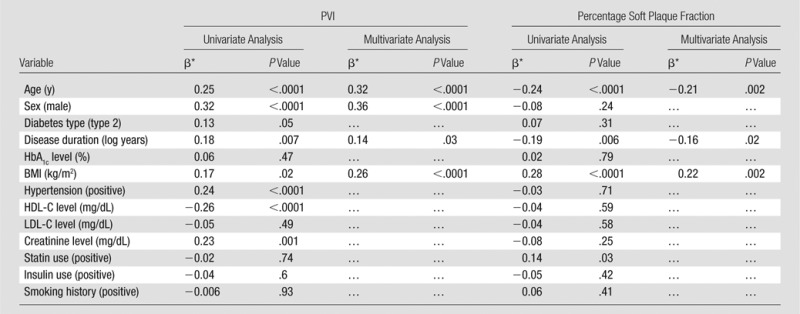
PVI.—At univariate analysis, PVI was associated with age, male sex, type 2 diabetes, disease duration, BMI, hypertension, HDL-C level, and creatinine level (P ≤ .03 for all) (Table 2). In the fully adjusted model, age, male sex, and BMI remained significant and were stronger predictors than in the univariate analysis (age: β = 0.32 [0.86 mm2 per 8 years], P < .0001; male sex: β = 0.36 [0.97 mm2 greater in men], P < .0001; BMI: β = 0.26 [0.70 mm2 per 5.9 kg/m2], P < .0001; disease duration: β = 0.14 [0.38 mm2 per 0.7 log year], P = .03). PVI increased between categories of BMI from normal weight (10.1 mm2 ± 2.1) to obese (10.9 mm2 ± 2.7) to overweight (11.5 mm2 ± 2.8) categories (P = .049).
Table 2.
Univariate and Multivariate Predictors of PVI and Percentage Soft Plaque
Note.—Standard deviations for the variables are as follows: PVI = 2.7 mm2, percentage soft plaque fraction = 4.4%, age = 8.0 years, HbA1c level = 1.2%, BMI = 5.9 kg/m2, HDL-C level = 11.5 mg/dL, LDL-C level = 22.0 mg/dL, creatinine level = 0.2 mg/dL, disease duration = 0.7 log year. The R2 values for the multivariable models were 0.25 and 0.14 for PVI and percentage soft fraction, respectively.
Data are standardized β coefficients.
Percentage soft plaque fraction.—The percentage soft plaque fraction was inversely associated with age and disease duration but positively associated with BMI and statin use. In the fully adjusted model, age (β = −0.21, P = .002), BMI (β = 0.22, P = .002), and disease duration (β = 0.16, P = .02) were significant predictors of percentage soft plaque fraction (Table 2).
Percentage fibrous and calcified plaque fraction.—Percentage fibrous plaque fraction was inversely associated with age and positively associated with BMI (P < .001 and P = .05, respectively). Percentage calcified plaque fraction was also associated with age and BMI (P < .001 and P = .004, respectively) (Table E3 [online]).
Sensitivity analysis.—A sensitivity analysis was done to assess the possible effects of CT beam hardening and variation in coronary artery lumen density on plaque volume. Right coronary artery lumen density was unrelated to PVI (P = .73). The addition of lumen density to the final regression models did not affect the relationship between BMI and PVI. With right coronary artery density as an additional covariate, the relationship of BMI and percentage soft plaque composition was attenuated but remained significant (β = 0.17, P = .01) (Table E4 [online]).
Comparison of CAC Score and PVI
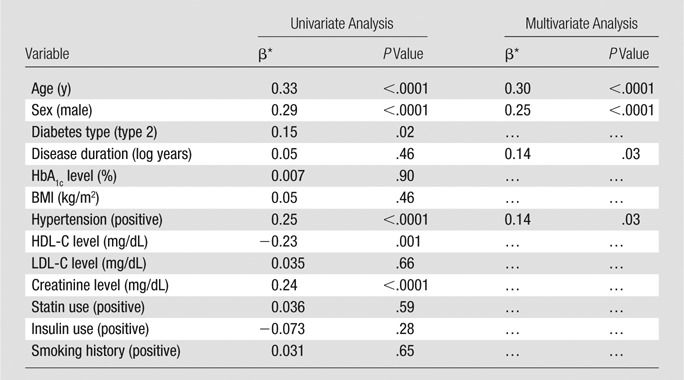
In the fully adjusted model, significant predictors of CAC score were age (β = 0.30, P < .0001), male sex (β = 0.25, P < .0001), log-years of disease duration (β = 0.14, P = .03), and hypertension (β = 0.14, P = .03); BMI was not a significant predictor of CAC score (Table 3).
Table 3.
Univariate and Multivariate Predictors of CAC Score
Note.—The CAC score was log+1 transformed. Standard deviations for the variables are as follows: age = 8.0 years, HbA1c level = 1.2%, BMI = 5.9 kg/m2, HDL-C level = 11.5 mg/dL, LDL-C level = 22.0 mg/dL, creatinine level = 0.2 mg/dL, disease duration = 0.7 log year. The R2 for the multivariable model was 0.18.
Data are standardized β coefficients.
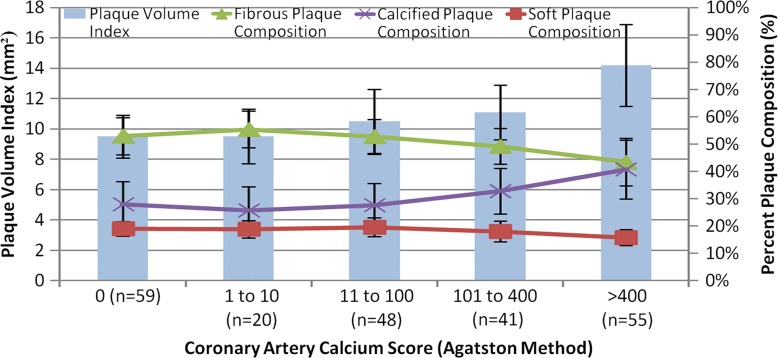
Figure 4 shows the relationship between PVI and CAC score. The overall correlation between these two indexes was moderate (r = 0.47–0.57, P < .05). As PVI increased, the percentage of calcified plaque also increased; however, the percentage of noncalcified plaque was relatively consistent across the full range of calcium scores. Thus, the soft plaque index was relatively higher for lower CAC scores compared with higher CAC scores.
Figure 4:
Bar chart shows PVI and composition according to CAC score.
To compare CAC and PVI, we determined whether a patient in the lowest quartile of CAC score was also in the lowest quartile of PVI. This comparison was also done for the second to fourth CAC and PVI quartiles. For CAC, quartile ranges were CAC scores of 0 (n = 59), 1–59 (n = 53), 59–397 (n = 53), and more than 397 (n = 56).
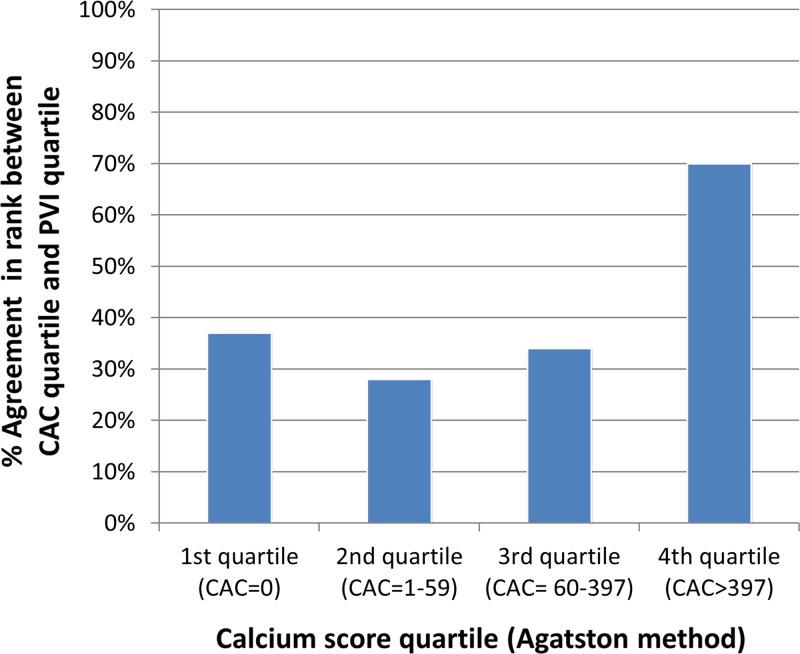
Overall, there was a discrepancy in the rank quartile classification between PVI and CAC score in 128 of the 224 patients (57%) (P < .0001). Patients with intermediate amounts of plaque in the second quartile of CAC (score, 1–59) were most likely not to have a PVI in the second quartile (28% quartile rank agreement between CAC score and PVI) (Fig 5). The greatest agreement between CAC score and PVI was in the highest quartile of CAC (69% agreement). Compared with patients without discrepancies between CAC and PVI quartile rank, patients with discrepancies between CAC and PVI quartiles had greater HbA1c (7.0% ± 1.0 vs 7.4% ± 1.3, respectively; P = .04) and hsCRP (1.2 mg/dL vs 3.9 mg/dL, respectively; P = .01) levels. Patients with such discrepancies also had a higher percentage of soft and fibrous plaque compare with patients without such discrepancies (18.7% ± 3.3 vs 17.4% ± 3.5 [P = .008] and 52.2% ± 7.2 vs 47.2% ± 8.8 [P < .0001], respectively).
Figure 5:
Bar chart show percentage agreement between quartile rank of CAC score and PVI. Patients with intermediate CAC scores (second and third quartiles) show lowest agreement with PVI quartile (28% and 34%, respectively). There was a discrepancy in rank quartile classification between PVI and CAC score in 128 of 224 patients (57%) (P < .001).
Discussion
Diabetic patients have a propensity for extensive and premature development of coronary artery plaque. Monitoring of coronary plaque has previously been possible only with invasive techniques. In this study, we demonstrate that measurement of both calcified and noncalcified plaque with coronary CT angiography is reproducible. The extent of plaque in asymptomatic diabetic patients is related to BMI and duration of diabetes. BMI was also associated with a greater percentage of soft plaque. The correlation between total coronary plaque and CAC score was expected, although this was only moderate in degree. Only about one-third of coronary plaque showed calcification, which further suggests a strong role for coronary CT angiography in the assessment of the biologic determinates of plaque in diabetic patients. Important distinctions between CAC and PVI were revealed: for example, patients with relatively greater PVI but lower CAC score also had higher HbA1c and hsCRP levels.
To date, the primary use of coronary CT angiography has been to determine the degree of coronary artery stenosis before invasive angiography. However, quantitative coronary CT angiography plaque analysis is a relatively new but validated technology with respect to the reference standard of histologic examination and intravascular US (20,21). The primary challenges with coronary CT angiography plaque analysis have been time-consuming analysis, inadequate software tools, unclear reproducibility, and lack of biologic correlation. The current study and others show that these limitations are being overcome. For example, a recent study of 25 patients with acute coronary syndrome (22) found that measurement of total and noncalcified plaque volume with coronary CT angiography had benefit over conventional coronary CT angiography measurements (CAC and coronary stenosis, plaque morphology). In that study, patients who developed acute coronary syndrome over a mean of approximately 2 years had a significantly greater risk score when considering coronary CT angiography plaque features in addition to Framingham risk score alone (24,25).
We found that BMI was the only modifiable risk factor associated with overall plaque index for diabetic patients. Elevated BMI was also an independent predictor of increased soft plaque. Our results are supported by several intravascular US studies in higher risk patients: Takeshita et al (26) reported that obesity (vs nonobesity) was associated with 10% greater degree of plaque volume in the left main coronary artery. In addition, baseline BMI was the only significant predictor of plaque volume progression assessed with intravascular US of an obstructing coronary lesion during pravastatin treatment (27). Labounty et al (28) recently reported registry results showing that symptomatic obese patients were more likely than nonobese patients to have any coronary artery disease at coronary CT angiography as well as to have obstructive coronary artery disease. Compared with intravascular US, coronary CT angiography offers a noninvasive approach to comprehensively assess multiple coronary arteries in lower-risk patients than may be otherwise interrogated with use of invasive angiography.
Diabetic patients may have extensive noncalcified plaque not otherwise revealed with the CAC score (29), and lipid-containing plaque is greater in diabetic patients than in nondiabetic patients (30,31). CAC score is not a useful marker for assessing the reduction of plaque as a result of therapy, likely because CAC does not accurately reflect a change in modifiable noncalcified plaque (32). Coronary CT angiography plaque measurement may address these weaknesses: PVI shows general consistency with CAC but does not appear to provide redundant information. In this study, approximately two-thirds of plaque volume was noncalcified, and the correlation between CAC and coronary CT angiography plaque index was only moderate (r = 0.47–0.57). The differences between CAC and PVI were greater in diabetic patients with low levels of CAC where CAC-based risk stratification is known to be poor and noncalcified plaque is more common (29). In addition to age and sex, CAC score was associated with hypertension, whereas plaque index was associated with BMI. Patients who had discrepant CAC and plaque index risk had biochemically different profiles in terms of glucose control and inflammatory markers. Further analysis of cardiovascular outcomes in relationship to coronary CT angiography plaque index will be needed to define the role of PVI versus CAC score.
Limitations of this study include a relatively homogeneous population from a single site, with limited racial variation. Family history of cardiovascular disease is an important risk factor but was unable to be comprehensively gathered in this cohort. Finally, patients with severe renal failure were not eligible for coronary CT angiography. Because patients were asymptomatic and otherwise considered to be at low risk, invasive testing was not appropriate. Measurement of plaque volume may be affected by technical factors such as tube voltage and contrast material injection rate. In addition, the test-retest reproducibility of the PVI has not been determined. In this study, we assessed cross-sectional associations between PVI and cardiovascular risk factors; a clinical trial would be necessary to determine if risk factor reduction would result in a reduction in PVI. Nevertheless, the coronary CT angiography techniques for the first time reveal the full extent of CAD in these diabetic patients with use of noninvasive methods.
At present, coronary CT angiography can routinely and noninvasively capture the full anatomic map of the coronary arteries in a single heartbeat with a low radiation dose. Information well beyond the presence or absence of coronary stenosis can be readily derived with coronary CT angiography. Coronary PVI at coronary CT angiography is clinically feasible and reproducible in patients with diabetes and may represent a novel method that could be routinely applied in at-risk patients. In diabetic patients, BMI—a modifiable risk factor—was significantly associated with both overall coronary plaque quantity and soft plaque composition. Further follow-up of this diabetic cohort is warranted to determine if coronary plaque assessment contributes to predictive risk assessment in this challenging patient population.
Advances in Knowledge
■ Measurement of total coronary plaque volume throughout the entire coronary tree is reproducible, with an intraclass correlation coefficient of 0.93–0.99.
■ Plaque volume index in the proximal coronary arteries is more closely related to calcium score than to total coronary plaque index (r = 0.57 vs 0.47, respectively; P < .001).
■ Major determinants of plaque in diabetic patients in addition to age and sex are body mass index (BMI) (P < .0001) and duration of diabetes (P = .03).
Implications for Patient Care
■ BMI was the primary modifiable risk factor associated with the plaque volume index.
■ Diabetic patients with greater BMI had proportionally greater soft plaque.
■ This study supports reduction of BMI as a therapeutic goal to reduce cardiovascular risk in diabetic patients.
PODCAST
APPENDIX
Received March 12, 2014; revision requested March 21; revision received March 26; final version accepted March 27.
Funding: Funded in part by the National Institutes of Health intramural research program. D.A.B. and C.T.S. are employees of the National Institutes of Health.
This research was made possible through the National Institutes of Health (NIH) intramural research program and the Medical Research Scholars Program, a public-private partnership supported jointly by the NIH, generous contributions to the Foundation for the NIH from Pfizer, the Leona M. and Harry B. Helmsley Charitable Trust, and the Howard Hughes Medical Institute, as well as other private donors. For a complete list, please visit the Foundation Web site at http://www.fnih.org/work/programs-development/medical-research-scholars-program.
Clinical trial registration no. NCT00488033.
Disclosures of Conflicts of Interest: A.C.K. No relevant conflicts of interest to disclose. H.T.M. Financial activities related to the present article: received a grant from Toshiba. Financial activities not related to the present article: none to disclose. Other relationships: none to disclose. G.C. No relevant conflicts of interest to disclose. C.T.S. No relevant conflicts of interest to disclose. B.D.R. No relevant conflicts of interest to disclose. J.A.C.L. Financial activities related to the present article: none to disclose. Financial activities not related to the present article: received a grant from Toshiba Medical. Other relationships: none to disclose. K.R. No relevant conflicts of interest to disclose. D.L.L. No relevant conflicts of interest to disclose. J.B.M. No relevant conflicts of interest to disclose. J.L.A. No relevant conflicts of interest to disclose. D.A.B. No relevant conflicts of interest to disclose.
Abbreviations:
- BMI
- body mass index
- CAC
- coronary artery calcium
- CORE-64
- Coronary Evaluation Using Multidetector CT Angiography Using 64 Detectors
- HbA1c
- hemoglobin A1c
- HDL-C
- high-density lipoprotein cholesterol
- hsCRP
- high-sensitivity C-reactive protein
- LDL-C
- low-density lipoprotein cholesterol
- PVI
- plaque volume index
References
- 1.Centers for Disease Control and Prevention. National diabetes fact sheet: national estimates and general information on diabetes and prediabetes in the United States , 2011. Atlanta, Ga: U.S. Department of Health and Human Services, Centers for Disease Control and Prevention, 2011. [Google Scholar]
- 2.Bonow RO, Bohannon N, Hazzard W. Risk stratification in coronary artery disease and special populations. Am J Med 1996;101(4A):A17S–A22S; discussion 22S–24S. [DOI] [PubMed] [Google Scholar]
- 3.Davis TM, Coleman RL, Holman RR; UKPDS Group. Prognostic significance of silent myocardial infarction in newly diagnosed type 2 diabetes mellitus: United Kingdom Prospective Diabetes Study (UKPDS) 79. Circulation 2013;127(9):980–987. [DOI] [PubMed] [Google Scholar]
- 4.Scognamiglio R, Negut C, Ramondo A, Tiengo A, Avogaro A. Detection of coronary artery disease in asymptomatic patients with type 2 diabetes mellitus. J Am Coll Cardiol 2006;47(1):65–71. [DOI] [PubMed] [Google Scholar]
- 5.Anand DV, Lim E, Hopkins D, et al. Risk stratification in uncomplicated type 2 diabetes: prospective evaluation of the combined use of coronary artery calcium imaging and selective myocardial perfusion scintigraphy. Eur Heart J 2006;27(6):713–721. [DOI] [PubMed] [Google Scholar]
- 6.Bax JJ, Young LH, Frye RL, Bonow RO, Steinberg HO, Barrett EJ.ADA. Screening for coronary artery disease in patients with diabetes. Diabetes Care 2007;30(10):2729–2736. [DOI] [PubMed] [Google Scholar]
- 7.Bax JJ, Bonow RO, Tschöpe D, Inzucchi SE, Barrett E; Global Dialogue Group for the Evaluation of Cardiovascular Risk in Patients With Diabetes. The potential of myocardial perfusion scintigraphy for risk stratification of asymptomatic patients with type 2 diabetes. J Am Coll Cardiol 2006;48(4):754–760. [DOI] [PubMed] [Google Scholar]
- 8.Greenland P, LaBree L, Azen SP, Doherty TM, Detrano RC. Coronary artery calcium score combined with Framingham score for risk prediction in asymptomatic individuals. JAMA 2004;291(2):210–215. [DOI] [PubMed] [Google Scholar]
- 9.Polonsky TS, McClelland RL, Jorgensen NW, et al. Coronary artery calcium score and risk classification for coronary heart disease prediction. JAMA 2010;303(16):1610–1616. [DOI] [PMC free article] [PubMed] [Google Scholar]
- 10.Shaw LJ, Raggi P, Schisterman E, Berman DS, Callister TQ. Prognostic value of cardiac risk factors and coronary artery calcium screening for all-cause mortality. Radiology 2003;228(3):826–833. [DOI] [PubMed] [Google Scholar]
- 11.Yeboah J, McClelland RL, Polonsky TS, et al. Comparison of novel risk markers for improvement in cardiovascular risk assessment in intermediate-risk individuals. JAMA 2012;308(8):788–795. [DOI] [PMC free article] [PubMed] [Google Scholar]
- 12.Detrano R, Guerci AD, Carr JJ, et al. Coronary calcium as a predictor of coronary events in four racial or ethnic groups. N Engl J Med 2008;358(13):1336–1345. [DOI] [PubMed] [Google Scholar]
- 13.Wong ND, Nelson JC, Granston T, et al. Metabolic syndrome, diabetes, and incidence and progression of coronary calcium: the Multiethnic Study of Atherosclerosis study. JACC Cardiovasc Imaging 2012;5(4):358–366. [DOI] [PMC free article] [PubMed] [Google Scholar]
- 14.Agarwal S, Cox AJ, Herrington DM, et al. Coronary calcium score predicts cardiovascular mortality in diabetes: diabetes heart study. Diabetes Care 2013;36(4):972–977. [DOI] [PMC free article] [PubMed] [Google Scholar]
- 15.Youssef G, Budoff MJ. Coronary artery calcium scoring, what is answered and what questions remain. Cardiovasc Diagn Ther 2012;2(2):94–105. [DOI] [PMC free article] [PubMed] [Google Scholar]
- 16.Nair A, Kuban BD, Tuzcu EM, Schoenhagen P, Nissen SE, Vince DG. Coronary plaque classification with intravascular ultrasound radiofrequency data analysis. Circulation 2002;106(17):2200–2206. [DOI] [PubMed] [Google Scholar]
- 17.Leber AW, Becker A, Knez A, et al. Accuracy of 64-slice computed tomography to classify and quantify plaque volumes in the proximal coronary system: a comparative study using intravascular ultrasound. J Am Coll Cardiol 2006;47(3):672–677. [DOI] [PubMed] [Google Scholar]
- 18.Sun J, Zhang Z, Lu B, et al. Identification and quantification of coronary atherosclerotic plaques: a comparison of 64-MDCT and intravascular ultrasound. AJR Am J Roentgenol 2008;190(3):748–754. [DOI] [PubMed] [Google Scholar]
- 19.Papadopoulou SL, Neefjes LA, Schaap M, et al. Detection and quantification of coronary atherosclerotic plaque by 64-slice multidetector CT: a systematic head-to-head comparison with intravascular ultrasound. Atherosclerosis 2011;219(1):163–170. [DOI] [PubMed] [Google Scholar]
- 20.Voros S, Rinehart S, Qian Z, et al. Prospective validation of standardized, 3-dimensional, quantitative coronary computed tomographic plaque measurements using radiofrequency backscatter intravascular ultrasound as reference standard in intermediate coronary arterial lesions: results from the ATLANTA (assessment of tissue characteristics, lesion morphology, and hemodynamics by angiography with fractional flow reserve, intravascular ultrasound and virtual histology, and noninvasive computed tomography in atherosclerotic plaques) I study. JACC Cardiovasc Interv 2011;4(2):198–208. [DOI] [PubMed] [Google Scholar]
- 21.Voros S, Rinehart S, Qian Z, et al. Coronary atherosclerosis imaging by coronary CT angiography: current status, correlation with intravascular interrogation and meta-analysis. JACC Cardiovasc Imaging 2011;4(5):537–548. [DOI] [PubMed] [Google Scholar]
- 22.Versteylen MO, Kietselaer BL, Dagnelie PC, et al. Additive value of semiautomated quantification of coronary artery disease using cardiac computed tomographic angiography to predict future acute coronary syndrome. J Am Coll Cardiol 2013;61(22):2296–2305. [DOI] [PubMed] [Google Scholar]
- 23.Brodoefel H, Burgstahler C, Heuschmid M, et al. Accuracy of dual-source CT in the characterisation of non-calcified plaque: use of a colour-coded analysis compared with virtual histology intravascular ultrasound. Br J Radiol 2009;82(982):805–812. [DOI] [PMC free article] [PubMed] [Google Scholar]
- 24.Rinehart S, Vazquez G, Qian Z, Murrieta L, Christian K, Voros S. Quantitative measurements of coronary arterial stenosis, plaque geometry, and composition are highly reproducible with a standardized coronary arterial computed tomographic approach in high-quality CT datasets. J Cardiovasc Comput Tomogr 2011;5(1):35–43. [DOI] [PubMed] [Google Scholar]
- 25.Miller JM, Dewey M, Vavere AL, et al. Coronary CT angiography using 64 detector rows: methods and design of the multi-centre trial CORE-64. Eur Radiol 2009;19(4):816–828. [DOI] [PMC free article] [PubMed] [Google Scholar]
- 26.Takeshita H, Shimada Y, Kobayashi Y, et al. Impact of body mass index and Framingham risk score on coronary artery plaque. Osaka City Med J 2008;54(1):31–39. [PubMed] [Google Scholar]
- 27.Tani S, Nagao K, Anazawa T, et al. Association of body mass index with coronary plaque regression: 6-month prospective study. J Atheroscler Thromb 2009;16(3):275–282. [DOI] [PubMed] [Google Scholar]
- 28.Labounty TM, Gomez MJ, Achenbach S, et al. Body mass index and the prevalence, severity, and risk of coronary artery disease: an international multicentre study of 13,874 patients. Eur Heart J Cardiovasc Imaging 2013;14(5):456–463. [DOI] [PMC free article] [PubMed] [Google Scholar]
- 29.Scholte AJ, Schuijf JD, Kharagjitsingh AV, et al. Prevalence of coronary artery disease and plaque morphology assessed by multi-slice computed tomography coronary angiography and calcium scoring in asymptomatic patients with type 2 diabetes. Heart 2008;94(3):290–295. [DOI] [PubMed] [Google Scholar]
- 30.Nasu K, Tsuchikane E, Katoh O, et al. Plaque characterisation by Virtual Histology intravascular ultrasound analysis in patients with type 2 diabetes. Heart 2008;94(4):429–433. [DOI] [PubMed] [Google Scholar]
- 31.Kato K, Yonetsu T, Kim SJ, et al. Comparison of nonculprit coronary plaque characteristics between patients with and without diabetes: a 3-vessel optical coherence tomography study. JACC Cardiovasc Interv 2012;5(11):1150–1158. [DOI] [PubMed] [Google Scholar]
- 32.Schmermund A, Achenbach S, Budde T, et al. Effect of intensive versus standard lipid-lowering treatment with atorvastatin on the progression of calcified coronary atherosclerosis over 12 months: a multicenter, randomized, double-blind trial. Circulation 2006;113(3):427–437. [DOI] [PubMed] [Google Scholar]
Associated Data
This section collects any data citations, data availability statements, or supplementary materials included in this article.


