Magnetic susceptibility of a multiple sclerosis (MS) lesion increased rapidly as it changed from enhanced to nonenhanced, it attained a high susceptibility value relative to normal-appearing white matter (NAWM) during its initial few years (approximately 4 years), and it gradually dissipated back to a susceptibility value similar to that of NAWM as it aged further, which may provide new insight into the pathophysiologic features of MS lesions.
Abstract
Purpose
To assess multiple sclerosis (MS) lesions at various ages by using quantitative susceptibility mapping (QSM) and conventional magnetic resonance (MR) imaging.
Materials and Methods
Retrospectively selected were 32 clinically confirmed MS patients (nine men and 23 women; 39.3 years ± 10.9) who underwent two MR examinations (interval, 0.43 years ± 0.16) with three-dimensional gradient-echo sequence from August 2011 to August 2012. To estimate the ages of MS lesions, MR examinations performed 0.3–10.6 years before study examinations were studied. Hyperintensity on T2-weighted images was used to define MS lesions. QSM images were reconstructed from gradient-echo data. Susceptibility of MS lesions and temporal rates of change were obtained from QSM images. Lesion susceptibilities were analyzed by t test with intracluster correlation adjustment and Bonferroni correction in multiple comparisons.
Results
MR imaging of 32 patients depicted 598 MS lesions, of which 162 lesions (27.1%) in 23 patients were age measurable and six (1.0%) were only visible at QSM. The susceptibilities relative to normal-appearing white matter (NAWM) were 0.53 ppb ± 3.34 for acute enhanced lesions, 38.43 ppb ± 13.0 (positive; P < .01) for early to intermediately aged nonenhanced lesions, and 4.67 ppb ± 3.18 for chronic nonenhanced lesions. Temporal rates of susceptibility changes relative to cerebrospinal fluid were 12.49 ppb/month ± 3.15 for acute enhanced lesions, 1.27 ppb/month ± 2.31 for early to intermediately aged nonenhanced lesions, and −0.004 ppb/month ± 0 for chronic nonenhanced lesions.
Conclusion
Magnetic susceptibility of MS lesions increased rapidly as it changed from enhanced to nonenhanced, it attained a high susceptibility value relative to NAWM during its initial few years (approximately 4 years), and it gradually dissipated back to susceptibility similar to that of NAWM as it aged, which may provide new insight into pathophysiologic features of MS lesions.
© RSNA, 2013
Introduction
Magnetic resonance (MR) imaging is a valuable tool for diagnosis of and to monitor multiple sclerosis (MS), but it depicts a white matter lesion load that is poorly correlated with clinical disability (1,2). Considerable effort has been made to develop imaging techniques that accurately reflect the underlying pathophysiologic information to monitor MS progression.
Abnormally high iron deposition has been reported in both the basal ganglia and lesions in MS patients (3–7). Oligodendrocytes and activated macrophages or microglia may be cellular sources of iron in normal-appearing white matter (NAWM) and white matter lesions (8). However, it is noted that not all MS lesions have iron deposition (5,9) and not all macrophages or microglia contain iron (8), which indicates that iron deposition may vary among individual lesions based on their age and inflammatory status. For this reason, iron deposition may be a new biomarker for MS.
Paramagnetic iron causes an increase in tissue susceptibility, which can be detected by using MR imaging (5,10,11). Although phase MR imaging has been used to characterize the susceptibility change in MS (2,5,7,12,13), its nonlocal property and dependence on imaging parameters (14,15) prevent it from being a direct measure for local tissue susceptibility. Quantitative susceptibility mapping (QSM) solves the field-to-susceptibility source inverse problem by spatially deconvolving the MR imaging phase data (16–18), which therefore enables a direct measure of tissue susceptibility that is a physical quantity independent of imaging parameters and a potential tissue biomarker (10,11,14). The purpose of this retrospective longitudinal study is to assess MS lesions at various ages by using QSM and conventional MR imaging.
Materials and Methods
Patients
We retrospectively reviewed the MR imaging database in our institution’s clinical picture archiving and communication system and identified patients who were clinically confirmed to have MS and who underwent two MR examinations, including a three-dimensional gradient-echo sequence, as part of the current standard-of-care MR imaging at our institution from August 2011 to August 2012. A total of 34 MS patients were retrospectively selected in this institutional review board–approved study. Two patients were excluded because of incomplete data in the picture archiving and communication system; therefore, we selected a subset of 32 MS patients (nine men and 23 women, aged 22–61 years; mean age, 39.30 years ± 10.92 [standard deviation]). All 32 patients were relapsing-remitting MS patients who had expanded disability status scale scores that ranged from 0 to 6 (median disability status scale score, 2) and disease durations that ranged from 2 to 32 years (7.31 years ± 7.05).
All patients in this study were on immunomodulatory therapy per the standard of care for patients with MS. The interval between the two MR examinations ranged from 0.1 to 0.74 years (0.43 years ± 0.16). For each patient, the two MR examinations from that period and all available MR examinations that were in the picture archiving and communication system from the previous 0.3–10.6 years were included to form a MR imaging time course for analysis of each lesion. All images in the MR imaging time course were coregistered by using software (FMRIB Linear Image Registration Tool; FMRIB Image Analysis Group, Oxford, England) (19).
Imaging Protocol and Reconstruction
MR imaging was performed with a 3-T MR imager (Signa HDxt; GE Healthcare, Milwaukee, Wis). Table 1 shows the sequences and imaging parameters. Conventional MR imaging included T2-weighted imaging and T1-weighted images acquired before and after administration of gadolinium chelate. QSM was reconstructed from the data acquired with the three-dimensional T2*-weighted multi-echo spoiled gradient-echo sequence (20,21).
Table 1.
Imaging Sequences and Parameters
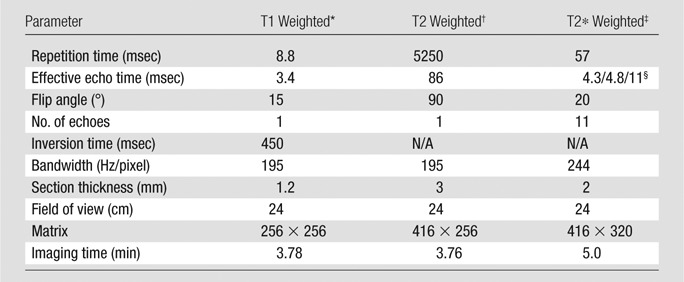
Pre- and postgadolinium chelate three-dimensional inversion recovery–prepared T1-weighted fast spoiled gradient-echo sequences.
Axial T2-weighted fast spin-echo sequences.
Three-dimensional T2*-weighted spoiled multi-echo gradient-echo sequences.
First echo time/echo time spacing/number of echoes.
Imaging Analysis
T2 hyperintense lesions on T2-weighted images in any MR examination in the MR imaging time course were assumed to be MS lesions. White matter regions without an abnormal signal on images that were T2 weighted, T1 weighted, and T1 weighted after administration of gadolinium chelate were assumed to be NAWM. Three neuroradiologists (W.C., A.G., and J.C., with 10, 16, and 7 years of experience, respectively) reviewed all images in the MR imaging time course together, with differences resolved by consensus. They characterized lesions based on image features relative to NAWM (T1 hypointense or isointense on T1-weighted images; gadolinium chelate enhanced or nonenhanced on images acquired after administration of gadolinium chelate; QSM hyperintense or isointense) and determined the first appearance of each lesion in the MR imaging time course.
Lesion Age Estimation
For each lesion in the MR imaging time course, its first available MR imaging in the picture archiving and communication system was defined, its first appearance on the MR image was defined, its appearance on an MR image with the first QSM was defined and referred to as QSM1, and its appearance on an MR image with the second QSM was defined and referred to as QSM2. The age of a lesion was defined as the time between its first appearance on an MR image and QSM1. The maximum age error for a lesion was defined as the time between its first appearance on an MR image and the preceding MR image. The interval between the two QSM scans was the time between QSM1 and QSM2. For a lesion already present on the first available MR image, its age could only be determined as longer than the duration of the time course, and it was excluded from further age related analysis if it was not older than 10 years (approximately the longest measurable age in this study).
Lesion Categorization
MS lesions with estimated ages were categorized as T1 black holes or contrast agent–enhanced lesions according to radiologic standards (22–24). Specifically, a T1-hypointense and gadolinium chelate–enhanced lesion was designated as an acute black hole at the time point of the MR examination. An acute black hole that turned into T1 isointense and gadolinium chelate nonenhanced but remained T2 hyperintense in the patient’s next available MR image was designated as a transient black hole at the later time point. If an acute black hole disappeared (T1 isointense, gadolinium chelate nonenhanced, and T2 isointense) in the patient’s next available MR examination, it was designated as a transient lesion on conventional MR images at that later time point. A T1-hypointense and gadolinium chelate–nonenhanced lesion that persisted for at least 6 months was designated as a persistent black hole at that time point (22,23). A T1-hypointense and gadolinium chelate–nonenhanced lesion that persisted for less than 6 months was designated as an unclassifiable black hole at that time point. A contrast-enhanced lesion that was from NAWM and did not overlap an existing lesion on the MR image was identified as a new contrast-enhanced lesion (24). A contrast-enhanced lesion that emerged entirely or partially from a T2-hyperintense lesion present on a prior MR examination was identified as a recontrast-enhanced lesion (24).
MS lesions with estimated ages were also categorized according to their ages and enhancement. Lesions that were aged 0 years and enhanced were designated as acute enhanced lesions. Lesions that were aged 0–4 years and nonenhanced were designated as early to intermediately aged nonenhanced lesions. Lesions that were older than 7 years and nonenhanced were designated as chronic nonenhanced lesions.
Lesion Susceptibility and Volume Measurement
One neuroradiologist (W.C., 10 years of experience) semiautomatically segmented the MS lesions on the T2-weighted and QSM images from QSM1 and QSM2 by using an in-house region-of-interest (ROI) tool. If a lesion was inconspicuous on QSM, its ROI on a T2-weighted image was overlaid onto the QSM image and revised manually to eliminate the inclusion of veins or obvious artifacts. The three-dimensional ROI of a lesion was defined by compounding two-dimensional lesion boundaries segmented on consecutive sections. The ROI for NAWM was drawn on the contralateral mirror of the ROI or the surrounding white matter of a lesion when the contralateral mirror happened to be another lesion. NAWM ROIs were carefully drawn on QSM to avoid accidental inclusion of any lesions, and the ROIs were verified on T2-weighted images.
The susceptibility of cerebrospinal fluid (CSF) was also estimated from lateral ventricles by identifying a region with pure CSF. To quantify difference observed in QSM images, the susceptibility of a lesion, NAWM, or CSF was obtained (in parts per billion) as the total susceptibility in its ROI divided by the ROI volume. To eliminate possible constant offsets in susceptibility maps, lesion susceptibilities in a patient were obtained as their susceptibility differences from the susceptibility of the CSF. The change in lesion susceptibility relative to CSF divided by the time lapse (in months) between QSM1 and QSM2 was calculated as the temporal rate of susceptibility change (parts per billion per month). The lesion volumes on QSM and T2-weighted images were recorded for lesions that appeared hyperintense on both QSM and T2-weighted images.
Statistical Analysis
Statistical analyses were performed by using statistical software (SAS, Windows version 9.3; SAS Institute, Cary, NC). The differences in susceptibility between NAWM and lesions and between CSF and lesions at various lesion ages were assessed by t test with intracluster correlation adjustment to correct for multiple lesions within the same patient (25). The intracluster correlation was defined as the ratio of two variance components (within and between patient) and was estimated with statistical software by running a mixed model analysis on the null model and specifying repeated measures for each subject and random intercept.
The difference in the temporal rate of susceptibility change of MS lesions at various ages was compared by t test with intracluster correlation adjustment to correct for multiple lesions within the same patient and with Bonferroni correction for multiple comparisons. The volumes of lesions on QSM and T2-weighted images were compared by paired sample t tests with intracluster correlation adjustment to correct for multiple lesions within the same patient. Summary statistical results are presented as mean ± standard deviation.
Results
In this study, a total of 598 unique MS lesions in 32 patients were detected, including 10 (1.7%) enhanced lesions and 588 (98.3%) nonenhanced lesions. Of the 10 enhanced lesions, eight lesions (80.0%) appeared QSM isointense and two lesions (20.0%) appeared QSM hyperintense. Of the 588 nonenhanced lesions, 144 lesions (24.5%) appeared QSM isointense and 444 lesions (75.5%) appeared QSM hyperintense. Of the 598 detected MS lesions, 162 lesions (27.1%) in 23 patients had sufficient MR imaging data to allow age estimation. Ten lesions were excluded from further analysis because their maximal age errors were larger than 2 years. However, we included lesions that were older than 10 years to demonstrate the trend at a late stage, though their exact age errors were not determinable. Of 152 lesions, 41 (27.0%) were cortical or subcortical, and 111 (73.0%) were in white matter. Because 17 lesions were initially detected on the last MR examination (only QSM1), QSM1 analyses of lesion magnetic susceptibility were performed on 152 lesions, and QSM2 and temporal change analyses of lesion susceptibility were performed on 135 lesions. Quantitative data are plotted in Figures 1–3 and are summarized in Table 2; example images are shown in Figures 4–6. Additional example images are included in Figures E1–E4 (online).
Figure 1:
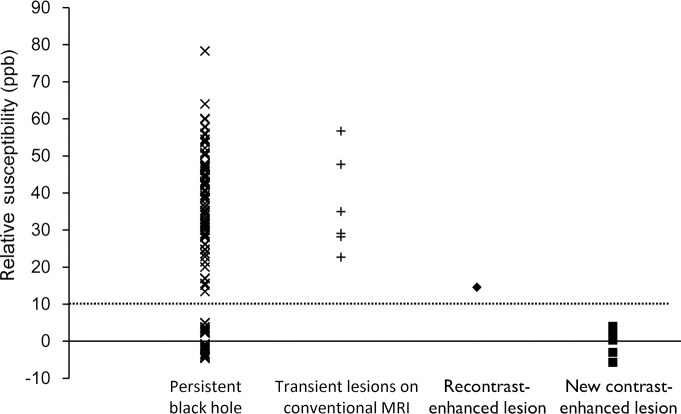
Graph of lesion susceptibility (relative NAWMs) versus category. The susceptibilities of persistent black holes fall into two groups: one group consists of 92 lesions with values from 13.4 to 78.3 ppb (39.4 ppb ± 12.4) and the other group consists of 27 lesions with values from −4.6 to 5.0 ppb (0.2 ppb ± 3.4). The susceptibilities of six transient lesions at conventional MR imaging and two recontrast-enhanced lesions were 22.7–56.7 ppb and 14.5–14.6 ppb. The susceptibilities of eight new contrast-enhanced lesions were from −5.7 to 4.0 ppb (0.5 ppb ± 3.3). A dotted line at 10 ppb is drawn to show distribution of the susceptibilities of these lesion groups. × = data point for persistent black hole, + = data point for transient lesions on conventional MR image, ◆ = data point for recontrast-enhanced lesions, ■ = data point for new contrast-enhanced lesions.
Figure 3:
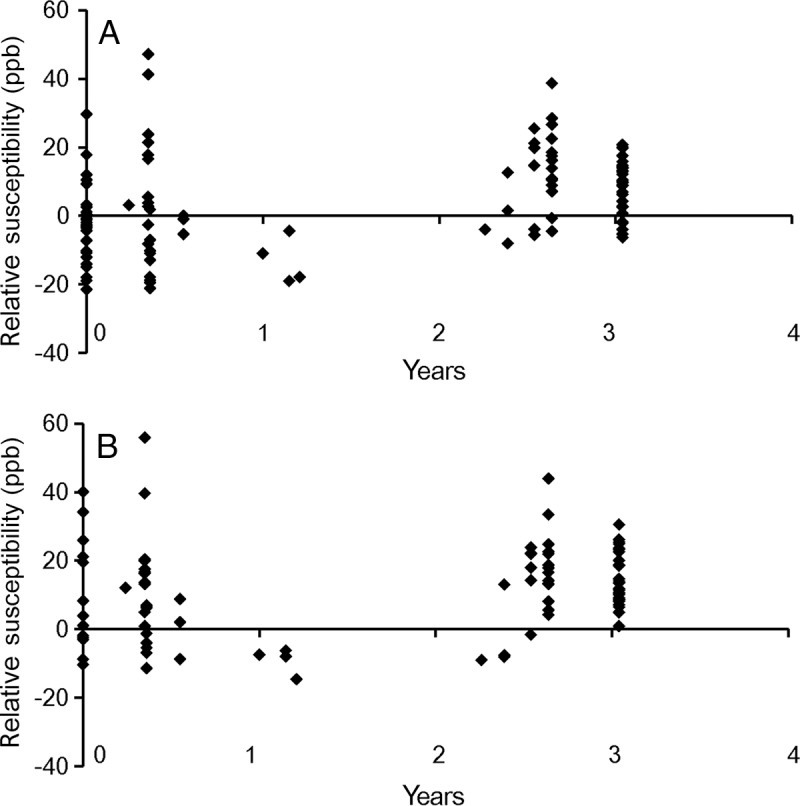
Scatterplot of susceptibilities of early to intermediately aged nonenhanced lesions (relative to CSF) at, A, QSM1 and, B, QSM2. ppb = parts per billion.
Table 2.
Quantitative Susceptibility and Its Temporal Rate by MS Lesion Age

Note.—Data in parentheses are mean ± standard deviation. Age errormax = maximum age error for a lesion. ppb = parts per billion.
Of 58 lesions that were between 0 and 2 years old, 17 lesions had only QSM1 because they were detected at the last MR examination in the MR imaging time course. Therefore, they were not available to measure relative susceptibility in QSM2 and calculate the temporal rate of susceptibility increase.
Figure 4:
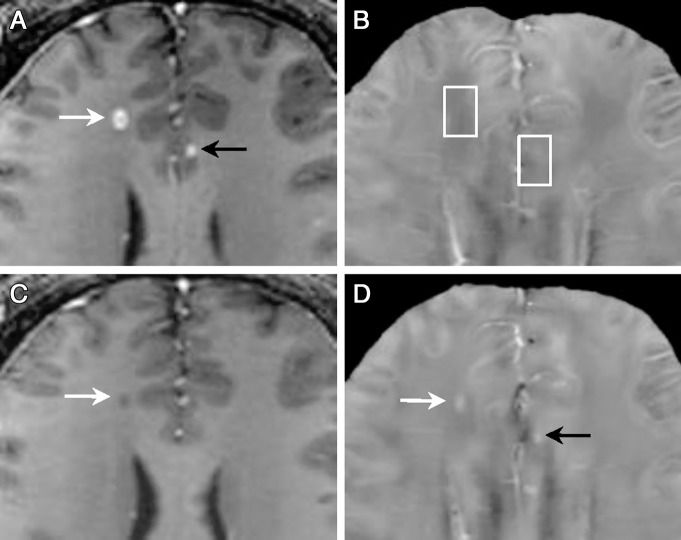
MR images of acute enhanced lesions in a 32-year-old man with relapsing-remitting MS. A, T1-weighted image acquired after administration of gadolinium chelate and, B, QSM at QSM1. C, T1-weighted image acquired after administration of gadolinium chelate and, D, QSM at QSM2 (3 months later). Two acute enhanced lesions (A, arrows) appeared QSM isointense (B, boxes), which indicated that their susceptibilities were similar to NAWM. Three months later, both changed into QSM hyperintense (D, arrows), which indicated that their susceptibilities increased compared with NAWM. One was still T1 hypointense (C, arrow), the other recovered to normal appearance on images that were T2 weighted, T1 weighted, and T1 weighted after administration of gadolinium chelate (Fig E4 [online]) but appeared hyperintense on QSM (D, black arrow), which suggested that QSM can detect MS lesions that are not detectable on conventional MR images.
Figure 6:
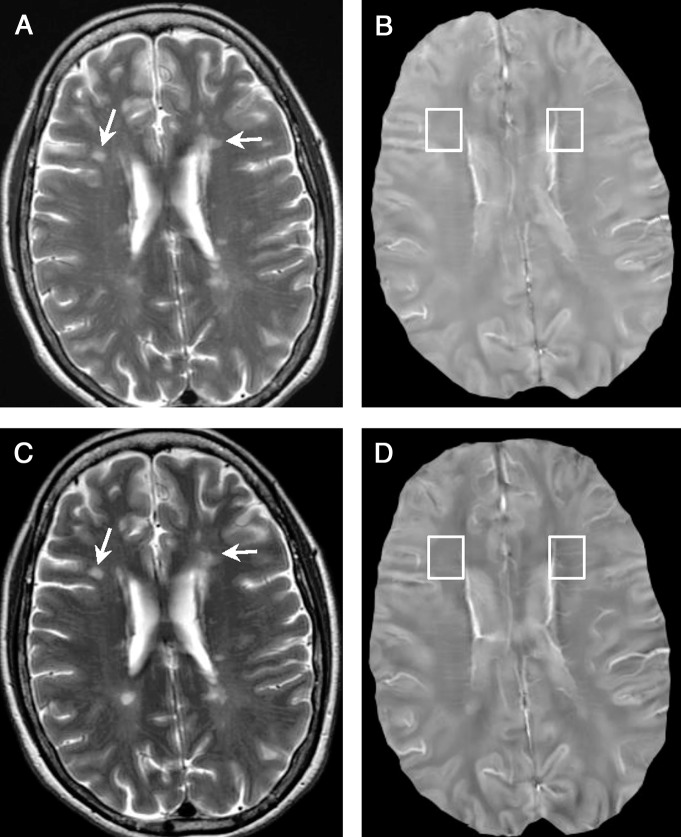
Examples of chronic nonenhanced lesions (arrows) in a 50-year-old woman with relapsing-remitting MS. A, T2-weighted image and, B, QSM at QSM1. C, T2-weighted image and, D, QSM at QSM2 (5.5 months later). Two lesions older than 10 years were detected (A, arrows). They appeared isointense on both QSMs (B and D, boxes), which indicated that their susceptibilities were close to NAWM.
Figure 5:
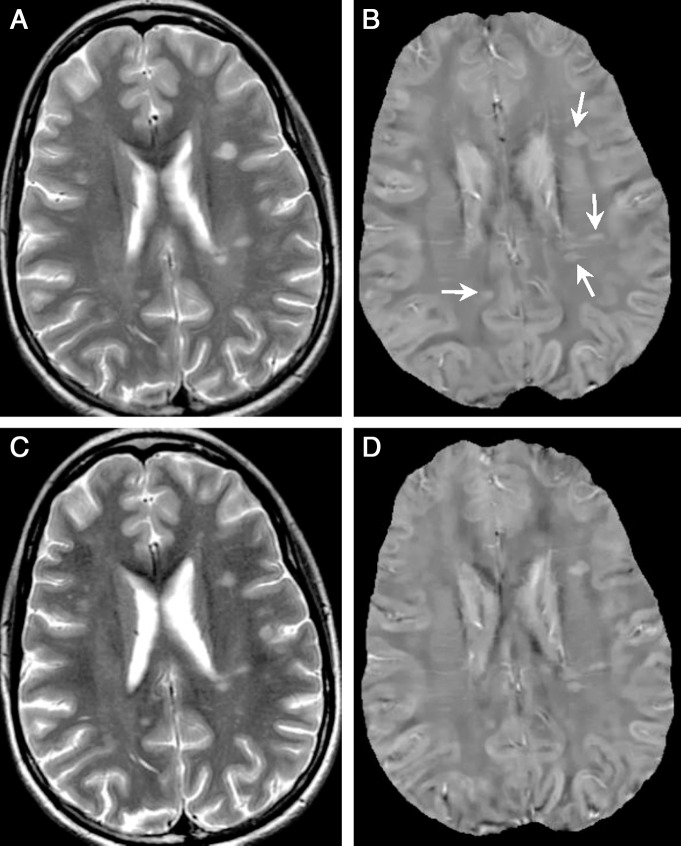
Example of nonenhanced lesions at 1.2 years in a 33-year-old woman with relapsing-remitting MS. A, T2-weighted image and, B, QSM at QSM1. C, T2-weighted image and, D, QSM at QSM2 (6 months later). All lesions (arrows) were QSM hyperintense at both QSM1 and QSM2, which indicated that their susceptibilities were higher than NAWM.
It was noted that six (1.0%) transient lesions on conventional MR images (black arrows in Fig 4, A and D) were detected in 598 identified lesions, which were all cortical or subcortical lesions that ranged in size from 15 to 126 mm3 (52.29 mm3 ± 39.11).
QSM1 Analyses of Lesion Volumes, Categories, Susceptibility Threshold, and Susceptibility versus Age
Of the 152 lesions in the QSM1 analyses, 123 (80.9%) lesions were QSM hyperintense. Lesions appeared larger on T2-weighted images (246 mm3 ± 480) than on QSM images (152 mm3 ± 280) (P = .005). There were 10 (6.6%) acute black holes, six (3.9%) transient lesions on conventional MR images, 119 (78.3%) persistent black holes, and 17 (11.2%) unclassifiable black holes. The 10 acute black holes were also contrast-enhanced lesions, and of these, eight (80.0%) were new contrast-enhanced lesions and two (20.0%) were recontrast-enhanced lesions. The susceptibilities of the 152 lesions are plotted in Figure 1; a 10-ppb line (referred to as a threshold) separates new contrast-enhanced lesions and recontrast-enhanced lesions and divides persistent black holes into two nonoverlapping groups.
The lesion susceptibility relative to NAWM versus age is shown in Figure 2, A; the 10-ppb threshold identified in Figure 1 would separate acute enhanced lesions (red dots in Fig 2, A, 0.53 ppb ± 3.34 relative to NAWM, below threshold), early to intermediately aged nonenhanced lesions (38.43 ppb ± 13.00 relative to NAWM, above threshold; P < .01), and chronic nonenhanced lesions (4.67 ppb ± 3.18 relative to NAWM, below threshold). The blue trend line in Figure 2, A, represents the average susceptibilities of acute enhanced lesion, nonenhanced lesions in age groups of 0–2, 2–4, 6–8, and 8–10 years. The susceptibilities of early to intermediately aged nonenhanced MS lesions were significantly higher than that of NAWM (lesion susceptibility relative to NAWM, 38.43 ppb ± 13.00; P < .01).
Figure 2:
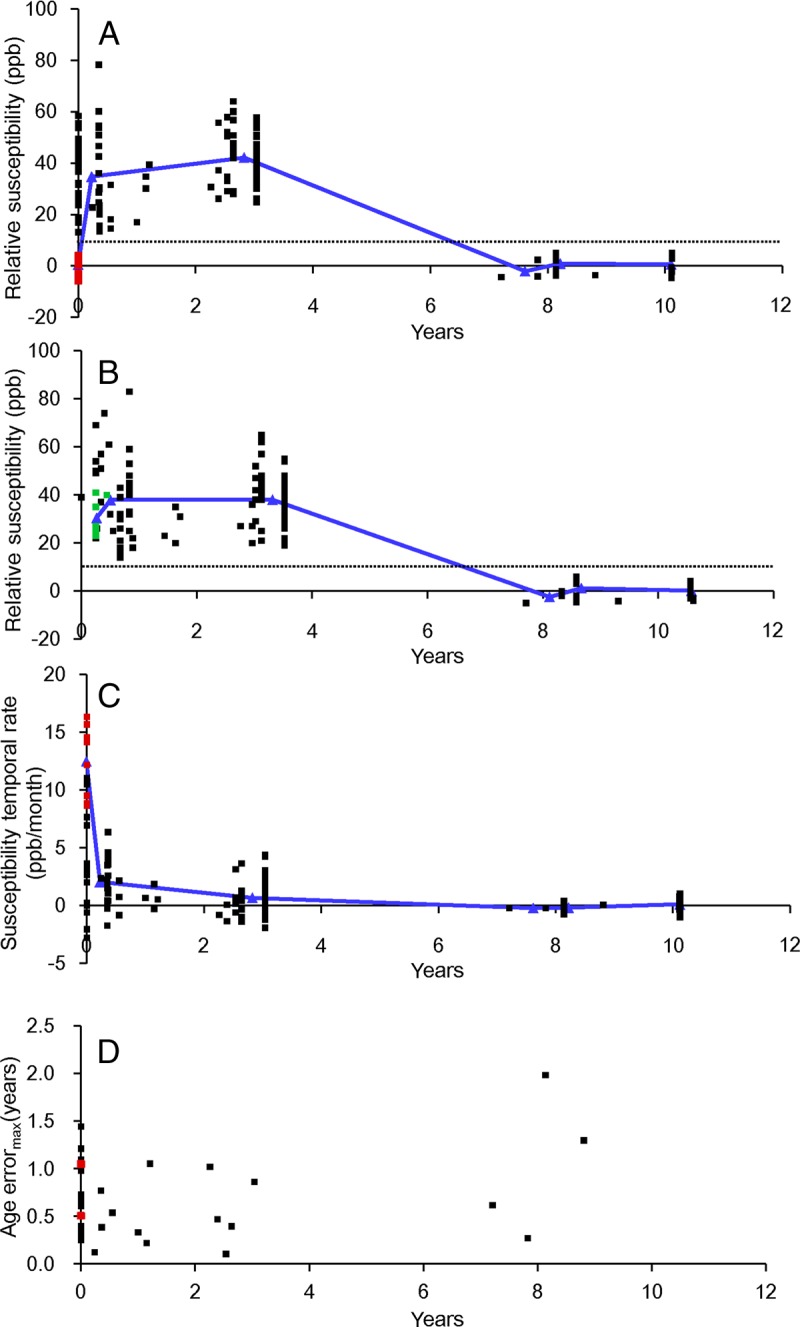
Graphs of lesion susceptibility values relative to NAWM at various ages in (A) QSM1 and (B) QSM2. C, Lesion susceptibility temporal rates relative to CSF. D, Corresponding maximal errors in estimation of lesion age. Red dots in A and C represent acute enhanced lesions, and follow-up in QSM2 are represented by green dots in B. Blue lines in A, B, and C represent average susceptibilities of nonenhanced lesions in the 0–2, 2–4, 6–8, and 8–10-year age groups.
The susceptibility relative to CSF for early to intermediately aged nonenhanced lesions is shown in Figure 3, A. The susceptibilities of early to intermediately aged nonenhanced lesions were not significantly higher than that of CSF (lesion susceptibility relative to CSF, 4.6 ppb ± 13.7; P = .22).
QSM2 Analyses of Susceptibility versus Age and Susceptibility Temporal Rate versus Age
The lesion susceptibility relative to NAWM versus age is shown in Figure 2, B. As in Figure 2, A, the 10-ppb line in Figure 1 separates early to intermediately aged nonenhanced lesions (38.01 ppb ± 13.58 relative to NAWM, above 10-ppb threshold; P < .01) and chronic nonenhanced lesions (4.03 ppb ± 2.81 relative to NAWM). The susceptibilities of all acute enhanced lesions in QSM1 increased from below the threshold in QSM1 (red dots in Fig 2, A) to above the threshold in QSM2 (green dots in Fig 2, B). The blue line in Figure 2, B represents the average susceptibilities of nonenhanced lesions in the 0–2, 2–4, 6–8, and 8–10-year age groups. The susceptibilities of early to intermediately aged nonenhanced lesions were significantly higher than that of NAWM (lesion susceptibility relative to NAWM, 38.0 ppb ± 13.6; P < .01).
The susceptibility relative to CSF for early to intermediate aged nonenhanced lesions is shown in Figure 3, B. The susceptibilities of early to intermediately aged nonenhanced lesions were significantly higher than that of CSF (lesion susceptibility relative to CSF, 11.3 ppb ± 13.2; P = .04).
The temporal rate of susceptibility change is shown in Figure 2, C. The blue line in Figure 2, C, represents the average temporal rate of susceptibility change for acute enhanced lesions and nonenhanced lesions in age groups of 0–2, 2–4, 6–8, and 8–10 years at the time of QSM1. The highest temporal rate of susceptibility change was presented in acute enhanced lesions identified at the time of QSM1 (12.49 ppb/month ± 3.15; red dots in Fig 2, C). The temporal rates of early to intermediately aged nonenhanced lesions at QSM1 were 1.27 ppb/month ± 2.31, approximately 1/10 of that of acute enhanced lesions and not significantly higher than 0 ppb/month (P = .38). Chronic nonenhanced MS lesions had approximately no temporal rate of susceptibility change (−0.004 ppb/month ± 0).
Discussion
Our study suggests that susceptibilities of MS lesions increased from similar susceptibility values to NAWM in acute enhanced stage to significantly higher susceptibilities than NAWM in early to intermediate nonenhanced stage, and then back to susceptibility values similar to NAWM in chronic nonenhanced stage. Acute enhanced lesions had high temporal rates of susceptibility increase compared with the nonenhanced lesions. A few cortical and subcortical MS lesions became detectable on QSM images, but not on conventional MR images. These lesion susceptibility temporality findings shed light on the kinetics of iron deposition in MS pathophysiologic information, provided a consistent connection among prior histochemical and MR imaging observations, and suggested the lesion susceptibility accumulation rate as measured by QSM as a biomarker of MS disease activities.
Quantitative susceptibility data in prior literature and from this study suggested that iron deposition may be a necessary contributor to the observed MS lesion susceptibilities and a dominant contributor to the observed susceptibilities of cortical lesions and perhaps all lesions; however, the observed high susceptibilities of nonenhanced MS lesions at 0–4 years may be because of iron deposition (3,8,26–28) and demyelination (29–33), two major and common pathologic features in MS. Myelin susceptibility (χmyelin, −9.10 ppm) is only slightly more diamagnetic than that of water (χwater, −9.04 ppm) (34), so a voxel completely packed with white matter tracts would experience a maximal susceptibility increase of χwater − χmyelin = ∼60 ppb at complete demyelination (31). Therefore, all observed susceptibility increases of more than 60 ppb have to come from sources other than demyelination. CSF is approximately water, so the measured susceptibility higher than that of CSF has to come from paramagnetic sources other than demyelination. Iron is strongly paramagnetic (χferritin, 761 ppm for a voxel packed with ferritin) (35), and a small amount of ferritin can easily account for the observed MS susceptibilities. Cortical voxels may contain little myelin and, accordingly, cortical MS lesions may have little demyelination. Iron deposition can account for the observed susceptibility increases in cortical MS lesions. Chronic lesions (>7 years) still contain substantial demyelination. Their susceptibilities are similar to those of NAWM, which may suggest that NAWM in MS patients with chronic lesions has as much iron and demyelination as chronic lesions, otherwise, demyelination does not contribute importantly to the observed lesion susceptibility, and the main contribution of this returning to normal in QSM may be related to a clearance of iron.
Previous histochemical studies show that iron deposits are absent in active MS lesions (27), but present in a subset of chronic, demyelinated MS lesions (27,36). This is consistent with our QSM observations of acute enhanced lesions with small susceptibilities and large temporal increases in susceptibilities and aged nonenhanced lesions with high susceptibilities but little temporal rate of change. Variability of iron presence in MS lesions is reported in histologic studies (26–28), which may be explained by the early to intermediately aged nonenhanced lesions for iron presence and the chronic nonenhanced lesions for iron absence according to our QSM observation. Rapid iron accumulation seems to be a hallmark of the MS lesion formation, which is different than the slow change of iron after lesion formation. The molecular pathways for iron accumulation in MS lesions remain to be fully understood, but one of many possible biologic mechanisms is iron-rich oligodendrocyte debris that experiences phagocytosis, or iron that is sequestered by microglia or macrophages (3,27). For practical radiologic implications, the timing of susceptibility that accumulates rapidly only during the lesion formation, which was observed in this QSM MR imaging study and corroborated by a previous histochemical study (27), suggested that lesion susceptibility measured by QSM is a useful biomarker for monitoring MS disease activities.
Gradient-echo MR phase images have been used in previous studies (5,6,13,28,37) to study iron deposition and demyelination in MS lesions. Some of these papers report many lesions as positive only on phase images, while we only observed six lesions that became positive at QSM but were undetectable on conventional MR images. This difference may be explained as follows: (a) Our study defines lesions as T2 hyperintense, while some of the articles define lesions on any image as abnormalities, which substantially broadens the lesion definition; (b) these phase images are mostly created by high-pass filtering, and regions near the edges of tissue with relatively different susceptibilities, such as the cortical sulci, may appear as lesions on the high-passed filtered phase; (c) there may be differences in disease conditions of the patients.
A recent phase imaging study reports that nonenhanced MS lesions do not show obvious qualitative variation on phase images during a 2.5-year follow-up (38), which is consistent with our observation of small susceptibility change in early to intermediately aged nonenhanced lesions. However, the phase value at an observation point is determined by all susceptibility sources that surround that point (dipole convolution of surrounding sources), and it does not reflect the property of tissue at the observation point. In general, it is difficult to interpret phase images (30) and erroneous to quantify iron from phase images (39,40). QSM was developed to overcome these difficulties in phase imaging by deconvolving the phase data to reveal tissue magnetic susceptibility property.
Our study had several limitations. First, among the observed 598 MS lesions in 32 patients, only 152 lesions in 23 patients were available for quantitative study with a limited number of patients with acute enhanced lesions or with chronic nonenhanced lesions. Future investigations are warranted to confirm our observations. Second, the long and varied intervals between QSM1 and QSM2 could introduce substantial imprecision in the estimation of temporal rate of susceptibility changes because the dependence of lesion susceptibility on time is not linear. Third, the NAWM used as a reference in MS patients may differ from white matter in healthy control subjects (7,41,42). Fourth, there is no pathologic data to directly validate QSM in this study. Future investigations are warranted to address these limitations, understand the underlying mechanisms of MS lesion susceptibility time course, and examine the possible roles of susceptibility in managing MS patients.
MS lesion magnetic susceptibility increased rapidly as it changed from enhanced to nonenhanced, it attained a high susceptibility value relative to NAWM during its initial few (∼4) years, and it gradually dissipated back to a susceptibility value similar to NAWM as it further aged, which may provide a new insight into the pathophysiologic effect of MS lesions.
Advances in Knowledge
■ Acute enhanced multiple sclerosis (MS) lesions tend to have few differences in magnetic susceptibility compared with normal-appearing white matter (NAWM) (0.53 ppb ± 3.34) and have a temporal rate of susceptibility increase of 12.49 ppb/month ± 3.15.
■ Early to intermediately aged nonenhanced MS lesions have significantly higher magnetic susceptibilities than NAWM (38.43 ppb ± 13.0; P < .01) and have a temporal rate of susceptibility change of 1.27 ppb/month ± 2.31, about 1/10 of that of the acute enhanced MS lesions.
■ Chronic nonenhanced MS lesions tend to have few differences in magnetic susceptibility from NAWM (4.67 ppb ± 3.18) and approximately no temporal rate of susceptibility change (−0.004 ppb/month ± 0).
■ Six cortical and subcortical MS lesions (1.0% of all 598 identified lesions) were detectable at quantitative susceptibility mapping (QSM), but were not visible on conventional MR images.
Implication for Patient Care
■ QSM can quantify the magnetic susceptibility of MS lesions in vivo, and with further validation it may help to improve understanding of the underlying MS pathophysiologic information and monitor disease activity in MS patients.
SUPPLEMENTAL FIGURES
Acknowledgments
Acknowledgments
We thank Tim Vartanian, MD, PhD, Jai Perumal, MB, BS, and Nancy Nealon, MD, for data collection. We also thank Allison Dunning, MS, for statistical analysis.
Received February 11, 2013; revision requested April 5; revision received June 18; accepted July 19; final version accepted September 9.
Supported in part by the Doctoral Fund of Ministry of Education of China (grant 200804871039).
Funding: This research was supported by the National Institutes of Health (grants R01NS072370 and R01EB013443).
Disclosures of Conflicts of Interest: W.C. No relevant conflicts of interest to disclose. S.A.G. No relevant conflicts of interest to disclose. A.G. No relevant conflicts of interest to disclose. J.C. No relevant conflicts of interest to disclose. T.L. Financial activities related to the present article: none to disclose. Financial activities not related to the present article: QSM Technology patent pending. Other relationships: none to disclose. S.W. No relevant conflicts of interest to disclose. M.P. No relevant conflicts of interest to disclose. D.P. Financial activities related to the present article: none to disclose. Financial activities not related to the present article: money paid to author by Biogen Idec for consultancy; money paid to institution for grant from Novartis; money paid to author from TEVA for lectures. Other relationships: none to disclose. Y.W. Financial activities related to the present article: none to disclose. Financial activities not related to the present article: QSM Technology patent pending. Other relationships: none to disclose.
Abbreviations:
- CSF
- cerebrospinal fluid
- MS
- multiple sclerosis
- NAWM
- normal-appearing white matter
- QSM
- quantitative susceptibility mapping
- QSM1
- first QSM appearance of a lesion on an MR image
- QSM2
- second QSM appearance of a lesion on an MR image
- ROI
- region of interest
References
- 1.Poloni G, Minagar A, Haacke EM, Zivadinov R. Recent developments in imaging of multiple sclerosis. Neurologist 2011;17(4):185–204. [DOI] [PubMed] [Google Scholar]
- 2.Barkhof F. The clinico-radiological paradox in multiple sclerosis revisited. Curr Opin Neurol 2002;15(3):239–245. [DOI] [PubMed] [Google Scholar]
- 3.Williams R, Buchheit CL, Berman NE, LeVine SM. Pathogenic implications of iron accumulation in multiple sclerosis. J Neurochem 2012;120(1):7–25. [DOI] [PMC free article] [PubMed] [Google Scholar]
- 4.Khalil M, Langkammer C, Ropele S, et al. Determinants of brain iron in multiple sclerosis: a quantitative 3T MRI study. Neurology 2011;77(18):1691–1697. [DOI] [PubMed] [Google Scholar]
- 5.Haacke EM, Makki M, Ge Y, et al. Characterizing iron deposition in multiple sclerosis lesions using susceptibility weighted imaging. J Magn Reson Imaging 2009;29(3):537–544. [DOI] [PMC free article] [PubMed] [Google Scholar]
- 6.Hammond KE, Metcalf M, Carvajal L, et al. Quantitative in vivo magnetic resonance imaging of multiple sclerosis at 7 Tesla with sensitivity to iron. Ann Neurol 2008;64(6):707–713. [DOI] [PubMed] [Google Scholar]
- 7.Habib CA, Liu M, Bawany N, et al. Assessing abnormal iron content in the deep gray matter of patients with multiple sclerosis versus healthy controls. AJNR Am J Neuroradiol 2012;33(2):252–258. [DOI] [PMC free article] [PubMed] [Google Scholar]
- 8.Bagnato F, Hametner S, Yao B, et al. Tracking iron in multiple sclerosis: a combined imaging and histopathological study at 7 Tesla. Brain 2011;134(Pt 12):3602–3615. [DOI] [PMC free article] [PubMed] [Google Scholar]
- 9.Yao B, Bagnato F, Matsuura E, et al. Chronic multiple sclerosis lesions: characterization with high-field-strength MR imaging. Radiology 2012;262(1):206–215. [DOI] [PMC free article] [PubMed] [Google Scholar]
- 10.Khalil M, Teunissen C, Langkammer C. Iron and neurodegeneration in multiple sclerosis. Mult Scler Int 2011;2011:606807. [DOI] [PMC free article] [PubMed] [Google Scholar]
- 11.Ropele S, de Graaf W, Khalil M, et al. MRI assessment of iron deposition in multiple sclerosis. J Magn Reson Imaging 2011;34(1):13–21. [DOI] [PubMed] [Google Scholar]
- 12.Grabner G, Dal-Bianco A, Schernthaner M, Vass K, Lassmann H, Trattnig S. Analysis of multiple sclerosis lesions using a fusion of 3.0 T FLAIR and 7.0 T SWI phase: FLAIR SWI. J Magn Reson Imaging 2011;33(3):543–549. [DOI] [PubMed] [Google Scholar]
- 13.Eissa A, Lebel RM, Korzan JR, et al. Detecting lesions in multiple sclerosis at 4.7 tesla using phase susceptibility-weighting and T2-weighting. J Magn Reson Imaging 2009;30(4):737–742. [DOI] [PubMed] [Google Scholar]
- 14.Liu T, Surapaneni K, Lou M, Cheng L, Spincemaille P, Wang Y. Cerebral microbleeds: burden assessment by using quantitative susceptibility mapping. Radiology 2012;262(1):269–278. [DOI] [PMC free article] [PubMed] [Google Scholar]
- 15.Li J, Chang S, Liu T, et al. Reducing the object orientation dependence of susceptibility effects in gradient echo MRI through quantitative susceptibility mapping. Magn Reson Med 2012;68(5):1563–1569. [DOI] [PMC free article] [PubMed] [Google Scholar]
- 16.de Rochefort L, Liu T, Kressler B, et al. Quantitative susceptibility map reconstruction from MR phase data using bayesian regularization: validation and application to brain imaging. Magn Reson Med 2010;63(1):194–206. [DOI] [PubMed] [Google Scholar]
- 17.Liu J, Liu T, de Rochefort L, et al. Morphology enabled dipole inversion for quantitative susceptibility mapping using structural consistency between the magnitude image and the susceptibility map. Neuroimage 2012;59(3):2560–2568. [DOI] [PMC free article] [PubMed] [Google Scholar]
- 18.Liu T, Wisnieff C, Lou M, Chen W, Spincemaille P, Wang Y. Nonlinear formulation of the magnetic field to source relationship for robust quantitative susceptibility mapping. Magn Reson Med 2013;69(2):467–476. [DOI] [PubMed] [Google Scholar]
- 19.Jenkinson M, Bannister P, Brady M, Smith S. Improved optimization for the robust and accurate linear registration and motion correction of brain images. Neuroimage 2002;17(2):825–841. [DOI] [PubMed] [Google Scholar]
- 20.Liu T, Xu W, Spincemaille P, Avestimehr AS, Wang Y. Accuracy of the morphology enabled dipole inversion (MEDI) algorithm for quantitative susceptibility mapping in MRI. IEEE Trans Med Imaging 2012;31(3):816–824. [DOI] [PMC free article] [PubMed] [Google Scholar]
- 21.Liu T, Liu J, de Rochefort L, et al. Morphology enabled dipole inversion (MEDI) from a single-angle acquisition: comparison with COSMOS in human brain imaging. Magn Reson Med 2011;66(3):777–783. [DOI] [PubMed] [Google Scholar]
- 22.Sahraian MA, Radue EW, Haller S, Kappos L. Black holes in multiple sclerosis: definition, evolution, and clinical correlations. Acta Neurol Scand 2010;122(1):1–8. [DOI] [PubMed] [Google Scholar]
- 23.Naismith RT, Xu J, Tutlam NT, et al. Increased diffusivity in acute multiple sclerosis lesions predicts risk of black hole. Neurology 2010;74(21):1694–1701. [DOI] [PMC free article] [PubMed] [Google Scholar]
- 24.Campbell Z, Sahm D, Donohue K, et al. Characterizing contrast-enhancing and re-enhancing lesions in multiple sclerosis. Neurology 2012;78(19):1493–1499. [DOI] [PMC free article] [PubMed] [Google Scholar]
- 25.Gönen M, Panageas KS, Larson SM. Statistical issues in analysis of diagnostic imaging experiments with multiple observations per patient. Radiology 2001;221(3):763–767. [DOI] [PubMed] [Google Scholar]
- 26.Adams CW. Perivascular iron deposition and other vascular damage in multiple sclerosis. J Neurol Neurosurg Psychiatry 1988;51(2):260–265. [DOI] [PMC free article] [PubMed] [Google Scholar]
- 27.Mehta V, Pei W, Yang G, et al. Iron is a sensitive biomarker for inflammation in multiple sclerosis lesions. PLoS ONE 2013;8(3):e57573. [DOI] [PMC free article] [PubMed] [Google Scholar]
- 28.Walsh AJ, Lebel RM, Eissa A, et al. Multiple sclerosis: validation of MR imaging for quantification and detection of iron. Radiology 2013;267(2):531–542. [DOI] [PubMed] [Google Scholar]
- 29.Trapp BD, Peterson J, Ransohoff RM, Rudick R, Mörk S, Bö L. Axonal transection in the lesions of multiple sclerosis. N Engl J Med 1998;338(5):278–285. [DOI] [PubMed] [Google Scholar]
- 30.He X, Yablonskiy DA. Biophysical mechanisms of phase contrast in gradient echo MRI. Proc Natl Acad Sci U S A 2009;106(32):13558–13563. [DOI] [PMC free article] [PubMed] [Google Scholar]
- 31.Li W, Wu B, Liu C. Quantitative susceptibility mapping of human brain reflects spatial variation in tissue composition. Neuroimage 2011;55(4):1645–1656. [DOI] [PMC free article] [PubMed] [Google Scholar]
- 32.Wharton S, Bowtell R. Fiber orientation-dependent white matter contrast in gradient echo MRI. Proc Natl Acad Sci U S A 2012;109(45):18559–18564. [DOI] [PMC free article] [PubMed] [Google Scholar]
- 33.Yablonskiy DA, Luo J, Sukstanskii AL, Iyer A, Cross AH. Biophysical mechanisms of MRI signal frequency contrast in multiple sclerosis. Proc Natl Acad Sci U S A 2012;109(35):14212–14217. [DOI] [PMC free article] [PubMed] [Google Scholar]
- 34.Lee J, Shmueli K, Fukunaga M, et al. Sensitivity of MRI resonance frequency to the orientation of brain tissue microstructure. Proc Natl Acad Sci U S A 2010;107(11):5130–5135. [DOI] [PMC free article] [PubMed] [Google Scholar]
- 35.Pauling L. General chemistry. Mineola, NY: Dover, 1988. [Google Scholar]
- 36.Bagnato F, Hametner S, Yao B, et al. Tracking iron in multiple sclerosis: a combined imaging and histopathological study at 7 Tesla. Brain 2011;134(Pt 12):3602–3615. [DOI] [PMC free article] [PubMed] [Google Scholar]
- 37.Hagemeier J, Heininen-Brown M, Poloni GU, et al. Iron deposition in multiple sclerosis lesions measured by susceptibility-weighted imaging filtered phase: a case control study. J Magn Reson Imaging 2012;36(1):73–83. [DOI] [PubMed] [Google Scholar]
- 38.Bian W, Harter K, Hammond-Rosenbluth KE, et al. A serial in vivo 7T magnetic resonance phase imaging study of white matter lesions in multiple sclerosis. Mult Scler 2013;19(1):69–75. [DOI] [PubMed] [Google Scholar]
- 39.Yao B, Li TQ, Pv Gelderen, Shmueli K, de Zwart JA, Duyn JH. Susceptibility contrast in high field MRI of human brain as a function of tissue iron content. Neuroimage 2009;44(4):1259–1266. [DOI] [PMC free article] [PubMed] [Google Scholar]
- 40.Li J, Chang S, Liu T, et al. Reducing the object orientation dependence of susceptibility effects in gradient echo MRI through quantitative susceptibility mapping. Magn Reson Med 2012;68(5):1563–1569. [DOI] [PMC free article] [PubMed] [Google Scholar]
- 41.Langkammer C, Liu T, Khalil M, et al. Quantitative susceptibility mapping in multiple sclerosis. Radiology 2013;267(2):551–559. [DOI] [PMC free article] [PubMed] [Google Scholar]
- 42.Al-Radaideh AM, Wharton SJ, Lim SY, et al. Increased iron accumulation occurs in the earliest stages of demyelinating disease: an ultra-high field susceptibility mapping study in Clinically Isolated Syndrome. Mult Scler 2013;19(7):896–903. [DOI] [PubMed] [Google Scholar]
Associated Data
This section collects any data citations, data availability statements, or supplementary materials included in this article.


