

Abstract
Tumor response assessment has been a foundation for advances in cancer therapy. Recent discoveries of effective targeted therapy for specific genomic abnormalities in lung cancer and their clinical application have brought revolutionary advances in lung cancer therapy and transformed the oncologist’s approach to patients with lung cancer. Because imaging is a major method of response assessment in lung cancer both in clinical trials and practice, radiologists must understand the genomic alterations in lung cancer and the rapidly evolving therapeutic approaches to effectively communicate with oncology colleagues and maintain the key role in lung cancer care. This article describes the origin and importance of tumor response assessment, presents the recent genomic discoveries in lung cancer and therapies directed against these genomic changes, and describes how these discoveries affect the radiology community. The authors then summarize the conventional Response Evaluation Criteria in Solid Tumors and World Health Organization guidelines, which continue to be the major determinants of trial endpoints, and describe their limitations particularly in an era of genomic-based therapy. More advanced imaging techniques for lung cancer response assessment are presented, including computed tomography tumor volume and perfusion, dynamic contrast material–enhanced and diffusion-weighted magnetic resonance imaging, and positron emission tomography with fluorine 18 fluorodeoxyglucose and novel tracers. State-of-art knowledge of lung cancer biology, treatment, and imaging will help the radiology community to remain effective contributors to the personalized care of lung cancer patients.
© RSNA, 2014
Learning Objectives:
After reading the article and taking the test, the reader will be able to:
■ Describe the essential elements for tumor response assessment
■ Discuss the limitations of conventional tumor response criteria such as RECIST and WHO criteria
■ Describe the recent genomic discoveries in lung cancer and their implication in therapeutic decision making and imaging
■ Explain the emerging role of advanced imaging techniques in response assessment of lung cancer
Accreditation and Designation Statement
The RSNA is accredited by the Accreditation Council for Continuing Medical Education (ACCME) to provide continuing medical education for physicians. The RSNA designates this journal-based activity for a maximum of 1.0 AMA PRA Category 1 Credit TM. Physicans should claim only the credit commensurate with the extent of their participation in the activity.
Disclosure Statement
The ACCME requires that the RSNA, as an accredited provider of CME, obtain signed disclosure statements from the authors, editors, and reviewers for this activity. For this journal-based CME activity, author disclosures are listed at the end of this article.
Introduction
Lung cancer remains the leading cause of cancer death both worldwide and in the United States, accounting for more than 160 000 deaths per year in the United States (1,2). In the past decade, there have been significant advances in defining the genomic abnormalities that lead to lung cancer. Subsequent research has identified highly effective targeted therapies for these specific genomic changes. The implementation of targeted therapies has been translated into clinical practice by systematic genomic characterization of lung cancers, allowing for the delivery of the effective therapeutic agents targeting different genomic abnormalities. A representative example is the discovery of the somatic activating mutations of the epidermal growth factor receptor (EGFR) tyrosine kinase domain in non–small cell lung cancer (NSCLC), which is associated with a dramatic response to the EGFR tyrosine kinase inhibitors (EGFR-TKI), gefitinib and erlotinib (3–5). These types of discoveries and their clinical application have transformed the way oncologists approach lung cancer and plan treatment (6–8).
Imaging is a key component in the assessment of response to lung cancer therapy and is necessary for the definition of disease progression during conventional chemotherapy with cytotoxic agents, molecular targeting therapy with cytostatic agents, and combination therapy of both categories of agents. The role of imaging as a determinant of therapeutic decisions in cancer patients has become increasingly important in the era of genomic medicine, where genomically defined subsets of patients are treated with anticancer therapy targeting a mechanism specific for their tumors. Response assessment in lung cancer should evolve in parallel with the advances in lung cancer treatment (9).
The purpose of this article is to review the historical background of tumor response assessment including its origin and importance, summarize the recent genomic discoveries in lung cancer and their implications for subsequent treatment and imaging, describe conventional response assessment strategies and their limitations, and discuss advanced and emerging imaging techniques for response assessment in lung cancer. We highlight the clinically applied techniques including computed tomography (CT) tumor volume and perfusion, fluorine 18 (18F) fluorodeoxyglucose (FDG) positron emission tomography (PET), and dynamic contrast material–enhanced (DCE) and diffusion-weighted magnetic resonance (MR) imaging. Emerging techniques in molecular and functional imaging with novel PET tracers designed to characterize the mechanism-specific and pathway-specific tumor response to therapy are also described.
The Origin of Tumor Response Assessment: Rationale, Goals, and Importance
The term “tumor response assessment” is well known in the medical community and frequently used in both the oncologic and radiologic literature. Numerous investigations of tumor response assessment have been carried out in different types of cancer, including lung cancer, using conventional and novel criteria for response assessment. Before reviewing these investigations, we would like to discuss the origin of tumor response assessment. Miller et al (10) in 1981 described the essentials of tumor response assessment. They emphasized importance of a “common language” that could be used to describe the results of cancer treatment. Miller et al also stressed the need for internationally acceptable general principles for reporting and assessing data. To meet the needs, the article introduced several important elements of tumor response assessment as a “common language.” These elements included (a) the concept of measurability of the disease, in which malignant disease can be measured in the metric system in two dimensions by ruler or caliper; (b) definition of objective response, in which complete response is defined as the disappearance of all known disease, partial response is defined as 50% or greater decrease of the sum of the products of two-dimensional measurements of lesions, and progressive disease is defined as 25% or greater increase or the appearance of new lesions; and (c) guidance for determination of overall response and duration of response (10). The introduction of the concept and the definitions of essential terminology contributed to standardize the ways tumor response was assessed and results of cancer treatment were documented in clinical oncology research. The standardization allowed effective comparisons among results of different cancer treatments, which has led to significant advances in cancer therapy.
Advances in Lung Cancer Therapy: Genomic Abnormalities and Therapeutic Implications
The results of cytotoxic chemotherapy for NSCLC in the last 3 decades of the 20th century are summarized by Breathnach et al, in their article in 2001 entitled, “Twenty-Two Years of Phase III Trials for Patients with Advanced Non–Small-Cell Lung Cancer: Sobering Results” (11). The analysis of 33 phase-III trials initiated between 1973 and 1994 demonstrated that median survival improved by only 2.6 weeks, clearly indicating the need for novel targets and new effective agents in the treatment of lung cancer (11). Three years after the publication of this article, the identification of the sensitizing mutations of EGFR in lung adenocarcinomas was reported (3–5), which brought a breakthrough in NSCLC research and led to fundamental changes in the therapeutic approach to lung cancer.
EGFR is a transmembranous receptor tyrosine kinase involved in signaling pathways that regulate cell proliferation, apoptosis, angiogenesis, and invasion (Fig 1) (6–8). Activating mutations of EGFR are present in approximately 15% of patients with lung adenocarcinomas in subjects from northern European background (12) and in 30%–50% of patients from East Asia (6–8). EGFR mutations are more common in female never-smokers with adenocarcinoma histology and are less common in older patients with a significant smoking history (6–8). Several types of EGFR mutations, such as exon 19 deletions or L858R point mutation in exon 21, are associated with sensitivity and response to EGFR-TKI treatment, and therefore are considered “sensitizing mutations.” On the other hand, tumors with certain mutations, such as exon 20 insertions, are resistant and lack response to EGFR inhibitors. NSCLC patients with sensitizing EGFR-mutant tumors typically respond dramatically to the EGFR inhibitors, erlotinib (Tarceva; Genentech, South San Francisco, Calif) and gefitinib (Iressa; AstraZeneca Pharmaceuticals, Wilmington, Del) (Fig 2), and have response rates in excess of 70% and progression-free survival (PFS) of 9.7–13.1 months (12–18).
Figure 1:

EGFR is a transmembranous receptor tyrosine kinase. EGFR signaling pathways regulate important tumorgenic processes. Akt = V-akt murine thymoma viral oncogene homolog, EGF = epidermal growth factor, MAPK = mitogen-activated protein kinase, mTOR = mammalian target of rapamycin, PI3K = phosphatidylinositol 3-kinase, PTEN = phosphatase and tensin homolog, Raf = rapidly accelerated fibrosarcoma, Ras = rat sarcoma, STAT = signal transducer and activator of transcription, TGF-a, transforming growth factor α.
Figure 2a:
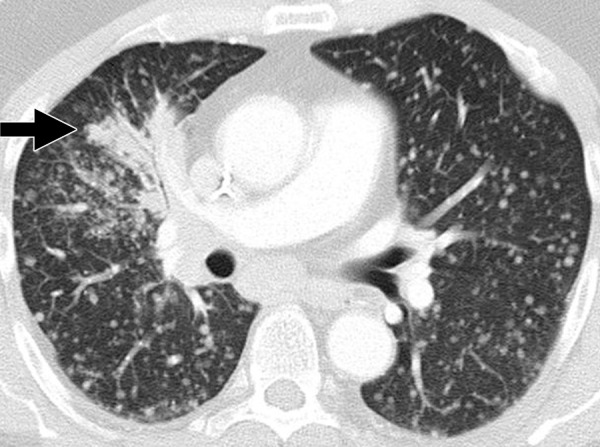
Dramatic radiographic response to erlotinib in a 55-year-old man with stage IV adenocarcinoma of the lung harboring exon 19 deletion of EGFR. (a) Contrast-enhanced CT scan of the chest before therapy demonstrates an irregular mass in the right middle lobe (arrow), with multiple metastatic nodules in both lungs. (b) Follow-up CT scan after 2 months of erlotinib therapy show near-complete resolution of the dominant mass with very faint residual opacities in the right middle lobe (arrow), representing a marked response to therapy. Bilateral metastatic nodules also decreased in size and number.
Figure 2b:
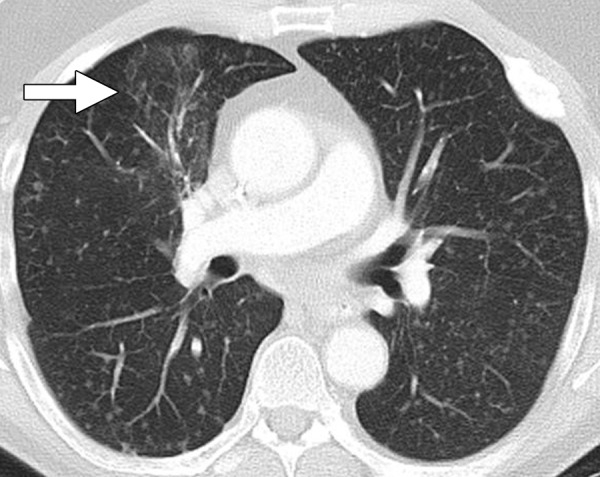
Dramatic radiographic response to erlotinib in a 55-year-old man with stage IV adenocarcinoma of the lung harboring exon 19 deletion of EGFR. (a) Contrast-enhanced CT scan of the chest before therapy demonstrates an irregular mass in the right middle lobe (arrow), with multiple metastatic nodules in both lungs. (b) Follow-up CT scan after 2 months of erlotinib therapy show near-complete resolution of the dominant mass with very faint residual opacities in the right middle lobe (arrow), representing a marked response to therapy. Bilateral metastatic nodules also decreased in size and number.
Erlotinib and gefitinib have been approved as therapeutic agents for advanced NSCLC in many countries. Based on the recent results of five phase-III randomized controlled trials, the American Society of Clinical Oncology recently published a provisional clinical opinion recommending EGFR mutation testing for NSCLC patients being considered for first-line therapy with an EGFR-TKI (19). Prior to 2004, lung cancer patients with advanced NSCLC were all receiving essentially the same regimen of platinum-based therapy. In the current era of a genome-based approach, tumor specimens are tested for mutations to look for targetable abnormalities with effective agents, including the presence of sensitizing EGFR mutations (Fig 3).
Figure 3:

Genome-based approach to lung cancer. In the current era of genomic medicine, mutation testing of the tumor plays an important role in identifying the patients with targetable abnormalities with effective agents and optimizing therapeutic approach in advanced NSCLC. (The algorithm is based on National Comprehensive Cancer Network Clinical Practice Guidelines in Oncology, Non-Small Cell Lung Cancer, version 3.2012 [113]). * = If EGFR mutation is discovered prior to first-line chemotherapy, erlotinib is recommended. If EGFR mutation is discovered during first-line chemotherapy, switching to maintenance erlotinib or the addition of erlotinib to current chemotherapy is recommended (113). ALK = anaplastic lymphoma kinase, NOS = not otherwise specified.
Because of the success of gefitinib and erlotinib in patients with EGFR-mutant NSCLC, new genomic abnormalities of NSCLC have been both discovered and then studied to develop targeting therapeutic agents for different subsets of genomically defined patients. The ALK (anaplastic lymphoma kinase) rearranged oncogene is one such molecular target in NSCLC. It was initially described in a Japanese patient with adenocarcinoma of the lung in 2007 (20). It is present in 2%–7% of NSCLC patients and is more prevalent in younger patients, women, neversmokers or light smokers, and in adenocarcinomas (21–24). Eighty-two patients were treated in an expansion cohort within an ongoing phase I trial of crizotinib (Xalkori; Pfizer, New York, NY), an adenosine triphosphate–competitive inhibitor of ALK receptor tyrosine kinase. Patients with ALK rearrangement treated with crizotinib demonstrated the overall response rate of 57%, a PFS of 8 months, and more than 50% survival rate at 2 years from starting treatment (23,24). Because of the dramatic clinical benefit, crizotinib was provisionally approved by the U.S. Food and Drug Administration in August 2011 for the treatment of ALK-rearranged NSCLC (Fig 4). Figure 5 summarizes the genomic abnormalities identified in NSCLC. Current therapy requires matching the right gene mutation to the right pharmaceutical agent, which improves the efficacy and the effectiveness of therapy (25,26). In a recent phase II Biomarker-integrated Approaches of Targeted Therapy for Lung Cancer Elimination, or BATTLE, trial, tumors were prospectively biopsied and adaptive randomization was used based on tumor markers from biopsy specimen. The overall results demonstrated a 46% 8-week disease control rate in 244 pretreated lung cancer patients and established the feasibility of performing biopsies and real-time biomarker analyses in patients with previously treated lung cancer (27). Tissue sampling is another important role of radiologists in the delivery of personalized cancer care.
Figure 4a:

Images in a 70-year-old woman with stage IV adenocarcinoma harboring EML4-ALK (anaplastic lymphoma kinase) translocation treated with ALK inhibitor crizotinib. (a) Coronal reformatted image from baseline chest CT demonstrates multiple nodules in the right lung (arrows) with nodular thickening of the right apical pleura (arrowheads), representing significant tumor burden. (b) The patient was treated with crizotinib. After 4 months of therapy, follow-up chest CT scan demonstrates marked decrease of the right lung nodules (arrows) and resolution of pleural tumor burden in the right apex (arrowheads).
Figure 5:

Genomic subtypes of NSCLC. The pie chart represents the subdivisions of lung adenocarcinomas based on different driver mutations detected from the testing of 516 tumors (114,115). KRAS = V-Ki-ras2 Kirsten rat sarcoma viral oncogene homolog; EML4 = echinoderm microtubule-associated protein-like 4; ALK = anaplastic lymphoma kinase; BRAF = v-Raf murine sarcoma viral oncogene homolog B1; PI3KCA = phosphatidylinositol 3-kinase; HER2 = human epidermal growth factor receptor 2; MET = mesenchymal-epithelial transition factor; AMP = amplification; MEK1 = dual specificity mitogen-activated protein kinase kinase 1 (MAP2 K1); NRAS = neuroblastoma RAS viral (v-ras) oncogene homolog; AKT1 = V-akt murine thymoma viral oncogene homolog 1.
Figure 4b:
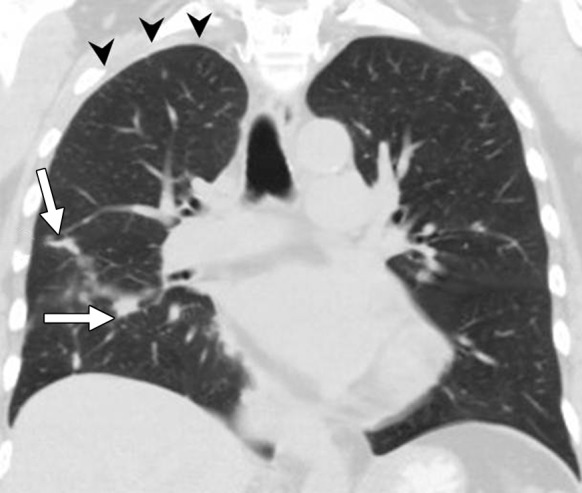
Images in a 70-year-old woman with stage IV adenocarcinoma harboring EML4-ALK (anaplastic lymphoma kinase) translocation treated with ALK inhibitor crizotinib. (a) Coronal reformatted image from baseline chest CT demonstrates multiple nodules in the right lung (arrows) with nodular thickening of the right apical pleura (arrowheads), representing significant tumor burden. (b) The patient was treated with crizotinib. After 4 months of therapy, follow-up chest CT scan demonstrates marked decrease of the right lung nodules (arrows) and resolution of pleural tumor burden in the right apex (arrowheads).
The successful applications of targeting therapeutic agents such as EGFR inhibitors and ALK inhibitors have led to further investigation to identify a larger number of genomic abnormalities in lung cancer (28,29). Ding et al (28) studied 188 human lung adenocarcinomas by using targeted sequencing of candidate protein-coding genes and identified 26 genes that were mutated at significantly higher frequencies. More recently, a study by Imielinski et al (29), which used next-generation sequencing to sequence the exomes and/or genomes of DNA from 183 lung adenocarcinomas and matched normal adjacent tissue pairs, verified genes with frequent somatic alteration in previous studies and identified novel mutated genes that likely contribute to pathogenesis. These investigations continue to further advance the comprehensive understanding of genomic abnormalities of lung cancer and the development of newer targeting agents directed against these abnormalities.
Conventional Tumor Response Assessment: WHO, RECIST, and Their Pitfalls
The two most commonly used response assessment criteria in solid tumors are the World Health Organization (WHO) criteria, introduced in 1979, and the Response Evaluation Criteria in Solid Tumors (RECIST), published in 2000 and revised in 2009 (10,30–34). The outlines for the WHO, the original RECIST (RECIST 1.0) and the revised RECIST (RECIST 1.1) are summarized in Tables 1 and 2. The WHO criteria use bidimensional measurements, while RECIST utilizes the longest unidimensional diameters of target lesions (Fig 6). Both criteria assign four categories of assessment, including complete response, partial response, stable disease, and progressive disease (Table 2).
Table 1.
Guidelines for Imaging Modality, Target Lesions, and Tumor Measurements according to WHO, RECIST 1.0, and RECIST 1.1

Source.—References 10, 30–34.
Nonmeasurable lesions according to RECIST include other lesions that do not meet the criteria as measurable lesions, such as small lesions with a longest diameter of < 10 mm, skeletal metastases, without a soft-tissue component, ascites, pleural effusion, lymphangitic spread of tumor, leptomeningeal disease, inflammatory breast disease, cystic or necrotic lesions, lesions in an irradiated area, and an abdominal mass not confirmed by imaging, are recorded as “non-target lesions” (31,32). Lymph node measuring ≥ 10 mm but < 15 mm in short axis is considered “non-measureable” and therefore recorded as “non-target lesions” according to RECIST 1.1 (32,33).
Table 2.
Response Category according to WHO, RECIST 1.0, and RECIST 1.1
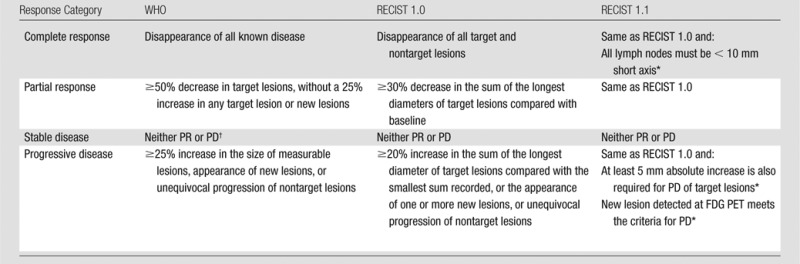
Figure 6:
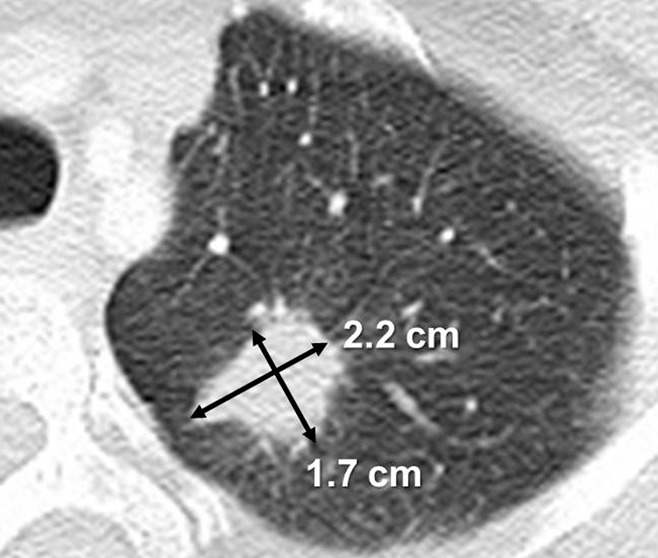
Unidimensional and bidimensional tumor measurements. CT scan of the chest in a 53-year-woman with stage IV adenocarcinoma of the lung depicts a lesion in the left upper lobe measuring 2.2 × 1.7 cm. With WHO criteria, the measurement of the lesion would be 3.7 cm2 (a product of 2.2 cm and 1.7 cm). The RECIST guideline uses the longest diameter of the lesion, which is 2.2 cm for this lesion.
These criteria are designed to be simple and practical and therefore can be easily incorporated as standardized measures for response assessment in oncology trials and practice across the institutions. These criteria rely on size measurement alone and assume that tumor volume is simply related to a planar measurement (35). However, significant intratumoral heterogeneity exists in rates and patterns of tumor growth (Fig 7). The heterogeneity can be in terms of tumor growth within one lesion, as demonstrated in Figure 7, where only one portion of the lesion grows disproportionally while other portions remain essentially unchanged. Heterogeneity can also be in terms of tumor growth among multiple lesions within a patient, where some lesions grow significantly during therapy while others remain unchanged or decrease in size.
Figure 7a:
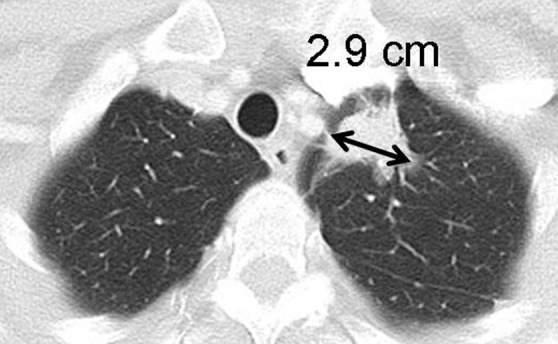
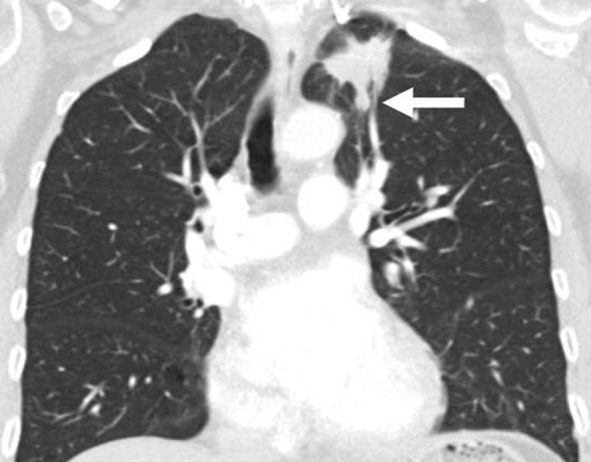
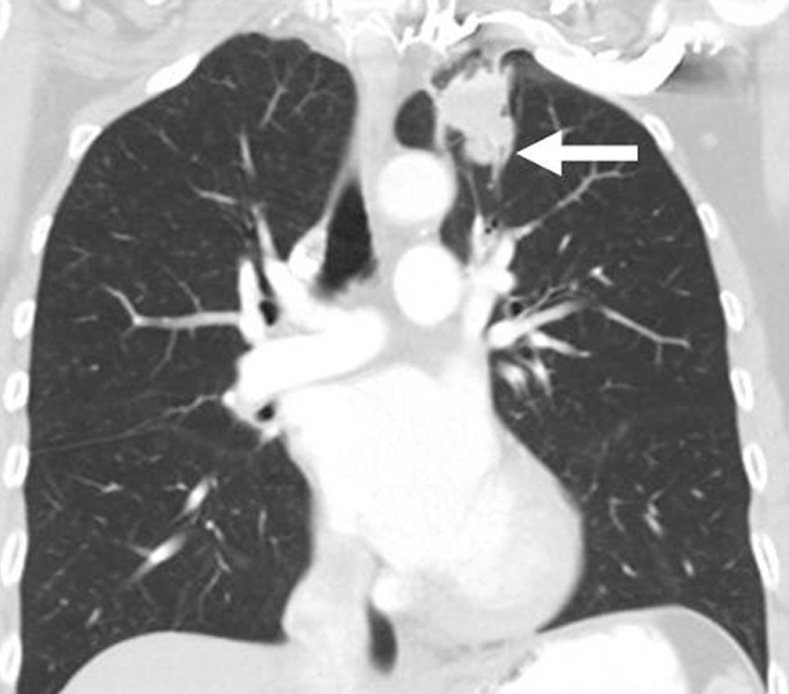
Limitations of response assessment using RECIST in a 58-year-old woman with stage IV adenocarcinoma of the lung. (a, b) Contrast-enhanced axial and coronal CT images of the chest during pemetrexed and cisplatin therapy demonstrate a spiculated mass in the left upper lobe. The measurement of the dominant mass according to RECIST was 2.9 cm, measured in the longest diameter on an axial plane. Note a small nodular component of the mass at its inferior portion (arrow, b). (c, d) At follow-up CT during therapy, (c) the axial plane at the level of the longest diameter of the mass demonstrated a similar appearance and size of mass, 3.0 cm in the longest diameter. However, on (d) a coronal reformatted image at the level of the mass, the inferior component of the mass (arrow, d) has increased compared with the prior study (b), indicating increase of tumor burden, which is not captured by either RECIST or World Health Organization (WHO) measurements.
Figure 7b:
Limitations of response assessment using RECIST in a 58-year-old woman with stage IV adenocarcinoma of the lung. (a, b) Contrast-enhanced axial and coronal CT images of the chest during pemetrexed and cisplatin therapy demonstrate a spiculated mass in the left upper lobe. The measurement of the dominant mass according to RECIST was 2.9 cm, measured in the longest diameter on an axial plane. Note a small nodular component of the mass at its inferior portion (arrow, b). (c, d) At follow-up CT during therapy, (c) the axial plane at the level of the longest diameter of the mass demonstrated a similar appearance and size of mass, 3.0 cm in the longest diameter. However, on (d) a coronal reformatted image at the level of the mass, the inferior component of the mass (arrow, d) has increased compared with the prior study (b), indicating increase of tumor burden, which is not captured by either RECIST or World Health Organization (WHO) measurements.
Figure 7c:

Limitations of response assessment using RECIST in a 58-year-old woman with stage IV adenocarcinoma of the lung. (a, b) Contrast-enhanced axial and coronal CT images of the chest during pemetrexed and cisplatin therapy demonstrate a spiculated mass in the left upper lobe. The measurement of the dominant mass according to RECIST was 2.9 cm, measured in the longest diameter on an axial plane. Note a small nodular component of the mass at its inferior portion (arrow, b). (c, d) At follow-up CT during therapy, (c) the axial plane at the level of the longest diameter of the mass demonstrated a similar appearance and size of mass, 3.0 cm in the longest diameter. However, on (d) a coronal reformatted image at the level of the mass, the inferior component of the mass (arrow, d) has increased compared with the prior study (b), indicating increase of tumor burden, which is not captured by either RECIST or World Health Organization (WHO) measurements.
Figure 7d:
Limitations of response assessment using RECIST in a 58-year-old woman with stage IV adenocarcinoma of the lung. (a, b) Contrast-enhanced axial and coronal CT images of the chest during pemetrexed and cisplatin therapy demonstrate a spiculated mass in the left upper lobe. The measurement of the dominant mass according to RECIST was 2.9 cm, measured in the longest diameter on an axial plane. Note a small nodular component of the mass at its inferior portion (arrow, b). (c, d) At follow-up CT during therapy, (c) the axial plane at the level of the longest diameter of the mass demonstrated a similar appearance and size of mass, 3.0 cm in the longest diameter. However, on (d) a coronal reformatted image at the level of the mass, the inferior component of the mass (arrow, d) has increased compared with the prior study (b), indicating increase of tumor burden, which is not captured by either RECIST or World Health Organization (WHO) measurements.
Substantial intra- and interobserver measurement variability has been documented by using both WHO criteria and RECIST. Erasmus et al (36) studied the consistency of size measurements in 40 lung tumors assessed on CT scans and reported that the probability of misclassifying a tumor progression was 43% with WHO criteria and 30% with RECIST. In a study by Zhao et al (37) of 32 NSCLC patients who underwent same-day repeat CT, the 95% limits of agreement of tumor size measurements ranged from (−18.3%, 15.5%) to (−22.8%, 23.0%) for unidimensional measurements, and from (−25.6%, 22.3%) to (−38.9%, 39.1%) for bidimensional measurements. Their findings indicate that, despite considerable variability, the measurements were reproducible within the partial response category (−30% unidimensional change for RECIST and −50% bidimensional change for WHO criteria). However, the cutoff values for progression (+20% unidimensional change for RECIST and +25% bidimensional change for WHO criteria) were within the range of measurement variability, indicating that some patients were unnecessarily placed in the progressive disease category (37). A recent study of measurement variability in 53 lung lesions in 23 patients with advanced NSCLC also demonstrated similar results, demonstrating the 95% limits of agreements of (−23.1%, 24.4%) for unidimensional mesurements and (−34.0%, 48.6%) for bidimensional measurements (38).
The revised RECIST (RECIST 1.1) has slightly better performance in terms of measurement variability compared with RECIST 1.0. Nishino et al (34) compared RECIST 1.1 and RECIST 1.0 in 43 patients with advanced NSCLC treated with erlotinib and showed that RECIST 1.1 was more reproducible, with narrower 95% limits of interobserver agreement (−18.6%, 25.4%) compared with those of RECIST 1.0 (−30.8%, 30.4%), while RECIST 1.1 was highly concordant with RECIST 1.0 in terms of response assessment (weighted κ = 0.905). Smaller measurement variability of RECIST 1.1 is likely due to the reduction of number of target lesions and possibly due to the use of short-axis measurements for lymph nodes. Given the simplicity and practicality of unidimensional measurements, as well as the smaller measurement variability, RECIST is more commonly used in response assessment than WHO criteria. RECIST 1.1, with its detailed guidelines and modifications to meet rapid therapeutic and technical advances, has been quickly replacing RECIST 1.0 in clinical trials and practice since its publication in 2009.
In certain clinical situations, these conventional criteria, originally designed to assess response to cytotoxic chemotherapy, do not capture all the patterns of response and progression in genomically defined subsets of tumors treated with effective molecular targeted therapies (9). A representative example is gastrointestinal stromal tumor treated with the tyrosine kinase inhibitor imatinib (Gleevec; Novartis, East Hanover, NJ), where a decrease in tumor attenuation at CT is more likely to represent response rather than size decrease (39,40). In advanced melanoma treated with immunotherapy, additional radiographic patterns of response are noted, including response after initial increase of tumor burden and response (manifesting as decrease in tumor burden ≥50% relative to baseline) during or after the appearance of new lesions (41). Lessons learned in these tumors are important in response assessment of lung cancer, because they clearly delineated the limitations of the conventional criteria in the setting of new therapeutic agents. In addition, therapeutic discoveries in one type of solid tumor are being translated into other tumors, as represented by the use of ipilimumab, an approved immunotherapeutic agent for melanoma, in a phase II trial of advanced NSCLC (42).
One of the significant limitations of the WHO criteria and RECIST in lung cancer is the assessment of tumor cavitation (43–45). NSCLC treated with antiangiogenic therapy, such as bevacizumab (Avastin; Genentech, South San Francisco, Calif), often demonstrates tumoral cavitation (43–45) (Fig 8). An alternative method of measurement of cavitary lesions excluding the area of cavitation has been proposed and has been shown to alter response assessment and the determination of time to progression in some patients; however, the impact of the method in prediction of outcomes remains to be investigated (44).
Figure 8a:

Development of tumoral cavitation in a 64-year-old man with stage IV adenocarcinoma of the lung treated with bevacizumab, carboplatin, and paclitaxel. (a) Contrast-enhanced CT scan of the chest demonstrated a solid mass in the right upper lobe. The patient was subsequently treated with bevacizumab, carboplatin, and paclitaxel. (b) Follow-up CT at 1.5 months from the initiation of therapy demonstrated a development of tumoral cavitation within the mass. Since the cavity does not contain viable tumor cells, simply measuring the longest diameter of the mass may underestimate the response to treatment, representing one of the pitfalls of RECIST. (c) Follow-up CT at 4 months of therapy demonstrated further cavitation of the tumor occupying the majority of the tumor, with irregular and nodular components along the wall of the tumor.
Figure 8b:

Development of tumoral cavitation in a 64-year-old man with stage IV adenocarcinoma of the lung treated with bevacizumab, carboplatin, and paclitaxel. (a) Contrast-enhanced CT scan of the chest demonstrated a solid mass in the right upper lobe. The patient was subsequently treated with bevacizumab, carboplatin, and paclitaxel. (b) Follow-up CT at 1.5 months from the initiation of therapy demonstrated a development of tumoral cavitation within the mass. Since the cavity does not contain viable tumor cells, simply measuring the longest diameter of the mass may underestimate the response to treatment, representing one of the pitfalls of RECIST. (c) Follow-up CT at 4 months of therapy demonstrated further cavitation of the tumor occupying the majority of the tumor, with irregular and nodular components along the wall of the tumor.
Figure 8c:
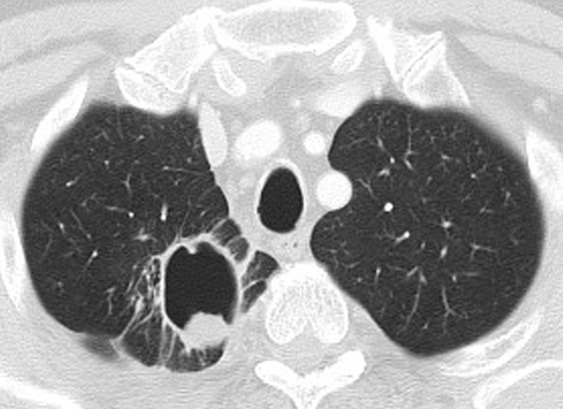
Development of tumoral cavitation in a 64-year-old man with stage IV adenocarcinoma of the lung treated with bevacizumab, carboplatin, and paclitaxel. (a) Contrast-enhanced CT scan of the chest demonstrated a solid mass in the right upper lobe. The patient was subsequently treated with bevacizumab, carboplatin, and paclitaxel. (b) Follow-up CT at 1.5 months from the initiation of therapy demonstrated a development of tumoral cavitation within the mass. Since the cavity does not contain viable tumor cells, simply measuring the longest diameter of the mass may underestimate the response to treatment, representing one of the pitfalls of RECIST. (c) Follow-up CT at 4 months of therapy demonstrated further cavitation of the tumor occupying the majority of the tumor, with irregular and nodular components along the wall of the tumor.
In addition, progression by RECIST criteria may not warrant termination of therapy for genomically defined subsets of NSCLC patients. In patients with EGFR-mutant NSCLC treated with EGFR-TKI, continued EGFR-TKI therapy may be indicated in those patients with progressive disease because these tumors grow slowly over many months and some tumor cells remain sensitive to EGFR-TKI (46). A recent study of 56 NSCLC patients harboring EGFR mutations treated with first-line EGFR-TKI, erlotinib or gefitinib, demonstrated that 88% of the patients continued EGFR-TKI therapy beyond progression according to RECIST, indicating that RECIST progression is no longer the determining factor to terminate TKI therapy (47). To further address this issue, an Asian multicenter phase II trial (ASPIRATION study; NCT01310036) in EGFR-mutant NSCLC patients treated with erlotinib is ongoing, in which continuation of erlotinib beyond RECIST progression is allowed at investigator’s discretion (48). Similarly, in a phase I trial of crizotinib (ALK inhibitor), patients were allowed to continue crizotinib after they met the criteria for RECIST progression, if clinically determined to benefit from therapy (49). Erlotinib and crizotinib are commonly continued beyond RECIST progression, because of an initial dramatic response followed by slow progression over many months in relatively asymptomatic patients. Among 116 patients in an expanded cohort of the phase I trial, 16 have continued taking crizotinib after documentation of RECIST progression (49). The data illustrates the limitations of the conventional criteria, which can no longer provide information necessary for therapeutic decision making, and illustrates the need for imaging definitions of slow progression. Detailed analyses of imaging findings of the trials that allowed continuation of targeted therapy beyond RECIST progression may help to establish such definitions and provide aids for treatment decisions.
CT Tumor Volumetry in Response Assessment
Significant technical progress in the development and clinical application of multidetector CT has enabled volumetric acquisition of large anatomic volumes with isotropic voxels. Three-dimensional volume measurement techniques have been developed by using high-resolution multidetector CT data. Such measurements can be used to determine the volume of lung nodules and obtain volume doubling time, allowing better differentiation of benign from malignant nodules (35). The volumetry technique was applied to lung tumors, initially to pulmonary metastases (50) and then in lung cancer (51) (Fig 9). Zhao et al (51) reported the initial results of computerized quantification of lung cancer in 2006. In their series of 15 patients treated with gefitinib, 20% or greater increase was noted in 73% of the patients by volume, compared with 27% by one-dimensional measurements and 40% by bidimensional measurements after adjusting for scale, with the median time between the baseline and follow-up examinations of 26.4 days (range, 21–35 days). Of note, the investigators of the study compared the measurements after conversion of the unidimensional and bidimensional measurements to an equivalent volume by using the standard methods described in RECIST (33,51).
Figure 9a:
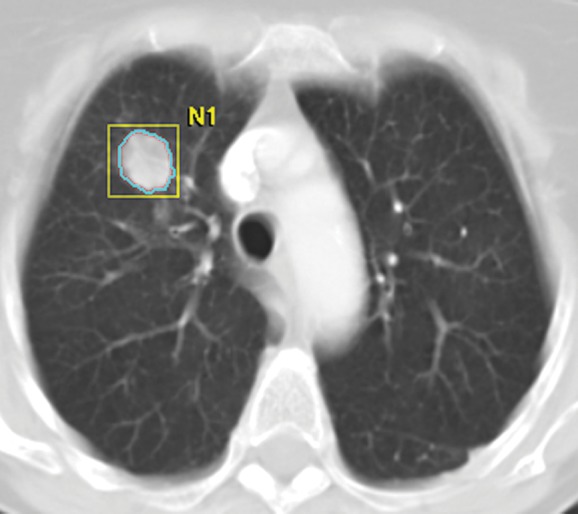
Tumor volume measurement in advanced NSCLC. (a) Contrast-enhanced CT scan of the chest in a 75-year-old woman prior to therapy demonstrates a dominant nodule in the right upper lobe. Clicking a small region of interest within the lesion allows the software to automatically segment the lesion. The boundary of the lesion can be adjusted manually if necessary. (b, c) The segmented tumor is displayed in a three-dimensional fashion and the tumor volume is obtained.
Figure 9b:
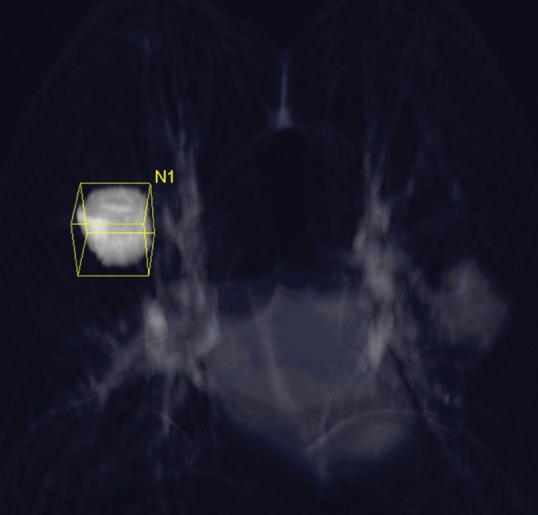
Tumor volume measurement in advanced NSCLC. (a) Contrast-enhanced CT scan of the chest in a 75-year-old woman prior to therapy demonstrates a dominant nodule in the right upper lobe. Clicking a small region of interest within the lesion allows the software to automatically segment the lesion. The boundary of the lesion can be adjusted manually if necessary. (b, c) The segmented tumor is displayed in a three-dimensional fashion and the tumor volume is obtained.
Figure 9c:
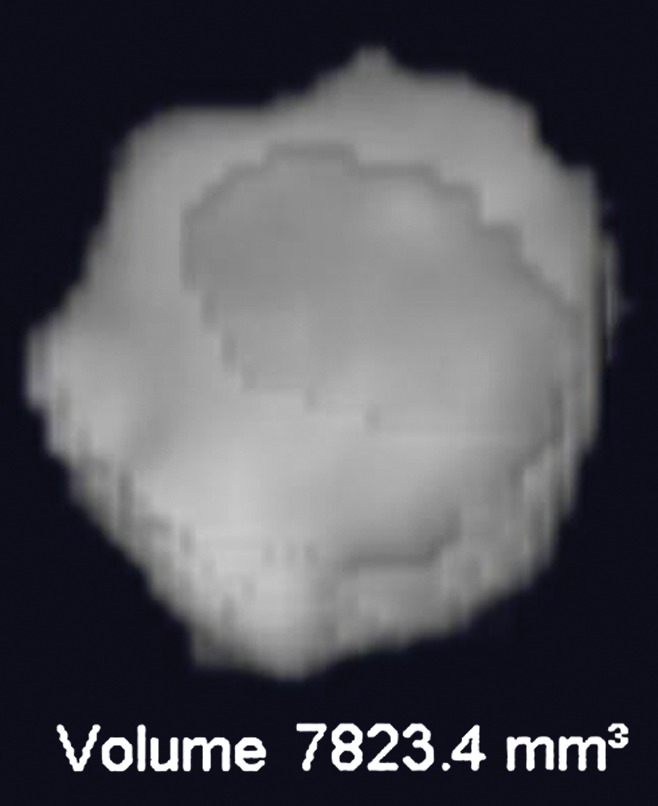
Tumor volume measurement in advanced NSCLC. (a) Contrast-enhanced CT scan of the chest in a 75-year-old woman prior to therapy demonstrates a dominant nodule in the right upper lobe. Clicking a small region of interest within the lesion allows the software to automatically segment the lesion. The boundary of the lesion can be adjusted manually if necessary. (b, c) The segmented tumor is displayed in a three-dimensional fashion and the tumor volume is obtained.
Multiple studies have demonstrated that volume measurement in lung tumors is more reproducible than size measurement (37,38,52). Mozley et al (52) studied 10 patients with advanced NSCLC with 13 morphologically complex target lesions who were evaluated by seven different teams. The interobserver agreement between volume measurements was significantly better than between unidimensional longest-diameter measurements. In a study of 23 advanced NSCLC patients with 53 lung lesions by Nishino et al (38), volume measurement had slightly better interobserver agreement than unidimensional measurement, with 95% limits of agreement of (−26.0%, 18.6%) for volume and (−23.1%, 24.4%) for unidimensional measurements.
More recently, Zhao et al (53) reported that volumetric tumor measurements during gefitinib treatment could be used to distinguish tumors with a sensitizing mutation from those without the mutation. They studied 48 tumors (21 EGFR-mutant and 27 EGFR wild-type) in stage I or II NSCLC patients treated with neoadjuvant gefitinib in a phase II trial. They reported that volumetric measurement was significantly better compared with unidimensional measurements for distinguishing tumors with or without EGFR mutations, because of the volume decrease of EGFR-mutant tumors during therapy. In their study cohort, a tumor volume decrease greater than 24.9% after neoadjuvant therapy separated tumors with sensitizing mutations, with a sensitivity of 90% and a specificity of 89%. The results suggested that volume-based response assessment would be useful in the development and documentation of tissue biomarkers of tumor response (53).
The association between CT tumor volume and survival in lung cancer has been described in a few reports, mostly in NSCLC patients treated with radiation therapy or preoperative chemotherapy and chest radiation therapy (54–56). In a study of 270 consecutive patients with inoperable stage I–IIIB NSCLC treated with chemotherapy plus chest radiation therapy, larger gross tumor volume (including both primary and nodal disease) and gross tumor volume of primary disease before therapy was significantly associated with shorter survival (54). More recently, a prospective study of 13 patients with locally advanced NSCLC treated with preoperative chemotherapy plus chest radiation and resection demonstrated that larger gross tumor volume (including both primary and nodal tumor volume) was associated with shorter PFS. Patients with gross tumor volume greater than or equal to median had 3-year PFS of 14%, compared with 75% for patients with gross tumor volume less than median (56). However, the utility of CT tumor volume assessment as a predictive marker for survival in advanced NSCLC treated with systemic therapy or effective molecular targeting therapy in genomically defined cohorts remains to be established. Appropriate thresholds for response by means of CT tumor volume change in lung cancer also remain to be determined, based on correlation with survival and the measurement variability.
CT Tumor Perfusion
Further advances in multidetector CT technology have enabled assessment of vascularity and perfusion of lung lesions by using DCE CT. DCE CT acquires clusters of images sequentially at a given time throughout a lesion following the intravenous injection of contrast material, allowing for the comparison of the extent of contrast enhancement at different time points during the examination (57,58).
Reproducibility of Tumor CT Perfusion Measurements in Lung Cancer
In a prospective study in 2006 by Ng et al (59), 10 patients with stage III or IV inoperable NSCLC underwent CT scanning with whole-tumor perfusion technique using 16–detector row CT. Perfusion parameters demonstrated good agreement between studies, with a coefficient of variation of 9.49% for permeability and 26.31% for blood volume, which were comparable to prior animal and human studies. Inter- and intraobserver agreement for both permeability and blood volume had a coefficient of variation between 3.30% and 6.34%, indicating that the whole-tumor technique can provide reliable assessment for tumor perfusion (59). Ng et al (60) reported that greater z-axis coverage may improve reproducibility of tumor perfusion measurement.
However, a prospective study of reproducibility comparing perfusion measurements by using two commercial software packages based on different perfusion models demonstrated significant disagreement. The measurements by software using Patlak analysis were 1.34 times higher for permeability and 1.65 times higher for blood volume on average, compared with the measurements using software with distributed parameter analysis, indicating the perfusion measures by different software packages are not directly interchangeable (61). The same software package must be used in measurements before and after therapy in each patient. It is important to report the types of software used in the study when attempting to apply the results in one’s own practice.
In a study of 11 lung tumors by Ng et al (62), the absolute values and reproducibility of CT perfusion parameters were markedly influenced by patient motion, and motion correction reduced variability from 70%–90% to 26%–50% in terms of the within-patient coefficient of variance. Reproducibility also depends on tumor size, with smaller lesions having lower agreement; the within-subject coefficients of variation in tumors smaller than 4 cm ranged 25%–46%, compared with 19%–33% for tumors 4 cm or larger (63).
CT Tumor Perfusion Parameters Correlated with Pathologic Findings
Tumor perfusion measured by using CT has been shown to reflect tumor vascularity at histologic examinations. In a prospective study (64) of 15 NSCLC patients with surgically treatable disease, preoperative perfusion CT was performed by using 64-detector CT with whole-tumor coverage, and the blood volume and the volume transfer constant (Ktrans) were scored by using a four-point color scale. In this study utilizing Patlak analysis based on a two-compartment model, Ktrans describes the portion of blood flow extracted into the extravascular space. In well-perfused tumors such as lung cancer, Ktrans is close to the permeability–surface area product. Therefore high Ktrans can be interpreted as high capillary permeability, which is a well-known characteristic of tumor vessels (64). Detailed pathologic-CT correlation demonstrated two patterns of perfusion parameters suggestive of high tumoral vascularity: (a) areas with low blood volume and high Ktrans had a significantly higher mean vessel number per area compared with areas with low blood volume and low Ktrans; (b) a higher vascular score at pathologic evaluation was more frequent in low blood volume and high Ktrans areas than in low blood volume and low Ktrans areas (64). The results indicate a role for DCE CT in assessing tumoral vascularity changes in NSCLC patients receiving antiangiogenic therapy.
CT Tumor Perfusion in Response Assessment in Lung Cancer
Several recent studies have attempted to evaluate CT tumor perfusion changes by correlating perfusion parameters with RECIST response during treatment and survival. In a study by Wang et al (65), 35 stage IIB–IV NSCLC patients treated with chemotherapy, chest radiation therapy, or concurrent chemotherapy plus chest radiation therapy underwent baseline perfusion CT. Baseline blood flow and blood volume in 21 patients with partial response by RECIST were significantly higher compared with 14 patients with stable disease or progressive disease. In 22 patients who underwent follow-up perfusion CT after therapy, patients with decreased permeability–surface area product had four times longer PFS and overall survival (OS) (median PFS and OS: 19.0 and 19.3 months, respectively), compared with those with increased permeability–surface area product (median PFS and OS: 4.7 and 10.6 months, respectively) (65).
CT tumor perfusion was recently evaluated in a multicenter phase II trial of sorafenib and erlotinib in 23 chemotherapy-naïve patients with inoperable, locally advanced, or metastatic NSCLC. DCE CT was prospectively performed at baseline and at 3 and 6 weeks of therapy (66). Tumor blood flow, calculated by using maximum slope method, in the responders by RECIST (complete response/partial response) was not significantly different at baseline compared with nonresponders (stable disease/progressive disease); however, tumor blood flow in responders was significantly lower at 3 and 6 weeks of therapy than that in nonresponders. Patients with greater decrease in tumor blood flow at 6 weeks showed a trend toward a longer PFS than those with smaller decrease (7.1 months versus 5.7 months, P = .06) (66). In a different prospective study of 45 patients with unresectable lung adenocarcinoma by Fraioli et al (67), perfusion CT scanning was performed at baseline and 40 and 90 days after first-line platinum-based chemotherapy and bevacizumab. Patients with partial response by RECIST at 40-day follow-up had higher baseline blood flow and permeability compared with other patients.
These studies provided initial results of CT tumor perfusion as an advanced imaging technique in lung cancer. Standardization of technique and measurement methods will be required for this promising technology to be applied widely in oncology practice as a measure for effective anticancer therapy. It is also necessary to establish an appropriate threshold for tumor perfusion changes during therapy that can predict survival, since correlation of perfusion parameters with conventional RECIST response groups may be of limited use in the long term. The antiangiogenic agents targeting vascular endothelial growth factor, such as bevacizumab, have been developed and used in NSCLC patients as newer effective therapeutic options. In this context, CT tumor perfusion may provide additional parameters reflecting tumor response to therapy, which cannot be fully characterized by using conventional size-based criteria alone. Further studies in changes of perfusion parameters after antiangiogenic therapy may also provide insights into the biologic mechanisms of such therapy.
DCE and Diffusion-weighted Imaging
The recent development of DCE MR imaging techniques using gadolinium chelates has enabled detailed, noninvasive assessment of tumor perfusion and vascularity, which provides quantitative pharmacokinetic parameters without the use of ionizing radiation (68,69). DCE MR imaging has been extensively studied in the diagnosis of malignant solitary pulmonary nodules (Fig 10) (70–75). Diffusion-weighted imaging reflects the diffusion motion of water protons in tissues, producing different contrast in different kinds of tissues (76), and has also been applied in differentiating malignant versus benign lung nodules (76–78). Both DCE MR imaging and diffusion-weighted imaging are currently under active investigation to determine their usefulness in monitoring tumor response to therapy.
Figure 10a:
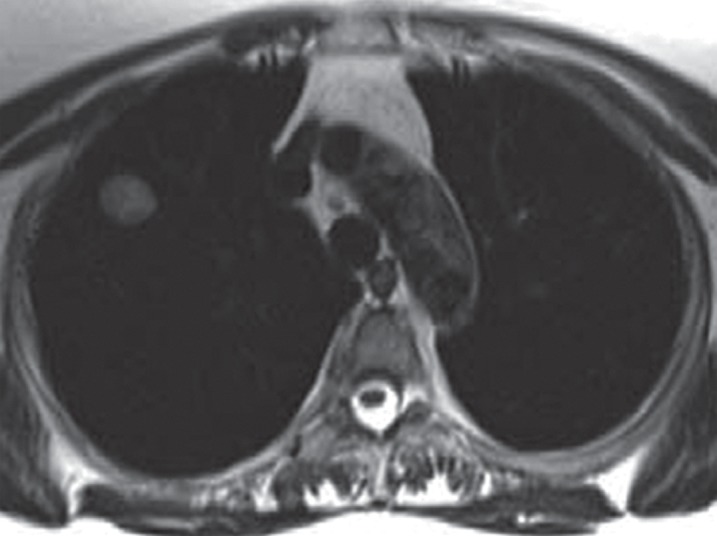
Images in a 65-year-old man with right upper lobe adenocarcinoma, with tracer transport rate constant (kep) of 3.2 min−1. (a) Axial T2-weighted half-Fourier acquisition single-shot turbo spin-echo MR image (pulse repetition time msec/echo time msec = 1200/100; field of view [FOV] = 400 mm; 320 × 320; one signal acquired; bandwidth [BW] = 780 kHz; flip angle [FA] = 150°; echo train length [ETL] = 256; 5.5-mm section thickness, 1.6-mm intersection gap; acquisition time = 6 min) and (b) postcontrast (gadopentetate dimeglumine 0.1 mmol/kg bolus injection) sagittal T1-weighted volumetric interpolated breath-hold examination MR image (3.4/1.3; FOV = 400 mm; 260 × 320; one signal acquired; BW = 505 kHz; FA = 10°; 4-mm section thickness, 0-mm intersection gap; acquisition time = 1.7 min) demonstrate right upper lobe lesion representing adenocarcinoma. (c) Representative parametric maps of tumor area on T1-weighted MR image (500/1.6, FOV = 400 mm, 192 × 180, one signal acquired, BW = 360 kHz, FA = 10°, 5-mm section thickness, oblique sagittal orientation, 124 frames, 2 seconds per frame, acquisition time = 4 min, gadopentetate dimeglumine 0.1 mmol/kg intravenously). Left panel: Goodness-of-fit map color-coded according to confidence level of χ2 test overlaid on T1-weighted image. Middle panel: Boundaries of voxels with more than 50% confidence level of χ2 test are superimposed on T1-weighted image. Right panel: Color-coded kep map. The map shows kep values of the entire tumor area. The kep values within the boundaries of the middle panel were used for the evaluation. The isolated voxel at the edge of the tumor is a single voxel. (Reprinted, with permission, from reference 75.)
Figure 10b:
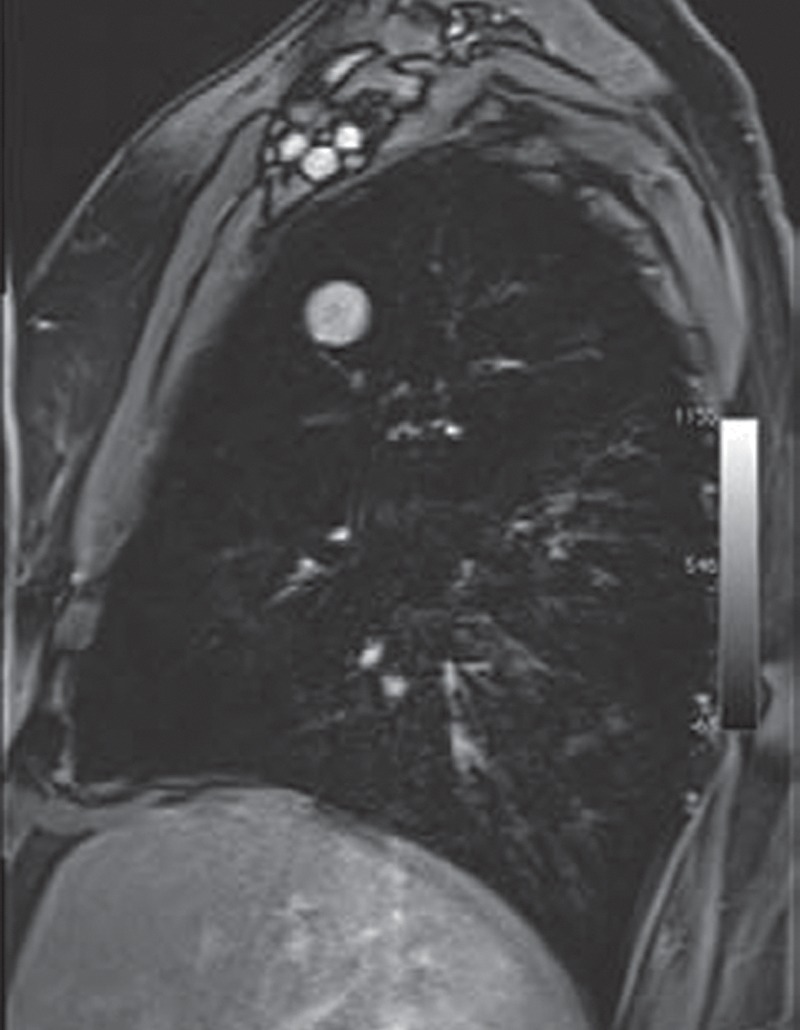
Images in a 65-year-old man with right upper lobe adenocarcinoma, with tracer transport rate constant (kep) of 3.2 min−1. (a) Axial T2-weighted half-Fourier acquisition single-shot turbo spin-echo MR image (pulse repetition time msec/echo time msec = 1200/100; field of view [FOV] = 400 mm; 320 × 320; one signal acquired; bandwidth [BW] = 780 kHz; flip angle [FA] = 150°; echo train length [ETL] = 256; 5.5-mm section thickness, 1.6-mm intersection gap; acquisition time = 6 min) and (b) postcontrast (gadopentetate dimeglumine 0.1 mmol/kg bolus injection) sagittal T1-weighted volumetric interpolated breath-hold examination MR image (3.4/1.3; FOV = 400 mm; 260 × 320; one signal acquired; BW = 505 kHz; FA = 10°; 4-mm section thickness, 0-mm intersection gap; acquisition time = 1.7 min) demonstrate right upper lobe lesion representing adenocarcinoma. (c) Representative parametric maps of tumor area on T1-weighted MR image (500/1.6, FOV = 400 mm, 192 × 180, one signal acquired, BW = 360 kHz, FA = 10°, 5-mm section thickness, oblique sagittal orientation, 124 frames, 2 seconds per frame, acquisition time = 4 min, gadopentetate dimeglumine 0.1 mmol/kg intravenously). Left panel: Goodness-of-fit map color-coded according to confidence level of χ2 test overlaid on T1-weighted image. Middle panel: Boundaries of voxels with more than 50% confidence level of χ2 test are superimposed on T1-weighted image. Right panel: Color-coded kep map. The map shows kep values of the entire tumor area. The kep values within the boundaries of the middle panel were used for the evaluation. The isolated voxel at the edge of the tumor is a single voxel. (Reprinted, with permission, from reference 75.)
Figure 10c:

Images in a 65-year-old man with right upper lobe adenocarcinoma, with tracer transport rate constant (kep) of 3.2 min−1. (a) Axial T2-weighted half-Fourier acquisition single-shot turbo spin-echo MR image (pulse repetition time msec/echo time msec = 1200/100; field of view [FOV] = 400 mm; 320 × 320; one signal acquired; bandwidth [BW] = 780 kHz; flip angle [FA] = 150°; echo train length [ETL] = 256; 5.5-mm section thickness, 1.6-mm intersection gap; acquisition time = 6 min) and (b) postcontrast (gadopentetate dimeglumine 0.1 mmol/kg bolus injection) sagittal T1-weighted volumetric interpolated breath-hold examination MR image (3.4/1.3; FOV = 400 mm; 260 × 320; one signal acquired; BW = 505 kHz; FA = 10°; 4-mm section thickness, 0-mm intersection gap; acquisition time = 1.7 min) demonstrate right upper lobe lesion representing adenocarcinoma. (c) Representative parametric maps of tumor area on T1-weighted MR image (500/1.6, FOV = 400 mm, 192 × 180, one signal acquired, BW = 360 kHz, FA = 10°, 5-mm section thickness, oblique sagittal orientation, 124 frames, 2 seconds per frame, acquisition time = 4 min, gadopentetate dimeglumine 0.1 mmol/kg intravenously). Left panel: Goodness-of-fit map color-coded according to confidence level of χ2 test overlaid on T1-weighted image. Middle panel: Boundaries of voxels with more than 50% confidence level of χ2 test are superimposed on T1-weighted image. Right panel: Color-coded kep map. The map shows kep values of the entire tumor area. The kep values within the boundaries of the middle panel were used for the evaluation. The isolated voxel at the edge of the tumor is a single voxel. (Reprinted, with permission, from reference 75.)
DCE MR imaging and diffusion-weighted imaging have been studied recently as a method to assess response to systemic anticancer therapy in NSCLC patients, as summarized in Table 3. Because DCE MR imaging is expected to reflect tumor vascularity, investigations in the vascularity of tumors treated with anti–vascular endothelial growth factor (VEGF) therapy are of considerable interest. In a retrospective study of 94 patients with small peripheral lung cancer, the maximum enhancement ratio and the slope of the time–signal intensity curve were positively correlated with microvessel counts at pathologic evaluation. VEGF-positive tumors, defined based on immunostaining using antibody directed against VEGF, had significantly higher slope value than VEGF-negative tumors (44.9%/min vs 19.6%/min, respectively) and were associated with shorter survival (79). DCE MR imaging was recently studied in a single-center phase II trial of sorafinib (a multikinase inhibitor targeting Raf and VEGF receptors 1, 2, 3) involving 37 NSCLC patients. A kep change of less than −0.15 at 14 days of therapy compared with baseline was significantly associated with longer OS (P = .035) and longer PFS (P = .029), indicating the value of kep on DCE MR images as a marker for early angiogenic inhibition (80). Among five studies of DCE MR imaging in Table 3, three studies assessed response to targeted therapy using antiangiogenic agents, either using bevacizumab in combination with erlotinib or using sorafinib.
Table 3.
Summary of Studies Evaluating DCE and/or Diffusion-weighted MR Imaging for Therapeutic Response and Clinical Outcome in NSCLC
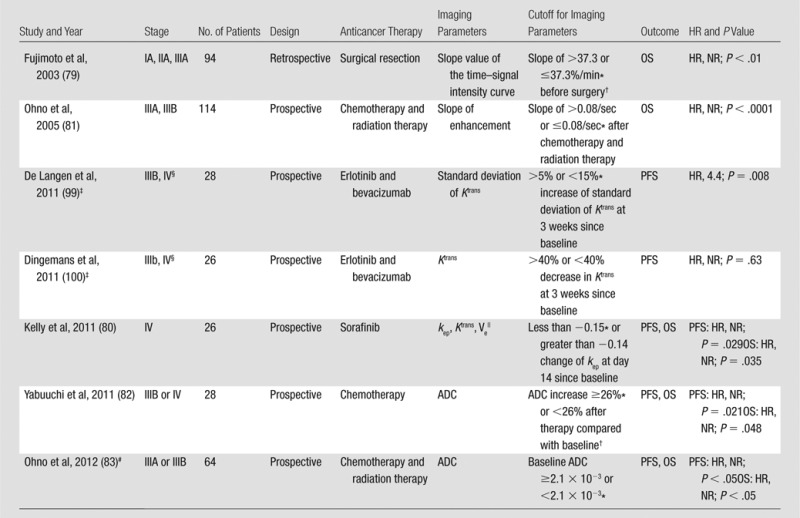
Note.—ADC = apparent diffusion coefficient, HR = hazard ratio, NR = not reported, kep is to and from plasma and the extravascular extracellular space, Ktrans = the transendothelial transfer constant, Ve = extravascular extracellular space volume densities.
Indicates the group with longer survival.
The cutoff value was the median value obtained in the study group.
The studies also evaluated the association between FDG PET and outcome (see Table 4).
Included only nonsquamous histology.
Nonsignificant differences were associated with volume transfer constant and extravascular extracellular space volume densities (Ve).
The study also demonstrated significant association between baseline maximum SUV and survival (P < .05 for PFS and OS).
DCE MR imaging in NSCLC also has been studied in the context of chemotherapy and radiation therapy. Ohno et al (81) retrospectively studied 114 NSCLC patients treated with chemotherapy plus chest radiation therapy. Twenty-two patients achieving local control had significantly lower maximum relative enhancement ratio and slope of relative enhancement (mean: 0.47 and 0.06/sec, respectively) compared with 92 patients with local failure (mean: 0.64 and 0.12/sec, respectively). The survival was significantly longer in the group with a slope enhancement of 0.08/sec or less, with mean survival of 26.1 months compared with 14.8 months among those with a slope enhancement 0.08/sec or more.
Recently, diffusion-weighted imaging has been considered as a potential marker associated with tumor response and survival in lung cancer (Table 3). In 28 NSCLC patients with stage IIIB–IV treated with chemotherapy, an increase in apparent diffusion coefficient greater than or equal to median was able to distinguish patients with longer PFS and OS (median: 12.1 and 22.4 months, respectively) from those with shorter PFS and OS (median: 6.67 and 12.3 months, respectively) (82). In 64 patients with stage III NSCLC treated with chemotherapy with chest radiation therapy, apparent diffusion coefficient measured on pretherapeutic diffusion-weighted images was more accurate than FDG PET/CT in predicting partial response versus stable disease/progressive disease groups (76.6% versus 67.2%, respectively) (83).
The promising results of DCE MR imaging and diffusion-weighted imaging in response assessment in NSCLC suggest that parameters obtained from MR imaging may provide additional information regarding biologic changes of tumors in response to treatment. In addition, the changes of these parameters are associated with changes in tumoral vacularity assessed by microvessel counts, providing insights into the mechanism of antitumor activity of antiangiogenic agents. Issues that remain to be solved are the standardization of the techniques for image acquisition, image processing and analysis, the determination of range of measurement variability, and response criteria.
PET Imaging
Using a glucose analog as a tracer, FDG PET allows for noninvasive in vivo assessment of glucose metabolism of tumors. Standardized uptake value (SUV) and maximum SUV are the most commonly used quantitative parameters derived from PET studies (8). FDG PET is used in differentiating benign versus malignant nodules (58,84), as well as in staging of lung cancer (85). In addition, several studies investigated the association between EGFR mutation status and FDG avidity on PET images (86,87). A retrospective study by Mak et al (86) of 100 NSCLC patients (24 EGFR-mutant and 76 wild-type) demonstrated that high FDG avidity (normalized maximum SUV ≥5, normalized compared to the SUV of blood in the pulmonary artery) correlated with EGFR wild-type genotype. Further work is needed to validate the role of PET in providing useful information for genomic and molecular characteristics of lung cancer.
FDG PET in Response Assessment
The role of FDG PET in response assessment in lung cancer has been extensively studied in the past decade, with an expectation that FDG PET may be able to depict more rapid and meaningful changes in cellular metabolism of tumors during therapy than the conventional anatomy-based imaging. Despite the increasing clinical attention and recognition of the utility of FDG PET in response assessment and therapy monitoring, there has not been a general consensus among investigators regarding methodology, measurement parameters, and response definition (88). Multiple studies have reported high reproducibility and repeatability of metabolic measurements of tumors with PET imaging (89–91). However, variations in PET methodology across different institutions make it difficult to compare results from one study to another. A recent study by Graham et al (92) demonstrated considerable variations in PET/CT methodology for oncologic imaging across academic institutions in the United States. Variations were observed in patient preparation, scanner type, performance approach, display, and analysis. Such wide variations limit the use of a “common language” to describe therapeutic response at PET/CT. Additional standardization in methodology will be required for PET/CT studies to be more comparable across sites (92).
Hicks (88) summarized the aggregated data in 12 studies evaluating the association between PET response to conventional cytotoxic therapy and survival in lung cancer patients with various stages. These data suggest that a reduction in tumor FDG retention is more likely to be associated with both pathologic response and improved survival. However, variations in the measures of response and the response criteria are impediments to the qualification and clinical application of FDG PET as a biomarker (88). The role of FDG PET/CT currently is being prospectively investigated in an ongoing trial sponsored by the National Institutes of Health Biomarkers Consortium, which may facilitate standardization of FDG PET/CT response criteria.
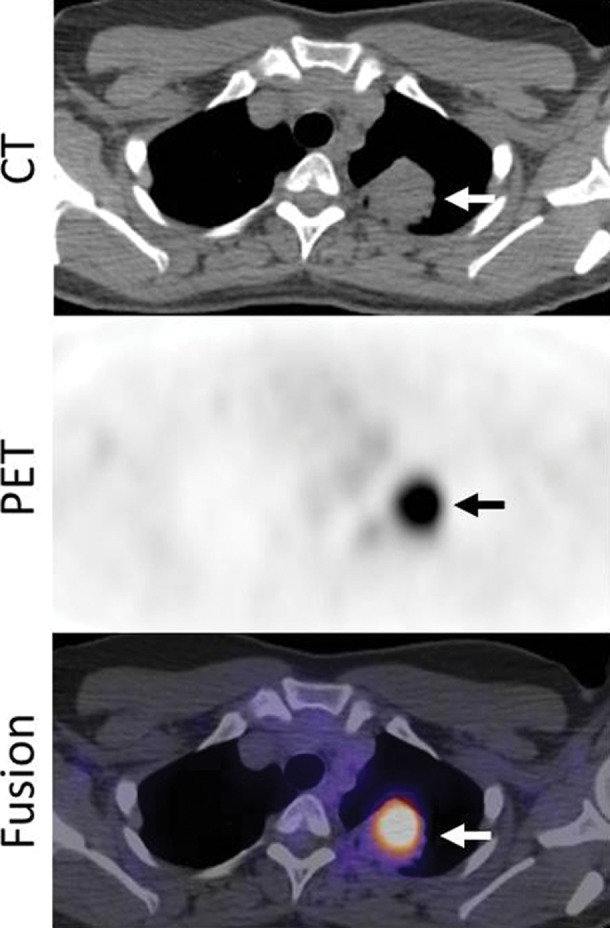
Because of the increased use of molecular targeting therapy in NSCLC patients, recent investigations have attempted to address the utility of FDG PET in quantifying metabolic response of tumors to targeted therapy, as summarized in Table 4 (Fig 11). In a study of 34 patients with previously untreated stage IV NSCLC treated with erlotinib, peak SUV changes after 1 week of therapy predicted nonprogression after 6 weeks. Early metabolic FDG response (≥30% peak SUV decrease at 1 week) predicted longer PFS and OS (median: 7.8 and 16.1 months, respectively, for responders; 1.5 and 3.4 months, respectively, for nonresponders) (93). In a multicenter study including second- and third-line NSCLC patients treated with erlotinib, patients with partial metabolic response at 2 weeks had prolonged PFS (5.5 versus 2.5 months) and OS (11.6 versus 7.6 months) compared with nonresponders, even in the absence of subsequent RECIST response (94). Another study of 19 stage IIIA–IV NSCLC patients showed that greater than 20% decrease of maximum SUV at 2 days of gefitinib therapy was associated with longer PFS (95). In a phase II study of 38 patients with stage IIIB or IV NSCLC treated with erlotinib, stable disease/progressive disease at 6 weeks on PET studies, using the European Organization for Research and Treatment of Cancer criteria (≥25% decrease in FDG uptake for response, and ≥25% increase in FDG uptake for progression), predicted lack of CT response at 12 weeks and was associated with shorter OS (96,97). More recently, Bengtsson et al (98) demonstrated that the presence of new lesions on PET studies at 2 weeks of erlotinib therapy was associated with shorter OS in 100 patients with refractory or recurrent NSCLC, including 10 patients with EGFR mutation. In stage IIIB or IV NSCLC patients treated with erlotinib and bevacizumab, greater than 20% decrease of FDG uptake at 3 weeks was associated with longer PFS in two prospective studies (99,100).
Table 4.
Summary of Prospective Studies Evaluating PET with 18F-FDG for Therapeutic Response and Clinical Outcome in NSCLC treated with EGFR-TKI

Note.— HR = hazard ratio, NR = not reported.
If EGFR mutation testing was performed, the numbers in the parentheses represent the number of patients positive for EGFR mutations/the number of patients tested for EGFR mutations.
The criteria represent the cutoff values of the SUV changes at the specified times compared with baseline, that were used to categorize patients into groups for survival analysis.
The studies also evaluated DCE MR imaging (see Table 3).
Included only nonsquamous histology.
The study also evaluated 18F-fluorothymidine PET (HR, 0.31; P = .04 for PFS; HR, 0.56; P = .3 for OS).
The study also evaluated H215O PET, which was associated with PFS using the same response criteria (HR, 0.25; P = .009).
Mean SUV was calculated for primary tumor volumes of interest and corrected for lean body mass.
The study also evaluated 18F-fluorothymidine PET (for PFS: HR, 0.41, P = .74 at day 14; HR, 0.38, P = .62 at day 56; for OS: HR, 0.87, P = .74 at day14, HR, 0.80, P = .62 at day 56).
The study enrolled 47 patients who underwent EGFR mutation testing, while 38 of 47 patients had analyzable scans at 6 weeks.
The sum of all radioactive counts in all of the volumes of interest representing all of the target lesions divided by the sum of all the voxels in all of the volume of interest representing the target lesions.
OS was compared among three groups including responders, PET stable disease, and PET progressive disease (defined as appearance of a new lesion[s] or ≥25% increase of FDG uptake) using European Organization for Research and Treatment of Cancer response criteria.
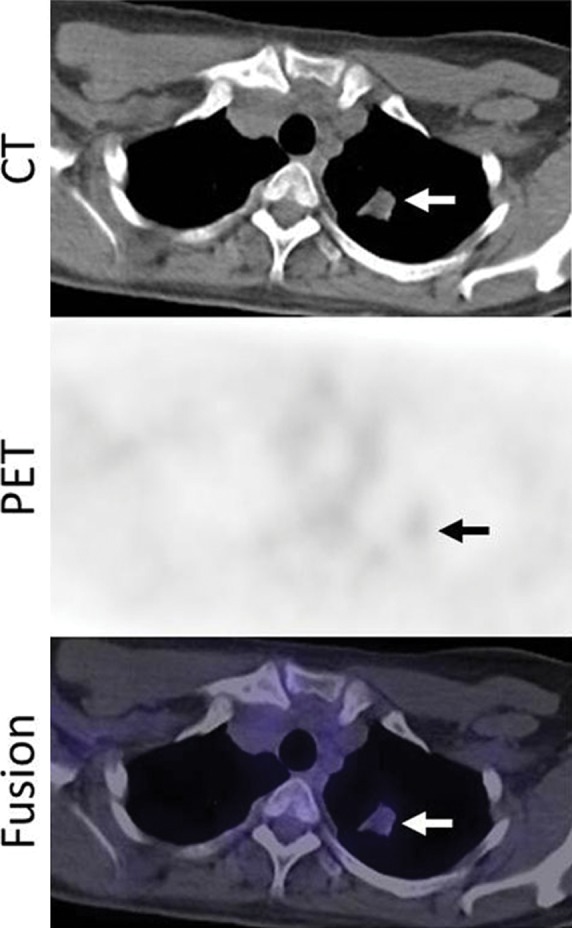
Figure 11a:
Images in a 53-year-woman with stage IV lung adenocarcinoma, harboring exon 19 deletion, treated with erlotinib. (a) A PET/CT scan prior to erlotinib therapy demonstrated a 3.7-cm dominant mass in the left upper lobe (arrows). The mass had an intense 18F-FDG uptake, with maximum SUV of 10.7. (b) Follow-up PET/CT scan during erlotinib therapy demonstrated a significant decrease in FDG uptake, with minimal residual uptake (maximum SUV: 1.5) (arrows). Tumor size has also decreased, measuring 2.1 cm in the longest diameter.
Figure 11b:
Images in a 53-year-woman with stage IV lung adenocarcinoma, harboring exon 19 deletion, treated with erlotinib. (a) A PET/CT scan prior to erlotinib therapy demonstrated a 3.7-cm dominant mass in the left upper lobe (arrows). The mass had an intense 18F-FDG uptake, with maximum SUV of 10.7. (b) Follow-up PET/CT scan during erlotinib therapy demonstrated a significant decrease in FDG uptake, with minimal residual uptake (maximum SUV: 1.5) (arrows). Tumor size has also decreased, measuring 2.1 cm in the longest diameter.
Wide variations of the measured parameters and the response criteria between studies continue to exist. In addition, most studies selected patients based on clinical factors, not on the specific genomic abnormalities known to be sensitive to EGFR-TKIs. Even in studies that performed EGFR mutation testing, only a small fraction of patients had EGFR mutation (Table 4). Because EGFR mutation testing is recommended for NSCLC patients who are being considered for first-line EGFR-TKI therapy (19), investigation of the role of FDG PET in response assessment should be carried out in genomically defined patients harboring specific mutations receiving targeted therapy.
Metabolic Tumor Volume at PET
Advances in image acquisition and processing with PET/CT technology have provided another potential marker for monitoring therapy response. Total body tumor burden, which reflects the volume of tumor tissue demonstrating increased FDG uptake at PET, or metabolic tumor volume (MTV), is now being evaluated as a novel potential prognostic factor (101). A retrospective review of 19 patients with lung cancer, which included 18 cases of NSCLC (stage I–IV) and one small-cell lung cancer treated with different treatment regimens, demonstrated that high tumor burden by using PET MTV at baseline was an independent poor prognostic feature in lung cancer (101). A similar observation was made in their retrospective study of 169 newly diagnosed NSCLC patients. Baseline metabolic tumor burdens were measured by using MTV and total lesion glycolysis, which was calculated by multiplying mean SUV by MTV (102). Their results demonstrated that baseline metabolic tumor burdens of whole-body tumor, primary tumor, nodal metastasis, and distant metastasis were prognostic measures that are independent of clinical stage (102). They also evaluated 92 patients with stage IV NSCLC treated with chemotherapy and/or radiation therapy and demonstrated that baseline higher whole-body tumor burden, measured with MTV and total lesion glycolysis, are associated with shorter OS (hazard ratio for one-unit increase of whole-body MTV and total lesion glycolysis: 1.48, 1.37, respectively) (103). Regarding MTV changes during therapy, Huang et al (104) prospectively studied 37 advanced NSCLC patients receiving chemotherapy plus chest radiation therapy. Changes in maximum SUV, mean SUV, and MTV at 28 days ± 3 of therapy were greater in RECIST responders than in nonresponders (percent change: 47.7 versus 28.0 for maximum SUV, 46.66 versus 24.98 for mean SUV, 46.87 versus 22.47 for MTV, respectively).
Volumetric measurement is increasingly utilized to evaluate whole-body tumor burden. This new era of volumetric assessment of cancer presents several tasks and challenges to the radiology community. These include the standardization of techniques and measurement methods so that the results can be applied across different institutions. The interpretation of quantitative values of “whole-body tumor burden” may mask potential heterogeneity of tumors within a patient, because response to therapy can be different between primary versus metastatic lesions or among metastatic lesions in different organs. The issue of tumoral heterogeneity presents important challenges to radiologists as well as to oncologists. As described earlier in the section on conventional response assessment using tumor size, tumoral heterogeneity at imaging can be either within a lesion or among lesions in a patient. Given its capability of depicting metabolic and functional changes of the tumor during therapy, PET may be used to more precisely visualize heterogeneous behavior of the tumor, as it can help differentiate viable versus nonviable portions of a tumor or viable versus nonviable lesions within the same patient. As indicated by Longo (105), the issue of heterogeneity within an individual tumor should not be underestimated in the future of oncology with personalized cancer care. While genomic studies of tumor continue to provide further understanding of the issue, radiologists have an important mission to translate the knowledge to accurate interpretation of imaging studies.
Beyond FDG: Functional and Molecular Imaging with Novel Agents
While 18F-FDG is the most commonly used PET tracer in clinical oncologic imaging, an increasing number of newer PET tracers are becoming available to visualize biologic behavior of tumors beyond glucose metabolism. A variety of biologic functions can be tested for novel PET imaging, including proliferation, hypoxia, and apoptosis (106). Radiolabeled ligands have been used to visualize and quantify therapeutic targets of molecular targeting therapy. Some anticancer agents, including erlotinib, can be radiolabeled and visualized in tumors to assess drug concentration in vivo (106). In this last section, we review some of the applications of these novel PET tracers in lung cancer.
Fluorine 18–fluorothymidine (FLT) is a thymidine analog and has been used to image tumor proliferation. FLT is phosphorylated by thymidine kinase 1, the key enzyme of the salvage pathway of DNA synthesis, and then trapped in the cell. The 18F-FLT uptake in tumors correlates with in vitro measures of proliferation in biopsy specimens (106). Uptake of FLT is dependent on cell proliferation and therefore may be useful in assessing anticancer activity of cytostatic molecular targeting agents. In preclinical models of EGFR-mutant lung cancer, reduction of FLT uptake during erlotinib therapy correlated with cell cycle arrest (107). Sohn et al (107) evaluated the usefulness of FLT PET at baseline and at 7 days after gefitinib therapy in 28 nonsmoking, stage IV NSCLC patients. The changes in FLT uptake after 7 days, measured as maximum SUV, were significantly different between responders and nonresponders according to WHO criteria. With a cutoff value of greater than 10.9% decrease in maximum SUV, the time to progression in 14 FLT responders was significantly longer than that in 14 FLT nonresponders (7.9 versus 1.2 months) (107). However, in a recent phase II trial of erlotinib in 34 stage IV NSCLC patients, FLT response at 1 week of therapy (defined as ≥30% reduction of peak SUV) predicted significantly longer PFS (Table 4), while it did not predict OS or nonprogression by using CT after 6 weeks of therapy (93). The difference in the results of two studies could be, at least in part, due to the difference in patient cohorts (adenocarcinoma in nonsmokers from Asia with likely high prevalence of EGFR mutations, versus a cohort from Europe with only four of 34 patients with sensitizing EGFR mutation) and the difference in CT criteria used to classify responders and nonresponders (WHO criteria versus RECIST). The potential of FLT PET as an early predictor for response to therapy and survival is currently uncertain and requires further investigation.
Amino acid transport systems also play an important role in the regulation of cell proliferation. l-type amino acid transporter 1 is widely expressed in most cancers, including lung cancer, and plays essential roles in cancer growth and survival (108). 18F-α-methyltyrosine is one of the amino acid tracers highly specific to neoplasms. Kaira et al (108) studied 18 stage IIIA–IV NSCLC patients treated with chemotherapy plus chest radiation therapy and demonstrated that the lymph node–to–primary tumor maximum SUV ratio of 1 or greater on 18F-α-methyltyrosine PET images after therapy was associated with longer survival, indicating the potential utility of 18F-α-methyltyrosine in predicting outcome in advanced NSCLC.
Radiolabeling an anticancer agent itself enables visualization and quantification of the agent in vivo. Van der Veldt et al (109) labeled docetaxel, which binds to microtubules and induces cell cycle arrest and apoptosis, with the short-lived positron emitting radionuclide carbon 11([11C] docetaxel). In their study of 34 lung cancer patients who underwent PET imaging with [11C] docetaxel, [11C] docetaxel kinetics in tumors was quantified in a reproducible manner. Relative high [11C] docetaxel uptake was related to improved response according to RECIST in patients who subsequently received docetaxel therapy (110).
Attempts have been made to visualize therapeutic targets using PET tracers, successfully labeling gefitinib and erlotinib in lung cancer in tumor models and in patients. Memon et al (111) recently developed 11C-labeled erlotinib, which accumulated in xenografts that were sensitive to erlotinib treatment in murine models of human lung cancer. When studied in 13 NSCLC patients awaiting erlotinib therapy, 11C-erlotinib accumulated in lung tumors or lymph nodes and was used to identify lesions not visible on FDG PET studies (112). Larger studies with pre- and posttherapy imaging are warranted to address the effectiveness of 11C-erlotinib PET in therapy monitoring.
With clinical application of emerging novel tracers, PET imaging has a potential to be a powerful tool to address many fundamental issues of cancer biology during treatment, including response, progression, and resistance to therapy. Novel PET imaging with mechanism-specific and pathway-specific tracers may provide an aid for personalized selection and monitoring for mechanism-based anticancer treatment.
Future Directions
While many advanced imaging techniques and parameters are under active investigation, standardization and validation of these techniques are needed before they can be incorporated into routine clinical practice and the results based on these techniques can be compared across institutions worldwide. Because of its wide applicability and practicality, RECIST will remain the primary generalized criteria for response assessment in clinical trials and practice of lung cancer. RECIST has been the major “common language” in reporting results of cancer therapy in the past decade and provided a standardized measurement of response required for cancer drug approval. Advanced and novel imaging techniques and parameters will be used as adjuncts to RECIST, to answer specific biologic questions in tumor response to specific therapy and provide insights into mechanisms of anticancer therapy. With the development of highly technical tools for advanced imaging, the radiology community needs to adapt existing and novel imaging techniques to help answer fundamental biologic questions and approach clinically challenging issues which oncologists are facing in clinical studies and day-to-day practice of lung cancer care. Such approach will help radiologists to make important contributions to genomically driven lung cancer care.
Conclusion
Recent clinical application of effective molecular targeting agents for genomically defined lung cancer patients has brought a new, exciting era of response assessment in lung cancer. Significant technical advances in the past decade allowed radiologists to provide new imaging parameters reflecting tumor volume, perfusion, and glucose metabolism, as potential biomarkers for tumor response and clinical outcome. Technical standardization and validation are the key steps that remain to be achieved for these parameters to be accepted as a part of the routine response assessment in lung cancer. Emerging novel PET tracers for functional and molecular imaging may help to further study the biologic behaviors of lung cancer during therapy.
Essentials
■ Standardization of tumor response assessment has significantly contributed to advances in cancer therapy by allowing effective comparisons between results of different cancer treatments.
■ Imaging is the major tool in response assessment of lung cancer.
■ Knowledge of the recent discoveries of genomic mechanisms of lung cancer and their clinical applications in molecular targeting therapy is essential for radiologists to interpret imaging studies and assess response in lung cancer patients receiving molecular targeting therapy.
■ Conventional tumor response criteria, such as World Health Organization criteria and Response Evaluation Criteria in Solid Tumors, are simple and practical and can serve as standardized measures for response assessment across institutions; however, they have limitations.
■ Advanced imaging techniques using multidetector CT, MR imaging, and PET are under active investigation to assess response and predict outcome and have shown potential to answer specific biologic questions in tumor response to specific therapy.
Received December 5, 2012; revision requested January 16, 2013; revision received February 1; accepted February 18; final version accepted February 28; final review November 17.
Supported by a grant from Genentech, by the Doris and William Krupp Research Fund in Thoracic Oncology, and by American Society of Clinical Oncology Translational Research Professorship.
Funding: Supported by the National Cancer Institute (grant 1K23CA157631 [M.N.]), the National Institutes of Health (grants 1RO1CA114465-01 [B.E.J.] and 5R21 CA11627-02 [H.H.], and the National Cancer Institute Specialized Program of Research Excellence in Lung Cancer (grant 2P50CA090578-06 [B.E.J.]).
Disclosures of Conflicts of Interest: M.N. No relevant conflicts of interest to disclose. H.H. Financial activities related to the present article: none to disclose. Financial activities not related to the present article: grants/grants pending to institution from Toshiba Medical, AZE, Canon. Other relationships: none to disclose. B.E.J. Financial activities related to the present article: consulting fee or honorarium from Bristol-Myers, Astrazeneca, Genentech, Millenium, Pfizer, Sanofi,Transgenomic. Financial activities not related to the present article: post-marketing royalties from DFCI for EGFR mutation testing. Other relationships: none to disclose. T.C.M. Financial activities related to the present article: none to disclose. Financial activities not related to the present article: Chair of Board of Trustees RSNA R&E Foundation, 2010-2012. Other relationships: none to disclose.
Abbreviations:
- DCE
- dynamic contrast material enhanced
- EGFR
- epidermal growth factor receptor
- EGFR-TKI
- EGFR tyrosine kinase inhibitor
- FDG
- fluorodeoxyglucose
- kep
- tracer transport rate constant
- NSCLC
- non-small cell lung cancer
- OS
- overall survival
- PFS
- progression-free survival
- RECIST
- Response Evaluation Criteria in Solid Tumors
- SUV
- standardized uptake value
- WHO
- World Health Organization
References
- 1.Siegel R, Naishadham D, Jemal A. Cancer statistics, 2012. CA Cancer J Clin 2012;62(1):10–29. [DOI] [PubMed] [Google Scholar]
- 2.American Cancer Society. Cancer facts and figures , 2012. http://www.cancer.org/Research/CancerFactsFigures/ACSPC-031941. Published 2012.
- 3.Paez JG, Jänne PA, Lee JC, et al. EGFR mutations in lung cancer: correlation with clinical response to gefitinib therapy. Science 2004;304(5676):1497–1500. [DOI] [PubMed] [Google Scholar]
- 4.Lynch TJ, Bell DW, Sordella R, et al. Activating mutations in the epidermal growth factor receptor underlying responsiveness of non-small-cell lung cancer to gefitinib. N Engl J Med 2004;350(21):2129–2139. [DOI] [PubMed] [Google Scholar]
- 5.Pao W, Miller V, Zakowski M, et al. EGF receptor gene mutations are common in lung cancers from “never smokers” and are associated with sensitivity of tumors to gefitinib and erlotinib. Proc Natl Acad Sci U S A 2004;101(36):13306–13311. [DOI] [PMC free article] [PubMed] [Google Scholar]
- 6.Gazdar AF. Personalized medicine and inhibition of EGFR signaling in lung cancer. N Engl J Med 2009;361(10):1018–1020. [DOI] [PMC free article] [PubMed] [Google Scholar]
- 7.Herbst RS, Heymach JV, Lippman SM. Lung cancer. N Engl J Med 2008;359(13):1367–1380. [DOI] [PMC free article] [PubMed] [Google Scholar]
- 8.Nishino M, Jackman DM, Hatabu H, Jänne PA, Johnson BE, Van den Abbeele AD. Imaging of lung cancer in the era of molecular medicine. Acad Radiol 2011;18(4):424–436. [DOI] [PMC free article] [PubMed] [Google Scholar]
- 9.Nishino M, Jagannathan JP, Krajewski KM, et al. Personalized tumor response assessment in the era of molecular medicine: cancer-specific and therapy-specific response criteria to complement pitfalls of RECIST. AJR Am J Roentgenol 2012;198(4):737–745. [DOI] [PMC free article] [PubMed] [Google Scholar]
- 10.Miller AB, Hoogstraten B, Staquet M, Winkler A. Reporting results of cancer treatment. Cancer 1981;47(1):207–214. [DOI] [PubMed] [Google Scholar]
- 11.Breathnach OS, Freidlin B, Conley B, et al. Twenty-two years of phase III trials for patients with advanced non-small-cell lung cancer: sobering results. J Clin Oncol 2001;19(6):1734–1742. [DOI] [PubMed] [Google Scholar]
- 12.Rosell R, Carcereny E, Gervais R, et al. Erlotinib versus standard chemotherapy as first-line treatment for European patients with advanced EGFR mutation-positive non-small-cell lung cancer (EURTAC): a multicentre, open-label, randomised phase 3 trial. Lancet Oncol 2012;13(3):239–246. [DOI] [PubMed] [Google Scholar]
- 13.van Zandwijk N, Mathy A, Boerrigter L, et al. EGFR and KRAS mutations as criteria for treatment with tyrosine kinase inhibitors: retro- and prospective observations in non-small-cell lung cancer. Ann Oncol 2007;18(1):99–103. [DOI] [PubMed] [Google Scholar]
- 14.Sequist LV, Martins RG, Spigel D, et al. First-line gefitinib in patients with advanced non-small-cell lung cancer harboring somatic EGFR mutations. J Clin Oncol 2008;26(15):2442–2449. [DOI] [PubMed] [Google Scholar]
- 15.Jackman DM, Yeap BY, Sequist LV, et al. Exon 19 deletion mutations of epidermal growth factor receptor are associated with prolonged survival in non-small cell lung cancer patients treated with gefitinib or erlotinib. Clin Cancer Res 2006;12(13):3908–3914. [DOI] [PubMed] [Google Scholar]
- 16.Mok TS, Wu YL, Thongprasert S, et al. Gefitinib or carboplatin-paclitaxel in pulmonary adenocarcinoma. N Engl J Med 2009;361(10):947–957. [DOI] [PubMed] [Google Scholar]
- 17.Maemondo M, Inoue A, Kobayashi K, et al. Gefitinib or chemotherapy for non-small-cell lung cancer with mutated EGFR. N Engl J Med 2010;362(25):2380–2388. [DOI] [PubMed] [Google Scholar]
- 18.Zhou C, Wu YL, Chen G, et al. Erlotinib versus chemotherapy as first-line treatment for patients with advanced EGFR mutation-positive non-small-cell lung cancer (OPTIMAL, CTONG-0802): a multicentre, open-label, randomised, phase 3 study. Lancet Oncol 2011;12(8):735–742. [DOI] [PubMed] [Google Scholar]
- 19.Keedy VL, Temin S, Somerfield MR, et al. American Society of Clinical Oncology provisional clinical opinion: epidermal growth factor receptor (EGFR) Mutation testing for patients with advanced non-small-cell lung cancer considering first-line EGFR tyrosine kinase inhibitor therapy. J Clin Oncol 2011;29(15):2121–2127. [DOI] [PubMed] [Google Scholar]
- 20.Soda M, Choi YL, Enomoto M, et al. Identification of the transforming EML4-ALK fusion gene in non-small-cell lung cancer. Nature 2007;448(7153):561–566. [DOI] [PubMed] [Google Scholar]
- 21.Koivunen JP, Mermel C, Zejnullahu K, et al. EML4-ALK fusion gene and efficacy of an ALK kinase inhibitor in lung cancer. Clin Cancer Res 2008;14(13):4275–4283. [DOI] [PMC free article] [PubMed] [Google Scholar]
- 22.Wong DW, Leung EL, So KK, et al. The EML4-ALK fusion gene is involved in various histologic types of lung cancers from nonsmokers with wild-type EGFR and KRAS. Cancer 2009;115(8):1723–1733. [DOI] [PubMed] [Google Scholar]
- 23.Kwak EL, Bang YJ, Camidge DR, et al. Anaplastic lymphoma kinase inhibition in non-small-cell lung cancer. N Engl J Med 2010;363(18):1693–1703. [DOI] [PMC free article] [PubMed] [Google Scholar]
- 24.Camidge DR, Bang YJ, Kwak EL, et al. Activity and safety of crizotinib in patients with ALK-positive non-small-cell lung cancer: updated results from a phase 1 study. Lancet Oncol 2012;13(10):1011–1019. [DOI] [PMC free article] [PubMed] [Google Scholar]
- 25.Jänne PA, Meyerson M. ROS1 rearrangements in lung cancer: a new genomic subset of lung adenocarcinoma. J Clin Oncol 2012;30(8):878–879. [DOI] [PubMed] [Google Scholar]
- 26.Bergethon K, Shaw AT, Ou SH, et al. ROS1 rearrangements define a unique molecular class of lung cancers. J Clin Oncol 2012;30(8):863–870. [DOI] [PMC free article] [PubMed] [Google Scholar]
- 27.Kim ES, Herbst RS, Wistuba, et al. The BATTLE trial: personalizing therapy for lung cancer. Cancer Discov 2011;1(1):44–53. [DOI] [PMC free article] [PubMed] [Google Scholar]
- 28.Ding L, Getz G, Wheeler DA, et al. Somatic mutations affect key pathways in lung adenocarcinoma. Nature 2008;455(7216):1069–1075. [DOI] [PMC free article] [PubMed] [Google Scholar]
- 29.Imielinski M, Berger AH, Hammerman PS, et al. Mapping the hallmarks of lung adenocarcinoma with massively parallel sequencing. Cell 2012;150(6):1107–1120. [DOI] [PMC free article] [PubMed] [Google Scholar]
- 30.World Health Organization . WHO handbook for reporting results of cancer treatment: offset publication no. 48. Geneva, Switzerland: World Health Organization, 1979. [Google Scholar]
- 31.Therasse P, Arbuck SG, Eisenhauer EA, et al. New guidelines to evaluate the response to treatment in solid tumors: European Organization for Research and Treatment of Cancer, National Cancer Institute of the United States, National Cancer Institute of Canada. J Natl Cancer Inst 2000;92(3):205–216. [DOI] [PubMed] [Google Scholar]
- 32.Eisenhauer EA, Therasse P, Bogaerts J, et al. New response evaluation criteria in solid tumours: revised RECIST guideline (version 1.1). Eur J Cancer 2009;45(2):228–247. [DOI] [PubMed] [Google Scholar]
- 33.Nishino M, Jagannathan JP, Ramaiya NH, Van den Abbeele AD. Revised RECIST guideline version 1.1: what oncologists want to know and what radiologists need to know. AJR Am J Roentgenol 2010;195(2):281–289. [DOI] [PubMed] [Google Scholar]
- 34.Nishino M, Jackman DM, Hatabu H, et al. New Response Evaluation Criteria in Solid Tumors (RECIST) guidelines for advanced non-small cell lung cancer: comparison with original RECIST and impact on assessment of tumor response to targeted therapy. AJR Am J Roentgenol 2010;195(3):W221–W228. [DOI] [PMC free article] [PubMed] [Google Scholar]
- 35.Gavrielides MA, Kinnard LM, Myers KJ, Petrick N. Noncalcified lung nodules: volumetric assessment with thoracic CT. Radiology 2009;251(1):26–37. [DOI] [PMC free article] [PubMed] [Google Scholar]
- 36.Erasmus JJ, Gladish GW, Broemeling L, et al. Interobserver and intraobserver variability in measurement of non-small-cell carcinoma lung lesions: implications for assessment of tumor response. J Clin Oncol 2003;21(13):2574–2582. [DOI] [PubMed] [Google Scholar]
- 37.Zhao B, James LP, Moskowitz CS, et al. Evaluating variability in tumor measurements from same-day repeat CT scans of patients with non-small cell lung cancer. Radiology 2009;252(1):263–272. [DOI] [PMC free article] [PubMed] [Google Scholar]
- 38.Nishino M, Guo M, Jackman DM, et al. CT tumor volume measurement in advanced non-small-cell lung cancer: Performance characteristics of an emerging clinical tool. Acad Radiol 2011;18(1):54–62. [DOI] [PMC free article] [PubMed] [Google Scholar]
- 39.Choi H, Charnsangavej C, de Castro Faria S, et al. CT evaluation of the response of gastrointestinal stromal tumors after imatinib mesylate treatment: a quantitative analysis correlated with FDG PET findings. AJR Am J Roentgenol 2004;183(6):1619–1628. [DOI] [PubMed] [Google Scholar]
- 40.Choi H, Charnsangavej C, Faria SC, et al. Correlation of computed tomography and positron emission tomography in patients with metastatic gastrointestinal stromal tumor treated at a single institution with imatinib mesylate: proposal of new computed tomography response criteria. J Clin Oncol 2007;25(13):1753–1759. [DOI] [PubMed] [Google Scholar]
- 41.Wolchok JD, Hoos A, O’Day S, et al. Guidelines for the evaluation of immune therapy activity in solid tumors: immune-related response criteria. Clin Cancer Res 2009;15(23):7412–7420. [DOI] [PubMed] [Google Scholar]
- 42.Lynch TJ, Bondarenko I, Luft A, et al. Ipilimumab in combination with paclitaxel and carboplatin as first-line treatment in stage IIIB/IV non-small-cell lung cancer: results from a randomized, double-blind, multicenter phase II study. J Clin Oncol 2012;30(17):2046–2054. [DOI] [PubMed] [Google Scholar]
- 43.Marom EM, Martinez CH, Truong MT, et al. Tumor cavitation during therapy with antiangiogenesis agents in patients with lung cancer. J Thorac Oncol 2008;3(4):351–357. [DOI] [PubMed] [Google Scholar]
- 44.Crabb SJ, Patsios D, Sauerbrei E, et al. Tumor cavitation: impact on objective response evaluation in trials of angiogenesis inhibitors in non-small-cell lung cancer. J Clin Oncol 2009;27(3):404–410. [DOI] [PubMed] [Google Scholar]
- 45.Nishino M, Cryer SK, Okajima Y, et al. Tumoral cavitation in patients with non-small-cell lung cancer treated with antiangiogenic therapy using bevacizumab. Cancer Imaging 2012;12:225–235. [DOI] [PMC free article] [PubMed] [Google Scholar]
- 46.Mok TS. Living with imperfection. J Clin Oncol 2010;28(2):191–192. [DOI] [PubMed] [Google Scholar]
- 47.Nishino M, Cardarella S, Dahlberg SE, et al. Radiographic assessment and therapeutic decisions at RECIST progression in EGFR-mutant NSCLC treated with EGFR tyrosine kinase inhibitors. Lung Cancer 2013;79(3):283–288. [DOI] [PMC free article] [PubMed] [Google Scholar]
- 48.Park K, Tsai CM, Ahn M, et al. ASPIRATION: phase II study of continued erlotinib beyond RECIST progression in Asian patients (pts) with epidermal growth factor receptor (EGFR) mutation-positive non-small cell lung cancer (NSCLC). J Clin Oncol 2012;30(Suppl):TPS7614. [Google Scholar]
- 49.Camidge DR, Bang Y, Kwak EL, et al. Progression-free survival (PFS) from a phase I study of crizotinib (PF-02341066) in patients with ALK-positive non-small cell lung cancer (NSCLC). J Clin Oncol 2011;29(Suppl):2501. [Google Scholar]
- 50.Zhao B, Schwartz LH, Moskowitz CS, et al. Pulmonary metastases: effect of CT section thickness on measurement—initial experience. Radiology 2005;234(3):934–939. [DOI] [PubMed] [Google Scholar]
- 51.Zhao B, Schwartz LH, Moskowitz CS, Ginsberg MS, Rizvi NA, Kris MG. Lung cancer: computerized quantification of tumor response—initial results. Radiology 2006;241(3):892–898. [DOI] [PubMed] [Google Scholar]
- 52.Mozley PD, Bendtsen C, Zhao B, et al. Measurement of tumor volumes improves RECIST-based response assessments in advanced lung cancer. Transl Oncol 2012;5(1):19–25. [DOI] [PMC free article] [PubMed] [Google Scholar]
- 53.Zhao B, Oxnard GR, Moskowitz CS, et al. A pilot study of volume measurement as a method of tumor response evaluation to aid biomarker development. Clin Cancer Res 2010;16(18):4647–4653. [DOI] [PMC free article] [PubMed] [Google Scholar]
- 54.Dehing-Oberije C, De Ruysscher D, van der Weide H, et al. Tumor volume combined with number of positive lymph node stations is a more important prognostic factor than TNM stage for survival of non-small-cell lung cancer patients treated with (chemo)radiotherapy. Int J Radiat Oncol Biol Phys 2008;70(4):1039–1044. [DOI] [PubMed] [Google Scholar]
- 55.Alexander BM, Othus M, Caglar HB, Allen AM. Tumor volume is a prognostic factor in non-small-cell lung cancer treated with chemoradiotherapy. Int J Radiat Oncol Biol Phys 2011;79(5):1381–1387. [DOI] [PubMed] [Google Scholar]
- 56.Kozak MM, Murphy JD, Schipper ML, et al. Tumor volume as a potential imaging-based risk-stratification factor in trimodality therapy for locally advanced non-small cell lung cancer. J Thorac Oncol 2011;6(5):920–926. [DOI] [PubMed] [Google Scholar]
- 57.Yi CA, Lee KS, Kim EA, et al. Solitary pulmonary nodules: dynamic enhanced multi-detector row CT study and comparison with vascular endothelial growth factor and microvessel density. Radiology 2004;233(1):191–199. [DOI] [PubMed] [Google Scholar]
- 58.Cronin P, Dwamena BA, Kelly AM, Carlos RC. Solitary pulmonary nodules: meta-analytic comparison of cross-sectional imaging modalities for diagnosis of malignancy. Radiology 2008;246(3):772–782. [DOI] [PubMed] [Google Scholar]
- 59.Ng QS, Goh V, Fichte H, et al. Lung cancer perfusion at multi-detector row CT: reproducibility of whole tumor quantitative measurements. Radiology 2006;239(2):547–553. [DOI] [PubMed] [Google Scholar]
- 60.Ng QS, Goh V, Klotz E, et al. Quantitative assessment of lung cancer perfusion using MDCT: does measurement reproducibility improve with greater tumor volume coverage? AJR Am J Roentgenol 2006;187(4):1079–1084. [DOI] [PubMed] [Google Scholar]
- 61.Goh V, Halligan S, Bartram CI. Quantitative tumor perfusion assessment with multidetector CT: are measurements from two commercial software packages interchangeable? Radiology 2007;242(3):777–782. [DOI] [PubMed] [Google Scholar]
- 62.Ng CS, Chandler AG, Wei W, et al. Reproducibility of perfusion parameters obtained from perfusion CT in lung tumors. AJR Am J Roentgenol 2011;197(1):113–121. [DOI] [PubMed] [Google Scholar]
- 63.Sauter AW, Merkle A, Schulze M, et al. Intraobserver and interobserver agreement of volume perfusion CT (VPCT) measurements in patients with lung lesions. Eur J Radiol 2012;81(10):2853–2859. [DOI] [PubMed] [Google Scholar]
- 64.Tacelli N, Remy-Jardin M, Copin MC, et al. Assessment of non-small cell lung cancer perfusion: pathologic-CT correlation in 15 patients. Radiology 2010;257(3):863–871. [DOI] [PubMed] [Google Scholar]
- 65.Wang J, Wu N, Cham MD, Song Y. Tumor response in patients with advanced non-small cell lung cancer: perfusion CT evaluation of chemotherapy and radiation therapy. AJR Am J Roentgenol 2009;193(4):1090–1096. [DOI] [PubMed] [Google Scholar]
- 66.Lind JS, Meijerink MR, Dingemans AM, et al. Dynamic contrast-enhanced CT in patients treated with sorafenib and erlotinib for non-small cell lung cancer: a new method of monitoring treatment? Eur Radiol 2010;20(12):2890–2898. [DOI] [PMC free article] [PubMed] [Google Scholar]
- 67.Fraioli F, Anzidei M, Zaccagna F, et al. Whole-tumor perfusion CT in patients with advanced lung adenocarcinoma treated with conventional and antiangiogenetic chemotherapy: initial experience. Radiology 2011;259(2):574–582. [DOI] [PubMed] [Google Scholar]
- 68.Choyke PL, Dwyer AJ, Knopp MV. Functional tumor imaging with dynamic contrast-enhanced magnetic resonance imaging. J Magn Reson Imaging 2003;17(5):509–520. [DOI] [PubMed] [Google Scholar]
- 69.Hatabu H, Gaa J, Kim D, Li W, Prasad PV, Edelman RR. Pulmonary perfusion: qualitative assessment with dynamic contrast-enhanced MRI using ultra-short TE and inversion recovery turbo FLASH. Magn Reson Med 1996;36(4):503–508. [DOI] [PubMed] [Google Scholar]
- 70.Hittmair K, Eckersberger F, Klepetko W, Helbich T, Herold CJ. Evaluation of solitary pulmonary nodules with dynamic contrast-enhanced MR imaging: a promising technique. Magn Reson Imaging 1995;13(7):923–933. [DOI] [PubMed] [Google Scholar]
- 71.Gückel C, Schnabel K, Deimling M, Steinbrich W. Solitary pulmonary nodules: MR evaluation of enhancement patterns with contrast-enhanced dynamic snapshot gradient-echo imaging. Radiology 1996;200(3):681–686. [DOI] [PubMed] [Google Scholar]
- 72.Ohno Y, Hatabu H, Takenaka D, Adachi S, Kono M, Sugimura K. Solitary pulmonary nodules: potential role of dynamic MR imaging in management initial experience. Radiology 2002;224(2):503–511. [DOI] [PubMed] [Google Scholar]
- 73.Schaefer JF, Vollmar J, Schick F, et al. Solitary pulmonary nodules: dynamic contrast-enhanced MR imaging—perfusion differences in malignant and benign lesions. Radiology 2004;232(2):544–553. [DOI] [PubMed] [Google Scholar]
- 74.Tozaki M, Ichiba N, Fukuda K. Dynamic magnetic resonance imaging of solitary pulmonary nodules: utility of kinetic patterns in differential diagnosis. J Comput Assist Tomogr 2005;29(1):13–19. [DOI] [PubMed] [Google Scholar]
- 75.Mamata H, Tokuda J, Gill RR, et al. Clinical application of pharmacokinetic analysis as a biomarker of solitary pulmonary nodules: dynamic contrast-enhanced MR imaging. Magn Reson Med 2012;68(5):1614–1622. [DOI] [PMC free article] [PubMed] [Google Scholar]
- 76.Satoh S, Kitazume Y, Ohdama S, Kimula Y, Taura S, Endo Y. Can malignant and benign pulmonary nodules be differentiated with diffusion-weighted MRI? AJR Am J Roentgenol 2008;191(2):464–470. [DOI] [PubMed] [Google Scholar]
- 77.Mori T, Nomori H, Ikeda K, et al. Diffusion-weighted magnetic resonance imaging for diagnosing malignant pulmonary nodules/masses: comparison with positron emission tomography. J Thorac Oncol 2008;3(4):358–364. [DOI] [PubMed] [Google Scholar]
- 78.Matoba M, Tonami H, Kondou T, et al. Lung carcinoma: diffusion-weighted mr imaging—preliminary evaluation with apparent diffusion coefficient. Radiology 2007;243(2):570–577. [DOI] [PubMed] [Google Scholar]
- 79.Fujimoto K, Abe T, Müller NL, et al. Small peripheral pulmonary carcinomas evaluated with dynamic MR imaging: correlation with tumor vascularity and prognosis. Radiology 2003;227(3):786–793. [DOI] [PubMed] [Google Scholar]
- 80.Kelly RJ, Rajan A, Force J, et al. Evaluation of KRAS mutations, angiogenic biomarkers, and DCE-MRI in patients with advanced non-small-cell lung cancer receiving sorafenib. Clin Cancer Res 2011;17(5):1190–1199. [DOI] [PMC free article] [PubMed] [Google Scholar]
- 81.Ohno Y, Nogami M, Higashino T, et al. Prognostic value of dynamic MR imaging for non-small-cell lung cancer patients after chemoradiotherapy. J Magn Reson Imaging 2005;21(6):775–783. [DOI] [PubMed] [Google Scholar]
- 82.Yabuuchi H, Hatakenaka M, Takayama K, et al. Non-small cell lung cancer: detection of early response to chemotherapy by using contrast-enhanced dynamic and diffusion-weighted MR imaging. Radiology 2011;261(2):598–604. [DOI] [PubMed] [Google Scholar]
- 83.Ohno Y, Koyama H, Yoshikawa T, et al. Diffusion-weighted MRI versus 18F-FDG PET/CT: performance as predictors of tumor treatment response and patient survival in patients with non-small cell lung cancer receiving chemoradiotherapy. AJR Am J Roentgenol 2012;198(1):75–82. [DOI] [PubMed] [Google Scholar]
- 84.Patz EF, Jr, Lowe VJ, Hoffman JM, et al. Focal pulmonary abnormalities: evaluation with F-18 fluorodeoxyglucose PET scanning. Radiology 1993;188(2):487–490. [DOI] [PubMed] [Google Scholar]
- 85.Fischer B, Lassen U, Mortensen J, et al. Preoperative staging of lung cancer with combined PET-CT. N Engl J Med 2009;361(1):32–39. [DOI] [PubMed] [Google Scholar]
- 86.Mak RH, Digumarthy SR, Muzikansky A, et al. Role of 18F-fluorodeoxyglucose positron emission tomography in predicting epidermal growth factor receptor mutations in non-small cell lung cancer. Oncologist 2011;16(3):319–326. [DOI] [PMC free article] [PubMed] [Google Scholar]
- 87.Park EA, Lee HJ, Kim YT, et al. EGFR gene copy number in adenocarcinoma of the lung by FISH analysis: investigation of significantly related factors on CT, FDG-PET, and histopathology. Lung Cancer 2009;64(2):179–186. [DOI] [PubMed] [Google Scholar]
- 88.Hicks RJ. Role of 18F-FDG PET in assessment of response in non-small cell lung cancer. J Nucl Med 2009;50(Suppl 1):31S–42S. [DOI] [PubMed] [Google Scholar]
- 89.Weber WA, Ziegler SI, Thödtmann R, Hanauske AR, Schwaiger M. Reproducibility of metabolic measurements in malignant tumors using FDG PET. J Nucl Med 1999;40(11):1771–1777. [PubMed] [Google Scholar]
- 90.Jacene HA, Leboulleux S, Baba S, et al. Assessment of interobserver reproducibility in quantitative 18F-FDG PET and CT measurements of tumor response to therapy. J Nucl Med 2009;50(11):1760–1769. [DOI] [PubMed] [Google Scholar]
- 91.Nahmias C, Wahl LM. Reproducibility of standardized uptake value measurements determined by 18F-FDG PET in malignant tumors. J Nucl Med 2008;49(11):1804–1808. [DOI] [PubMed] [Google Scholar]
- 92.Graham MM, Badawi RD, Wahl RL. Variations in PET/CT methodology for oncologic imaging at U.S. academic medical centers: an imaging response assessment team survey. J Nucl Med 2011;52(2):311–317. [DOI] [PMC free article] [PubMed] [Google Scholar]
- 93.Zander T, Scheffler M, Nogova L, et al. Early prediction of nonprogression in advanced non-small-cell lung cancer treated with erlotinib by using [(18)F]fluorodeoxyglucose and [(18)F]fluorothymidine positron emission tomography. J Clin Oncol 2011;29(13):1701–1708. [DOI] [PubMed] [Google Scholar]
- 94.Mileshkin L, Hicks RJ, Hughes BG, et al. Changes in 18F-fluorodeoxyglucose and 18F-fluorodeoxythymidine positron emission tomography imaging in patients with non-small cell lung cancer treated with erlotinib. Clin Cancer Res 2011;17(10):3304–3315. [DOI] [PubMed] [Google Scholar]
- 95.Takahashi R, Hirata H, Tachibana I, et al. Early [18F]fluorodeoxyglucose positron emission tomography at two days of gefitinib treatment predicts clinical outcome in patients with adenocarcinoma of the lung. Clin Cancer Res 2012;18(1):220–228. [DOI] [PubMed] [Google Scholar]
- 96.O’Brien ME, Myerson JS, Coward JI, et al. A phase II study of 18F-fluorodeoxyglucose PET-CT in non-small cell lung cancer patients receiving erlotinib (Tarceva): objective and symptomatic responses at 6 and 12 weeks. Eur J Cancer 2012;48(1):68–74. [DOI] [PubMed] [Google Scholar]
- 97.Young H, Baum R, Cremerius U, et al. Measurement of clinical and subclinical tumour response using [18F]-fluorodeoxyglucose and positron emission tomography: review and 1999 EORTC recommendations. European Organization for Research and Treatment of Cancer (EORTC) PET Study Group. Eur J Cancer 1999;35(13):1773–1782. [DOI] [PubMed] [Google Scholar]
- 98.Bengtsson T, Hicks RJ, Peterson A, Port RE. 18F-FDG PET as a surrogate biomarker in non-small cell lung cancer treated with erlotinib: newly identified lesions are more informative than standardized uptake value. J Nucl Med 2012;53(4):530–537. [DOI] [PubMed] [Google Scholar]
- 99.de Langen AJ, van den Boogaart V, Lubberink M, et al. Monitoring response to antiangiogenic therapy in non-small cell lung cancer using imaging markers derived from PET and dynamic contrast-enhanced MRI. J Nucl Med 2011;52(1):48–55. [DOI] [PubMed] [Google Scholar]
- 100.Dingemans AM, de Langen AJ, van den Boogaart V, et al. First-line erlotinib and bevacizumab in patients with locally advanced and/or metastatic non-small-cell lung cancer: a phase II study including molecular imaging. Ann Oncol 2011;22(3):559–566. [DOI] [PubMed] [Google Scholar]
- 101.Lee P, Weerasuriya DK, Lavori PW, et al. Metabolic tumor burden predicts for disease progression and death in lung cancer. Int J Radiat Oncol Biol Phys 2007;69(2):328–333. [DOI] [PubMed] [Google Scholar]
- 102.Liao S, Penney BC, Wroblewski K, et al. Prognostic value of metabolic tumor burden on 18F-FDG PET in nonsurgical patients with non-small cell lung cancer. Eur J Nucl Med Mol Imaging 2012;39(1):27–38. [DOI] [PubMed] [Google Scholar]
- 103.Liao S, Penney BC, Zhang H, Suzuki K, Pu Y. Prognostic value of the quantitative metabolic volumetric measurement on 18F-FDG PET/CT in Stage IV nonsurgical small-cell lung cancer. Acad Radiol 2012;19(1):69–77. [DOI] [PubMed] [Google Scholar]
- 104.Huang W, Zhou T, Ma L, et al. Standard uptake value and metabolic tumor volume of 18F-FDG PET/CT predict short-term outcome early in the course of chemoradiotherapy in advanced non-small cell lung cancer. Eur J Nucl Med Mol Imaging 2011;38(9):1628–1635. [DOI] [PubMed] [Google Scholar]
- 105.Longo DL. Tumor heterogeneity and personalized medicine. N Engl J Med 2012;366(10):956–957. [DOI] [PubMed] [Google Scholar]
- 106.Mankoff DA, Eary JF, Link JM, et al. Tumor-specific positron emission tomography imaging in patients: [18F] fluorodeoxyglucose and beyond. Clin Cancer Res 2007;13(12):3460–3469. [DOI] [PubMed] [Google Scholar]
- 107.Sohn HJ, Yang YJ, Ryu JS, et al. [18F]-Fluorothymidine positron emission tomography before and 7 days after gefitinib treatment predicts response in patients with advanced adenocarcinoma of the lung. Clin Cancer Res 2008;14(22):7423–7429. [DOI] [PubMed] [Google Scholar]
- 108.Kaira K, Oriuchi N, Yanagitani N, et al. Assessment of therapy response in lung cancer with 18F-α-methyl tyrosine PET. AJR Am J Roentgenol 2010;195(5):1204–1211. [DOI] [PubMed] [Google Scholar]
- 109.van der Veldt AA, Hendrikse NH, Smit EF, et al. Biodistribution and radiation dosimetry of 11C-labelled docetaxel in cancer patients. Eur J Nucl Med Mol Imaging 2010;37(10):1950–1958. [DOI] [PMC free article] [PubMed] [Google Scholar]
- 110.van der Veldt AA, Lubberink M, Greuter HN, et al. Absolute quantification of [(11)C]docetaxel kinetics in lung cancer patients using positron emission tomography. Clin Cancer Res 2011;17(14):4814–4824. [DOI] [PubMed] [Google Scholar]
- 111.Memon AA, Jakobsen S, Dagnaes-Hansen F, Sorensen BS, Keiding S, Nexo E. Positron emission tomography (PET) imaging with [11C]-labeled erlotinib: a micro-PET study on mice with lung tumor xenografts. Cancer Res 2009;69(3):873–878. [DOI] [PubMed] [Google Scholar]
- 112.Memon AA, Weber B, Winterdahl M, et al. PET imaging of patients with non-small cell lung cancer employing an EGF receptor targeting drug as tracer. Br J Cancer 2011;105(12):1850–1855 . [DOI] [PMC free article] [PubMed] [Google Scholar]
- 113.National Comprehensive Cancer Network (NCCN) Clinical Practice Guidelines in Oncology . (NCCN guidelines) Non-small cell lung cancer, version 3.2012. http://www.nccn.com/. Published April 11, 2012. Accessed November 17, 2013.
- 114.Johnson BE, Kris MG, Kwiatkowski DJ, et al. Clinical characteristics of planned 1000 patients with adenocarcinoma of lung (ACL) undergoing genomic characterization in the US Lung Cancer Mutation Consortium (LCMC). J Thorac Oncol 2011;6:S344–S345. [Google Scholar]
- 115.Kris MG, Johnson BE, Kwiatkowski DJ, et al. Identification of driver mutations in tumor specimens from 1,000 patients with lung adenocarcinoma: The NCI’s Lung Cancer Mutation Consortium (LCMC). J Clin Oncol 2011;29(Suppl):CRA7506. [Google Scholar]