Improvements in recall rate and positive predictive value for full-field digital mammography (FFDM) were noted after the initial transitional phase from screen-film to FFDM; screening with FFDM was associated with lower recall and biopsy rates, which are known limitations associated with screening for breast cancer.
Abstract
Purpose
To compare performance measures before, during, and after the transition from screen-film mammography (SFM) to full-field digital mammography (FFDM) in a population-based screening program.
Materials and Methods
No institutional review board approval was required for this analysis involving anonymized data for women aged 50–69 years enrolled in the Norwegian Breast Cancer Screening Program during 1996–2010. The χ2 test was used to examine the equality of proportions of recall rates, positive predictive value of recall examinations and of invasive procedures, in addition to rates of screening-detected and interval cancers in women initially screened with SFM and FFDM and for women subsequently screened with SFM after SFM, FFDM after SFM, and FFDM after FFDM.
Results
The recall rate was 3.4% (47 091 of 1 391 188) for SFM and 2.9% (13 130 of 446 172) for FFDM (P < .001). The biopsy rate was 1.4% (19 776 of 1 391 188) for SFM and 1.1% (5108 of 446 172) for FFDM (P < .001). The rate of screening-detected ductal carcinoma in situ was higher (P = .019) while the rate of invasive breast cancer was lower (P < .001) for FFDM compared with those for SFM. The rate of both invasive screening-detected and interval breast cancer remained stable during the transition from SFM to FFDM (when the previous examination was SFM) and after FFDM was firmly established (when the previous examination was FFDM, >25 months after FFDM adoption) (P < .05). The positive predictive value of recall examinations and of invasive procedures increased from 19.3% (4559 of 23 598) and 48.3% (4651 of 9623) to 22.7% (681 of 2995) and 57.5% (689 of 1198), respectively, after adoption of FFDM (P < .001).
Conclusion
After the initial transitional phase from SFM to FFDM, population-based screening with FFDM is associated with less harm because of lower recall and biopsy rates and higher positive predictive values after biopsy than screening with SFM.
© RSNA, 2014
Introduction
Full-field digital mammography (FFDM) is claimed to have several benefits over screen-film mammography (SFM). For patients, FFDM offers decreased radiation to the breasts and reduces repeat examinations due to technical failure (1,2). For radiologists and health care systems, FFDM offers a simplified method of archiving and transmitting images, improved patient workflow, and the ability to implement adjunct technologies (eg, computer-aided detection and tomosynthesis) (3,4). Given these perceived advantages, FFDM has been adopted rapidly in clinical settings and continues to replace SFM for screening purposes.
Authors of previous population-based studies comparing the accuracy of SFM and FFDM have shown conflicting results, particularly with respect to age-specific performance (4–7). The reported recall rates for FFDM compared with those for SFM have varied widely (3,5). Although authors of some studies report a higher rate of screening-detected invasive breast cancer for FFDM (2,8–10), other study authors report lower (11) or similar rates for FFDM compared with SFM (12,13). Similarly, conflicting results have been published for the rate of screening-detected ductal carcinoma in situ (DCIS) and the positive predictive value (PPV) of FFDM versus SFM (2,8–12).
Only a few studies have included interval-detected (nonscreening) breast cancer rates, because of the relatively small numbers of cases (9,14). Thus, no conclusions have been drawn regarding the potential benefit of FFDM versus SFM for decreasing the incidence of interval breast cancers. Larger population-based studies with sufficient follow-up time to include interval cancer would help in determining whether FFDM has advantages over SFM for decreasing interval cancer rates. Authors of previous studies comparing FFDM and SFM also have not addressed the transitional phase from SFM to FFDM. During the transitional phase, the evaluation of FFDM performance might be affected by a learning curve for radiologists (15,16). In addition, although some FFDM screening examinations can be compared directly with prior FFDM examinations, for other women in the screening program, only prior SFM examinations were available for comparison or as the first baseline examination.
To determine the effect of the transition from SFM to FFDM on screening performance, we analyzed data collected as part of the Norwegian Breast Cancer Screening Program (NBCSP). We compared performance measures and histopathologic outcomes according to screening modality and the modality of previous comparison examinations. To examine the effect of the transition from SFM to FFDM, we analyzed the rate of cases discussed by means of arbitration or in consensus, the recall rate, the rate of screening-detected cancer (DCIS and invasive breast cancer), and the rate of interval cancer according to the type of previous examination and the amount of time after the implementation of FFDM. We hypothesized that FFDM would be associated with a lower recall rate, a higher rate of screening-detected cancer, and a lower interval cancer rate. Overall, our study provided a comparison of performance measures before, during, and after the transition from SFM to FFDM in a population-based screening program.
Materials and Methods
Data Source
No institutional review board approval was required for this analysis of anonymized data, which included patient-level data on screening examinations and outcomes. Reporting cancer diagnoses to the Cancer Registry is mandatory by law in Norway (17), and this database has been used as a register of invasive cancers since 1953 and of DCIS since 1993 (18). The cancer registry database is 99% complete for reports of solid tumors, including breast cancer (19). The database for breast cancer screening was last updated in 2011. All activities related to the NBCSP are reported to the Cancer Registry, which is responsible for administration, quality assurance, and evaluation of the program (20).
NBCSP Overview
The program started in four of the 19 Norwegian counties in 1996 and expanded nationwide in 2005 (20). The program targets women 50—69 years old and is run according to European screening guidelines (21). Each woman in the target group receives a personal letter from NBCSP inviting her to receive a two-view screening mammography examination every 2 years, regardless of her cancer history. The screening examinations take place at four mobile and 27 stationary clinics, and radiologists interpret the mammograms and complete any diagnostic work in one of 16 breast imaging facilities in Norway. The screening mammograms are independently read by two radiologists and given a score on a scale of 1–5, with a score of 1 indicating screening examination results that are negative for abnormality; 2, probably benign; 3, intermediate; 4, probably malignant; and 5, a high suspicion of malignancy. If one or both radiologists have given a score of 2 or higher, a consensus or arbitration meeting (hereafter called a consensus), is used to determine whether to call the woman back for further assessment (recall) or not.
Starting in 2000, FFDM was gradually implemented throughout the program. During the transition from SFM to FFDM, prior SFM examinations usually were digitized for comparison at the time of initial interpretation. However, in two breast facilities (Telemark and Trøndelag) representing 12% of the FFDM studies obtained after SFM, prior SFM studies were not digitized, but the SFM studies were evaluated in consensus. All radiologists working in the NBCSP are experienced in diagnostic mammography, but no systematic training or education was required before they started to read FFDM. During 1996–2005, the radiologists each read an average of 3600 (median, 2995; range, 275–13 395) screening mammography examinations per year, in addition to an unknown number of diagnostic examinations (22).
Study Population
The study included women aged 50–69 years at the time of screening who had not received a diagnosis of DCIS or invasive breast cancer before they were invited to participate in the study. We excluded all women who participated in the Oslo I or Oslo II program because they were examined with both SFM and FFDM at the same screening examination, and the mammograms were independently read by two sets of radiologists (Oslo I), or they participated in a study in which they were randomized to either SFM or FFDM (Oslo II) (9,12).
Baseline and Subsequent Examinations
A woman’s baseline examination was defined as the first screening examination performed in the NBCSP, and a subsequent examination was defined as the second or later screening examination. Examinations were classified as subsequent screening examinations independent of whether an individual woman’s participation in the program was regular.
Previous Examination Types
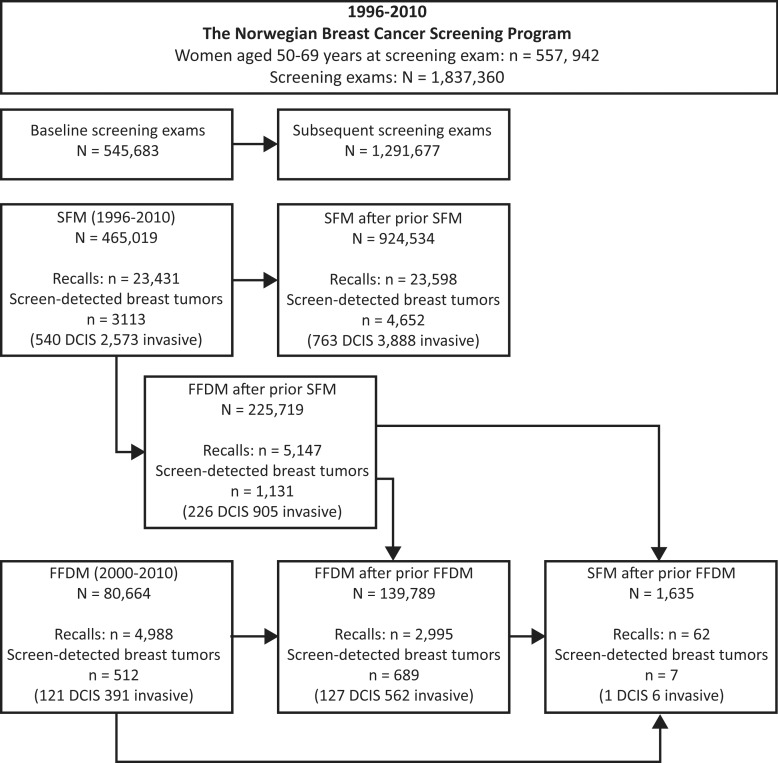
Screening mammograms were divided into six groups depending on the modality (SFM or FFDM), baseline or subsequent examination, and, if a subsequent examination, the type of previous screening modality: baseline SFM, baseline FFDM, SFM after SFM, FFDM after SFM, FFDM after FFDM, and SFM after FFDM (Fig 1). FFDM after previous SFM was possible only for the initial screening round after FFDM adoption, which is referred to as the transitional phase. Most women underwent multiple screening examinations during the study period, and thus, had examinations categorized to different groups (ie, baseline SFM, subsequent SFM after SFM, and then subsequent FFDM after SFM). A limited number of women underwent SFM after FFDM (1635 screening examinations and seven women with breast cancer), mainly because they moved from one county to another during the study period.
Figure 1:
Flow chart shows number of women and screening examinations in study period (1996–2010), including recalls and subjects diagnosed as having screening-detected breast cancer.
Performance Measures and Outcomes
We report the recall rate as the percentage of women recalled for further examination because of positive screening findings on the basis of discussion in consensus. The PPV after recall examinations for positive screening findings in the 3 months after the screening examination and the PPV after biopsy after diagnostic assessment (ie, core needle biopsy, fine needle aspiration, and surgical biopsy) in the 3 months after screening examination were determined.
We included all incidences of breast cancers diagnosed in women who participated in the NBCSP in our analysis (1 837 360 screening examinations). A screening-detected malignancy was defined as DCIS or invasive breast cancer identified after further assessment of a screening-detected abnormality. Interval cancer was defined as a DCIS or an invasive breast cancer identified during the period between negative screening examination findings and the next scheduled screening examination. More specifically, interval breast cancer is defined according to the European guidelines (22) as “a primary breast cancer which is diagnosed in a woman who had a screening test, with or without further assessment, either before the next invitation to screening, or within a time period equal to a screening interval in case the woman has reached the upper age limit for screening.” The NBCSP does not recommend short-interval follow-up examinations after abnormal screening mammograms. Thus, all women ultimately diagnosed with breast cancer after negative diagnostic assessment were defined as having an interval cancer. We limited our analysis of interval cancer to screening examinations performed during 1996–2008 (1 478 730 screening examinations) to allow for at least 2 years of follow-up data after screening. Finally, we compared performance measures for different study groups according to histopathologic tumor characteristics including tumor size, grade, lymph node metastases, and hormonal receptor status.
Statistics
We performed all analyses by using software (STATA, version 12.1; StataCorp, College Station, Texas). We stratified results by age of the women at the time of screening (5- or 10-year age groups) and the modality of examination and previous screening examination. We used the χ2 test to determine the statistical significance of differences between groups. A P value less than or equal to .05 was considered to indicate a significant difference. The P value was based on a comparison between SFM and FFDM at baseline screening and between the different screening groups according to subsequent and previous examination type, with SFM after SFM as the reference group. We used Poisson regression to estimate incidence rate ratio (IRR) of DCIS or breast cancer according to screening technique. IRR was estimated as the risk of having DCIS, invasive breast cancer, or breast cancer at mammographic screening with FFDM after a prior SFM examination versus SFM after a prior SFM examination, and the risk at screening with FFDM after a prior FFDM examination versus SFM after a prior SFM examination. The 95% confidence interval (CI) for the IRR was estimated by using the standard error of the log rate ratios. The estimates were adjusted for calendar period (continuous variable) and age (categorical variable, 5-year age groups). To investigate the learning curve for radiologists according to time (23,24), we analyzed the rate of cases discussed in consensus, subsequent recall rate, screening-detected cancer rate, and interval cancer rate 12 months after implementation of FFDM at the different breast imaging facilities. After the day of implementation of FFDM, all women attending the actual facility were offered FFDM. The results are given as an average for the program, and the range represents results for the counties (breast imaging facilities). We stratified by facility and analyzed the change in the estimates (percentage points) from SFM after SFM to FFDM after FFDM (> 24 months after implementation of FFDM). Facilities with fewer than 30 screening examinations in any of the groups were excluded from the comparisons.
Results
A total of 1 837 360 (78%) screening examinations were performed as a result of the 2 347 055 invitations sent to 661 812 women in 1996–2010 (Fig 1). The average age at the time of screening was 58.8 years (median age, 58; range, 50–69 years).
SFM was used during the entire study period (1996–2010) and accounted for 76% (1 381 118 of 1 837 360) of the examinations, 23% (465 019 of 1 391 188) of which were baseline examinations (Fig 1, Table 1). The number of screening examinations performed with SFM and FFDM and the combinations of these two modalities are shown in Figure 1 and Tables 2 and 3.
Table 1.
Examinations with SFM and FFDM and Outcome Data
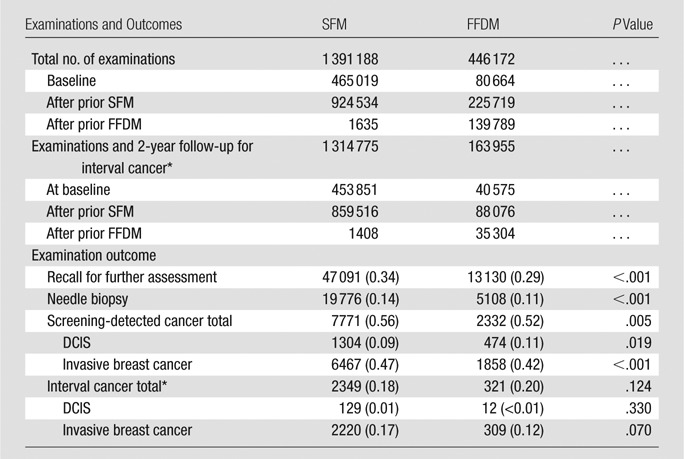
Note.—Data are number of events, with number per 1000 examinations in parentheses.
Women were screened during 1996–2008 and followed up for interval cancer 2 years after screening examination (1998–2010).
Table 2.
Baseline Screening Recalls, Screening-detected, and Interval Breast Cancer by Age
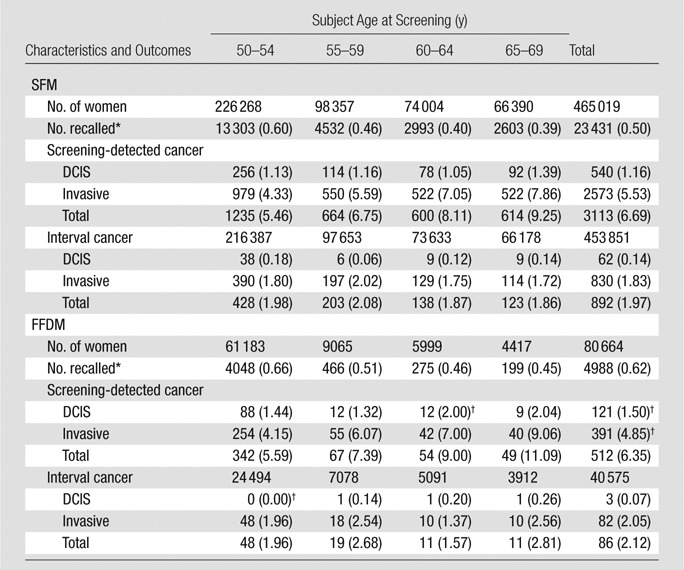
Note.—Data are number of events, with number per 1000 examinations in parentheses.
Recalled because of positive mammographic findings.
P value < .05 for comparison between SFM and FFDM for baseline examinations.
Screened 1996–2008, followed up for interval cancer 1996–2010.
Table 3.
Subsequent Examinations with SFM and FFDM
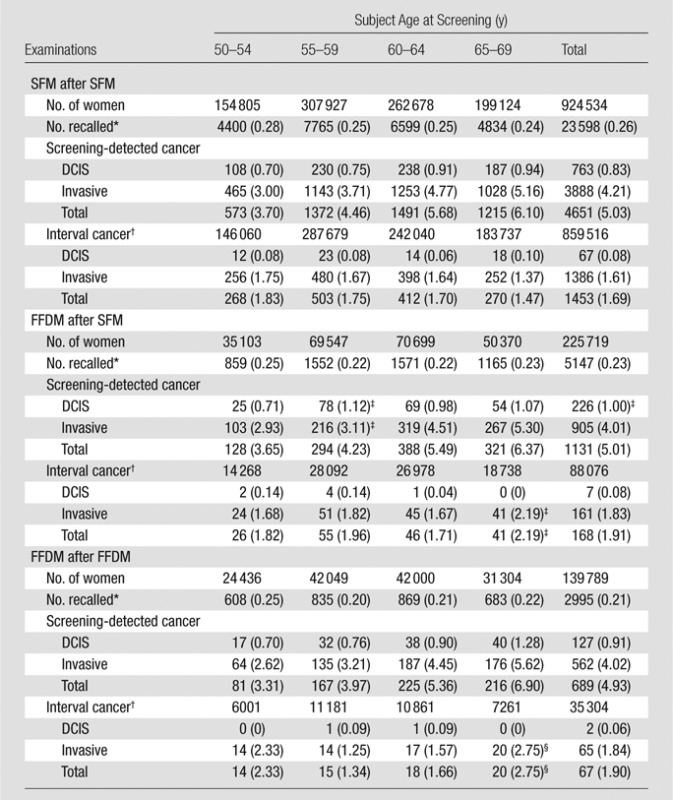
Note.—Data are number of events, with number per 1000 examinations in parentheses.
Recall due to positive mammographic findings.
Screened 1996–2008, followed for interval cancer 1996–2010.
P value < .05 for comparison between SFM after SFM and FFDM after SFM
P value < .05 for comparison between SFM after SFM and FFDM after FFDM.
Recall Rate
The overall recall rate was 3.4% (47 091 of 1 391 188) for SFM and 2.9% (13 130 of 446 172) for FFDM (P < .001) (Table 1). For subsequent examinations, the recall rate was 2.6% (23 598 of 924 534) for SFM after prior SFM; 2.3% (5147 of 225 719) for FFDM after prior SFM (P < .001); and 2.1% (2995 of 139 789) for FFDM after FFDM (P < .001) (Table 3). There was a significant decrease in recall rate with increasing age for all groups of subsequent examinations.
Screening-detected Cancer
A total of 10 103 screening-detected cancers (1778 DCIS and 8325 invasive breast cancers) were diagnosed (Fig 1). The detection rate of DCIS was significantly higher with FFDM than with SFM (P = .019), and the detection rate of invasive breast cancer was significantly lower with FFDM than with SFM (P < .001) (Table 1). The rate of screening-detected invasive cancer and the rate of DCIS and invasive cancer did not differ significantly for any combination of screening and comparison modalities (Tables 2, 3). The IRR for a screening-detected DCIS adjusted for screening modality, period, and age was 1.43 (95% confidence interval [CI]: 1.20, 1.71) for FFDM after SFM and 1.32 (95% CI: 1.07, 1.64) for FFDM after FFDM, compared with a reference standard of SFM after SFM (Table 4). The adjusted IRR for screening-detected invasive cancer did not differ significantly among the different screening groups.
Table 4.
DCIS and Breast Cancer Cases, and Screening Examinations, and Crude and Adjusted IRR of Screening-detected and Interval Breast Cancer
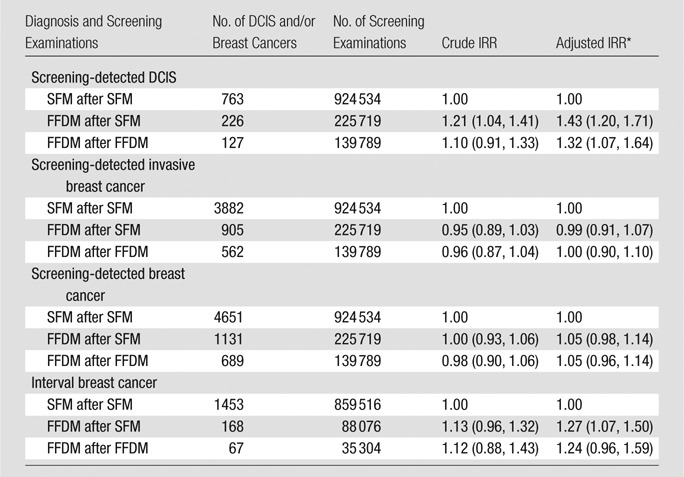
Note.—Data in parentheses are 95% CIs.
Adjusted for screening modality, period and age.
Interval Cancer
The unadjusted rate of interval DCIS did not differ significantly between SFM and FFDM (P = .33) (Table 1). Although the rate of interval invasive cancers tended to be higher with FFDM than with SFM (1.88 of 1000 examinations vs 1.69 of 1000 examinations), this difference was not statistically significant (P = .070) (Table 1). Neither the rate of interval DCIS nor the rate of interval invasive cancer differed between SFM after SFM and FFDM after FFDM (Table 3). The adjusted IRR was 1.27 (95% CI: 1.07, 1.50) for interval cancer with FFDM after SFM and 1.24 (95% CI: 0.96, 1.59) with FFDM after FFDM, compared with a reference of SFM after SFM (Table 4).
Learning Curve Effect
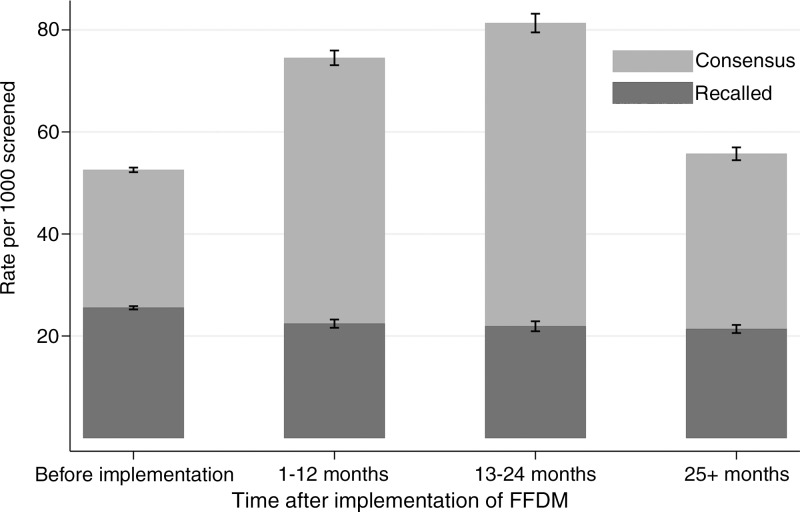
For SFM performed after SFM, the rate of screening examinations discussed in consensus was 5.3% (48 573/924 534; range, 2.1%–9.7% for individual breast imaging facilities). For FFDM performed after SFM within 12 months after FFDM implementation, the rate of consensus was 7.4% (9481/128 007; range, 3.3%–18.7%). For FFDM performed after SFM 13–24 months after FFDM implementation, the rate of consensus was 8.1% (6990/86 001; range, 3.8%–19.5%). The rate of consensus when FFDM was performed after FFDM (> 24 months after implementation of FFDM) was 5.6% (7240/128 841; range, 3.4%–14.0%) (Fig 2).
Figure 2:
Bar graph shows rates of screening examinations discussed in consensus (whole bars) and recall rates (darker part of bars) by screening technique and time after implementation of FFDM in subsequent examinations. Before implementation is SFM after SFM, 1–12 and 13–24 months is FFDM after SFM, and 25+ months is FFDM after FFDM.
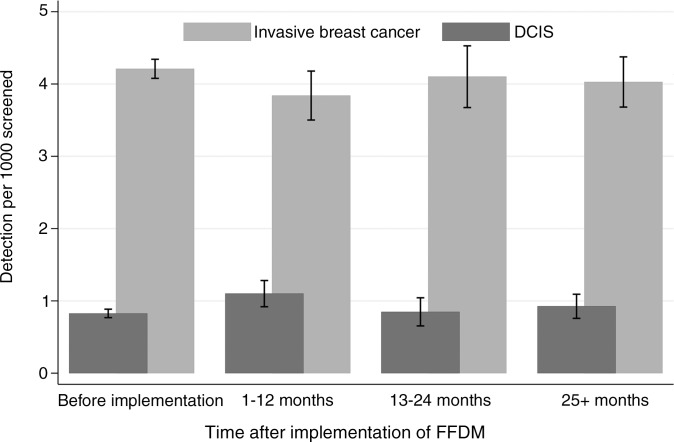
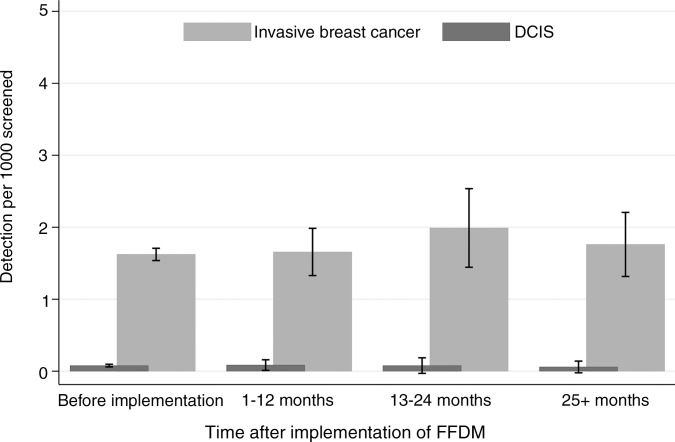
The recall rates did not differ by time after FFDM implementation (Fig 2). The ranges in recall rates for the different breast imaging facilities were 1.6%–4.0% for SFM after SFM, 1.5%–4.4% for 1–12 months after FFDM implementation, 1.6%–6.2% for 13–24 months after FFDM implementation, and 1.3%–3.7% for more than 24 months after FFDM implementation. The rate of both screening-detected and interval tumors remained stable during the transitional phase from SFM to FFDM and into the digital phase, FFDM after FFDM (P > .05 for all combinations in comparison group) (Fig 3).
Figure 3a:
Graphs show (a) rates of screening-detected breast cancer by screening technique and time after implementation of FFDM in subsequent examinations and (b) rates of interval breast cancer by screening technique and time after implementation of FFDM in subsequent examinations. Before implementation is SFM after SFM, 1–12 and 13–24 months is FFDM after SFM, and 25+ months is FFDM after FFDM.
Figure 3b:
Graphs show (a) rates of screening-detected breast cancer by screening technique and time after implementation of FFDM in subsequent examinations and (b) rates of interval breast cancer by screening technique and time after implementation of FFDM in subsequent examinations. Before implementation is SFM after SFM, 1–12 and 13–24 months is FFDM after SFM, and 25+ months is FFDM after FFDM.
PPV Analysis
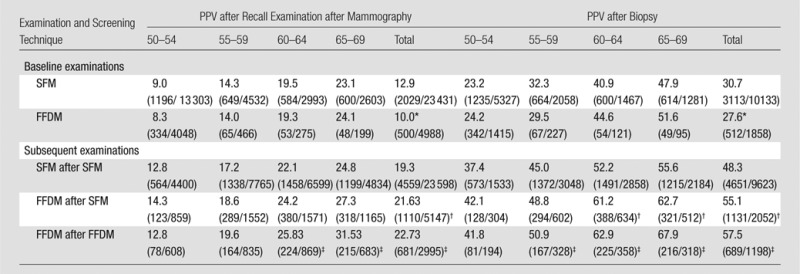
The overall biopsy rate was 1.4% (19 776 of 1 391 188) for SFM and 1.1% (5108 of 446 172) for FFDM (P < .001) (Table 1). PPV after recall examinations was 19.3% (4559 of 23 598) for SFM after SFM and 22.7% (681 of 2995) for FFDM after FFDM (P < .001) (Table 5). PPV after biopsy was 48.3% (4651 of 9623) for SFM after SFM and 57.5% (689 of 1198) for FFDM after FFDM (P < .001). The values increased with patient age, both for baseline and subsequent examinations. PPV after recall examinations was significantly higher with FFDM after SFM and with FFDM after FFDM for all age groups and for the age groups 60–64 years and 65–69 years for FFDM after FFDM. PPV after biopsy was statistically significant for FFDM after FFDM compared with SFM after SFM for all age groups, except for the age group 50–54 years (Table 5).
Table 5.
PPV of Recall Examination and Biopsy by Screening History and Technique
Note.—Data are percentages, with numerators and denominators in parentheses.
P value < .05 for comparison between SFM and FFDM.
P value < .05 for comparison between SFM after SFM and FFDM after SFM.
P value < .05 for comparison between SFM after SFM versus FFDM after FFDM.
Outcomes
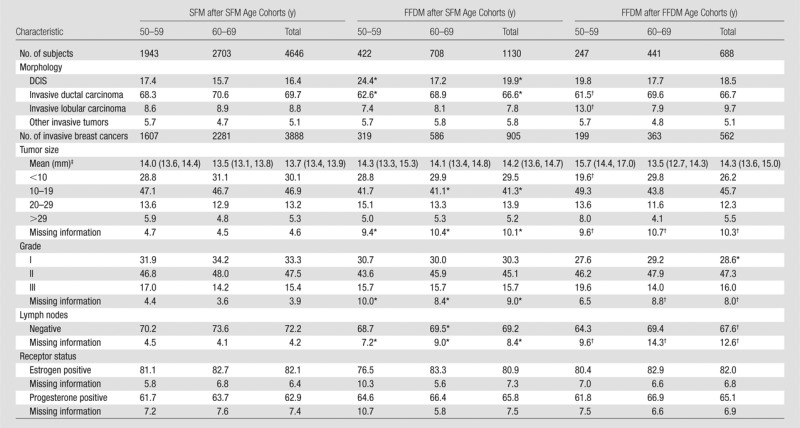
No statistically significant differences were found in tumor characteristics (tumor size, grade, lymph node status, and hormonal receptor status) for invasive cancer detected at screening with SFM after SFM, FFDM after SFM, or FFDM after FFDM (Table 5). Moreover, there were no statistically significant differences in tumor characteristics for interval breast cancers according to screening technique or sequence of screening techniques.
Discussion
After the transition from SFM to FFDM in a population-based screening program, the recall rate decreased and PPVs after recall and after biopsy progressively increased. The rate of screening-detected DCIS was higher with FFDM than with SFM, but the rate of screening-detected and interval breast cancer remained stable.
Unlike authors of previous studies comparing the performance of SFM and FFDM in a population-based screening program (2,9,12), we focused particular attention on the transitional phase from SFM to FFDM in addition to the periods before and after FFDM implementation, and we included results for interval cancers. As a new technology enters into clinical practice, there is a learning curve among physicians as they become accustomed to its use (23,24). Therefore, we analyzed early performance measures in 12-month intervals for the first 2 years after implementation of FFDM. We allowed for at least one subsequent FFDM screening follow-up after initial FFDM screening to determine the learning curve effect among interpreting radiologists switching from SFM to FFDM. Furthermore, we examined performance on the basis of not only the modality of screening, but also the modality of the most recently available comparison examinations. Our data set was robust, with nearly 2 million examinations spanning 14 years, with more than 10 000 screening-detected cancers and 2500 interval cancers. Thus, we can draw several important conclusions on the performance of SFM versus that of FFDM in a population-based screening program.
First, by demonstrating a progressive decrease in the overall recall rate from 2.6% to 2.1% during the course of FFDM implementation while the detection rate remained stable, our analysis showed that full FFDM implementation has significantly decreased the rate of false-positive screening examinations, a known limitation associated with population-based breast cancer screening (25,26). Although the rate of examinations discussed in consensus increased during the 24-month period after implementation of FFDM, the consensus rate returned to pre-FFDM implementation rates after the initial 24-month period. The stabilization of the consensus rate after the initial 24 months of FFDM implementation suggests that there is only a transient learning-curve effect for interpreting radiologists.
Second, the PPV after recall examination after an abnormal screening examination significantly increased during the course of FFDM implementation and persisted after full FFDM implementation in women 60–69 years old. Moreover, the PPV after biopsy significantly increased for both baseline and subsequent FFDM in women 55–69 years old. These improvements in PPV suggest that the implementation and continued use of FFDM has resulted in a decrease in breast biopsies with benign outcomes, which are another known disadvantage of mammographic screening (27,28). The benefits of decreasing the number of normal and benign biopsies appear to be most apparent among women aged 60 and older.
There were several limitations to our study. Because the baseline characteristics of Norwegian women may be more homogeneous than those observed in other countries, our findings may not be generalizable to screening populations outside of Norway. The NBCSP offers mammographic screening biennially, which differs from annual screening practices in some countries such as the United States. Moreover, the use of consensus in double-reading practices in Norway is not standard in other population-based screening programs, including those in U.S. practice. We were not able to account for the effects of hormone replacement therapy in our screening population. Prior studies suggest that hormone therapy in postmenopausal women increases the risk of mammograms with false-positive results (29,30). The declining use of hormone replacement therapy during the past decade could be a confounding variable in our observed decreased recall rates during the transition from SFM to FFDM. However, postmenopausal hormone therapy also is associated with increased risk of developing breast cancer diagnosed at an advanced stage (30–32). Given that there were no statistically significant differences in screening-detected invasive cancer rates, interval cancer rates (Table 3), or histopathologic tumor characteristics (Table 6) as FFDM replaced SFM, it is unlikely that this characteristic was a major driver of the observed improvements in mammographic performance.
Table 6.
Histopathologic Tumor Characteristics of Breast Tumors Detected at Subsequent Screening Examinations
Note.—Unless otherwise indicated, data are percentages.
P value < .05 for comparison between SFM after SFM versus FFDM after SFM.
P value < .05 for comparison between and SFM after SFM versus FFDM after FFDM.
Data are means, with 95% CIs in parentheses.
In conclusion, our analysis highlights the importance of studying the transitional phase of the adoption of new breast screening technology and shows that the modality of prior comparison examinations should be considered in the interpretation of performance measures for FFDM. We demonstrated that improvements in recall rates and PPVs for FFDM are noted beyond the initial transitional phase from SFM to FFDM, and that screening with FFDM is associated with lowering recall and biopsy rates, which are known limitations associated with breast cancer screening.
Advances in Knowledge
■ The recall rate was 3.4% for screen-film mammography (SFM) compared with 2.9% for full-field digital mammography (FFDM) (P < .001) in a national population-based screening program, and the biopsy rate was 1.4% and 1.1% for SFM and FFDM, respectively (P < .001).
■ Screening-detected and interval cancer rates both remained stable during the transitional phase from SFM to FFDM when the previous examination was SFM and after FFDM was firmly established when the previous examination was FFDM more than 25 months after adoption of FFDM (P < .05).
■ Positive predictive value of both recalls and of invasive procedures for biopsy after screening mammography increased after the transition from SFM to FFDM from 19.3% and 48.3%, respectively (P < .001), to 22.7% and 57.5%, respectively (P < .001).
■ The learning curve effect for radiologists during the transition from SFM to FFDM was transient, and the rate of screening examinations with indeterminate results that were discussed and evaluated in consensus returned to levels seen before the adoption of FFDM 25 months after adoption.
Implications for Patient Care
■ FFDM is associated with decreased recall and biopsy rates after screening compared with SFM, suggesting that the newer technology may prevent diagnostic workups and biopsies that do not lead to diagnosis of breast cancer.
■ Performance evaluation of new breast imaging screening technologies should account for the transitional phase of adoption and the modality of prior comparison examinations.
Received August 6, 2013; revision requested October 1; revision received December 13; accepted December 20; final version accepted January 6, 2014.
Funding: This research was supported by the National Institutes of Health (grant K05 CA 104699).
Disclosures of Conflicts of Interest: S.H. No relevant conflicts of interest to disclose. P.S. No relevant conflicts of interest to disclose. J.G.E. No relevant conflicts of interest to disclose. S.S. No relevant conflicts of interest to disclose. S.R.H. No relevant conflicts of interest to disclose. C.I.L. Financial activities related to the present article: none to disclose. Financial activities not related to the present article: payment for consultancy and grants/grants pending from GE Healthcare, author royalties from McGraw Hill and UpToDate. Other relationships: none to disclose.
Abbreviations:
- CI
- confidence interval
- DCIS
- ductal carcinoma in situ
- FFDM
- full-field digital mammography
- IRR
- incidence rate ratio
- NBCSP
- Norwegian Breast Cancer Screening Program
- PPV
- positive predictive value
- SFM
- screen-film mammography
References
- 1.Hauge IH, Pedersen K, Sanderud A, Hofvind S, Olerud HM. Patient doses from screen-film and full-field digital mammography in a population-based screening programme. Radiat Prot Dosimetry 2012;148(1):65–73. [DOI] [PubMed] [Google Scholar]
- 2.Vigeland E, Klaasen H, Klingen TA, Hofvind S, Skaane P. Full-field digital mammography compared to screen film mammography in the prevalent round of a population-based screening programme: the Vestfold County Study. Eur Radiol 2008;18(1):183–191. [DOI] [PubMed] [Google Scholar]
- 3.Skaane P. Studies comparing screen-film mammography and full-field digital mammography in breast cancer screening: updated review. Acta Radiol 2009;50(1):3–14. [DOI] [PubMed] [Google Scholar]
- 4.Houssami N, Skaane P. Overview of the evidence on digital breast tomosynthesis in breast cancer detection. Breast 2013;22(2):101–108. [DOI] [PubMed] [Google Scholar]
- 5.Vinnicombe S, Pinto Pereira SM, McCormack VA, Shiel S, Perry N, Dos Santos Silva IM. Full-field digital versus screen-film mammography: comparison within the UK breast screening program and systematic review of published data. Radiology 2009;251(2):347–358. [DOI] [PubMed] [Google Scholar]
- 6.Sala M, Comas M, Macià F, Martinez J, Casamitjana M, Castells X. Implementation of digital mammography in a population-based breast cancer screening program: effect of screening round on recall rate and cancer detection. Radiology 2009;252(1):31–39. [DOI] [PubMed] [Google Scholar]
- 7.Karssemeijer N, Bluekens AM, Beijerinck D, et al. Breast cancer screening results 5 years after introduction of digital mammography in a population-based screening program. Radiology 2009;253(2):353–358. [DOI] [PubMed] [Google Scholar]
- 8.Del Turco MR, Mantellini P, Ciatto S, et al. Full-field digital versus screen-film mammography: comparative accuracy in concurrent screening cohorts. AJR Am J Roentgenol 2007;189(4):860–866. [DOI] [PubMed] [Google Scholar]
- 9.Skaane P, Hofvind S, Skjennald A. Randomized trial of screen-film versus full-field digital mammography with soft-copy reading in population-based screening program: follow-up and final results of Oslo II study. Radiology 2007;244(3):708–717. [DOI] [PubMed] [Google Scholar]
- 10.Pisano ED, Gatsonis C, Hendrick E, et al. Diagnostic performance of digital versus film mammography for breast-cancer screening. N Engl J Med 2005;353(17):1773–1783. [DOI] [PubMed] [Google Scholar]
- 11.Lewin JM, D’Orsi CJ, Hendrick RE, et al. Clinical comparison of full-field digital mammography and screen-film mammography for detection of breast cancer. AJR Am J Roentgenol 2002;179(3):671–677. [DOI] [PubMed] [Google Scholar]
- 12.Skaane P, Skjennald A, Young K, et al. Follow-up and final results of the Oslo I Study comparing screen-film mammography and full-field digital mammography with soft-copy reading. Acta Radiol 2005;46(7):679–689. [DOI] [PubMed] [Google Scholar]
- 13.Kerlikowske K, Hubbard RA, Miglioretti DL, et al. Comparative effectiveness of digital versus film-screen mammography in community practice in the United States: a cohort study. Ann Intern Med 2011;155(8):493–502. [DOI] [PMC free article] [PubMed] [Google Scholar]
- 14.Hoff SR, Abrahamsen AL, Samset JH, Vigeland E, Klepp O, Hofvind S. Breast cancer: missed interval and screening-detected cancer at full-field digital mammography and screen-film mammography— results from a retrospective review. Radiology 2012;264(2):378–386. [DOI] [PubMed] [Google Scholar]
- 15.Elmore JG, Miglioretti DL, Reisch LM, et al. Screening mammograms by community radiologists: variability in false-positive rates. J Natl Cancer Inst 2002;94(18):1373–1380. [DOI] [PMC free article] [PubMed] [Google Scholar]
- 16.Elmore JG, Jackson SL, Abraham L, et al. Variability in interpretive performance at screening mammography and radiologists’ characteristics associated with accuracy. Radiology 2009;253(3):641–651. [DOI] [PMC free article] [PubMed] [Google Scholar]
- 17.Helse- og Omsorgsdepartementet . Oversatte lover Forskrift 1477. Regulation on the collection and processing of personal health data in the Cancer Registry of Norway (Cancer Registry Regulations). http://www.ub.uio.ujur.lovdata. Accessed February 27, 2014.
- 18.Sørum R, Hofvind S, Skaane P, Haldorsen T. Trends in incidence of ductal carcinoma in situ: the effect of a population-based screening programme. Breast 2010;19(6):499–505. [DOI] [PubMed] [Google Scholar]
- 19.Larsen IK, Småstuen M, Johannesen TB, et al. Data quality at the Cancer Registry of Norway: an overview of comparability, completeness, validity and timeliness. Eur J Cancer 2009;45(7):1218–1231. [DOI] [PubMed] [Google Scholar]
- 20.Hofvind S, Geller B, Vacek PM, Thoresen S, Skaane P. Using the European guidelines to evaluate the Norwegian Breast Cancer Screening Program. Eur J Epidemiol 2007;22(7):447–455. [DOI] [PubMed] [Google Scholar]
- 21.Perry N, Broeders M, Törnquist S, et al. European guidelines for quality assurance in breast cancer screening and diagnosis. Official Publication of the European Communities. Luxembourg: European Communities, 2006. [Google Scholar]
- 22.Hofvind S, Geller BM, Rosenberg RD, Skaane P. Screening-detected breast cancers: discordant independent double reading in a population-based screening program. Radiology 2009;253(3):652–660. [DOI] [PubMed] [Google Scholar]
- 23.Elmore JG, Miglioretti DL, Carney PA. Does practice make perfect when interpreting mammography? Part II. J Natl Cancer Inst 2003;95(4):250–252. [DOI] [PubMed] [Google Scholar]
- 24.Elmore JG, Carney PA. Does practice make perfect when interpreting mammography? J Natl Cancer Inst 2002;94(5):321–323. [DOI] [PubMed] [Google Scholar]
- 25.Hofvind S, Ponti A, Patnick J, et al. False-positive results in mammographic screening for breast cancer in Europe: a literature review and survey of service screening programmes. J Med Screen 2012;19(Suppl 1):57–66. [DOI] [PubMed] [Google Scholar]
- 26.Elmore JG, Barton MB, Moceri VM, Polk S, Arena PJ, Fletcher SW. Ten-year risk of false positive screening mammograms and clinical breast examinations. N Engl J Med 1998;338(16):1089–1096. [DOI] [PubMed] [Google Scholar]
- 27.Woloshin S, Schwartz LM. The benefits and harms of mammography screening: understanding the trade-offs. JAMA 2010;303(2):164–165. [DOI] [PubMed] [Google Scholar]
- 28.Hubbard RA, Kerlikowske K, Flowers CI, Yankaskas BC, Zhu W, Miglioretti DL. Cumulative probability of false-positive recall or biopsy recommendation after 10 years of screening mammography: a cohort study. Ann Intern Med 2011; 155(8):481–492. [DOI] [PMC free article] [PubMed] [Google Scholar]
- 29.Chlebowski RT, Hendrix SL, Langer RD, et al. Influence of estrogen plus progestin on breast cancer and mammography in healthy postmenopausal women: the Women’s Health Initiative Randomized Trial. JAMA 2003;289(24):3243–3253. [DOI] [PubMed] [Google Scholar]
- 30.Carney PA, Miglioretti DL, Yankaskas BC, et al. Individual and combined effects of age, breast density, and hormone replacement therapy use on the accuracy of screening mammography. Ann Intern Med 2003;138(3):168–175. [DOI] [PubMed] [Google Scholar]
- 31.Kerlikowske K, Miglioretti DL, Ballard-Barbash R, et al. Prognostic characteristics of breast cancer among postmenopausal hormone users in a screened population. J Clin Oncol 2003;21(23):4314–4321. [DOI] [PubMed] [Google Scholar]
- 32.Kerlikowske K, Cook AJ, Buist DS, et al. Breast cancer risk by breast density, menopause, and postmenopausal hormone therapy use. J Clin Oncol 2010;28(24):3830–3837. [DOI] [PMC free article] [PubMed] [Google Scholar]


