The use of synthetic mammography in lieu of full-field digital mammography (FFDM), whether alone or in combination with tomosynthesis data sets, does not result in any clinically meaningful differences in diagnostic accuracy and may eliminate the need for FFDM as part of a routine clinical study.
Abstract
Purpose
To assess interpretation performance and radiation dose when two-dimensional synthesized mammography (SM) images versus standard full-field digital mammography (FFDM) images are used alone or in combination with digital breast tomosynthesis images.
Materials and Methods
A fully crossed, mode-balanced multicase (n = 123), multireader (n = 8), retrospective observer performance study was performed by using deidentified images acquired between 2008 and 2011 with institutional review board approved, HIPAA-compliant protocols, during which each patient signed informed consent. The cohort included 36 cases of biopsy-proven cancer, 35 cases of biopsy-proven benign lesions, and 52 normal or benign cases (Breast Imaging Reporting and Data System [BI-RADS] score of 1 or 2) with negative 1-year follow-up results. Accuracy of sequentially reported probability of malignancy ratings and seven-category forced BI-RADS ratings was evaluated by using areas under the receiver operating characteristic curve (AUCs) in the random-reader analysis.
Results
Probability of malignancy–based mean AUCs for SM and FFDM images alone was 0.894 and 0.889, respectively (difference, −0.005; 95% confidence interval [CI]: −0.062, 0.054; P = .85). Mean AUC for SM with tomosynthesis and FFDM with tomosynthesis was 0.916 and 0.939, respectively (difference, 0.023; 95% CI: −0.011, 0.057; P = .19). In terms of the reader-specific AUCs, five readers performed better with SM alone versus FFDM alone, and all eight readers performed better with combined FFDM and tomosynthesis (absolute differences from 0.003 to 0.052). Similar results were obtained by using a nonparametric analysis of forced BI-RADS ratings.
Conclusion
SM alone or in combination with tomosynthesis is comparable in performance to FFDM alone or in combination with tomosynthesis and may eliminate the need for FFDM as part of a routine clinical study.
© RSNA, 2014
Digital breast tomosynthesis has previously been found to be superior in performance to standard digital mammography in both screening and diagnostic settings for the early detection and improved diagnosis of breast cancer (1–14). Currently, as approved by the U.S. Food and Drug Administration (FDA), tomosynthesis must be used in combination with full-field digital mammography (FFDM). The two primary reasons for the requirement of this combined procedure are the concern that some abnormalities—in particular, microcalcification clusters—will not be as readily detected or interpreted correctly on the tomosynthesis images as on conventional mammograms (15) and that the two-dimensional (2D) portion is important for accurate comparison with prior studies. The combined procedure has been implemented in an increasing number of practices (14,16). To date, benefits demonstrated with this combined procedure include substantially reduced recall rates with simultaneous substantial increases in invasive cancer detection rates in the screening environment, as well as improved accuracy over conventional diagnostic 2D additional views for soft–tissue density lesions in the diagnostic setting (7,13,17,18). However, limitations to the combination procedure exist. The combined procedure slows screening productivity, owing to an increase in acquisition and interpretation time, as a result of an increase in the number of images that are obtained and reviewed (19,20). Further, tomosynthesis in combination with FFDM increases radiation dose above that of FFDM alone, roughly by a factor of two (21,22). Despite the improvements in accuracy found to date by using combined tomosynthesis and FFDM, the increased radiation dose to the patient is of concern. Therefore, methods that decrease the amount of radiation exposure to the patient are critical to the advancement and widespread acceptance of this technology. One such method to reduce dose is based on the fact that standard 2D mammograms can be reconstructed, or synthetically generated, from the information acquired during the tomosynthesis data acquisition. Radiation exposure to the patient could potentially be reduced by approximately 40%–50% if it can be demonstrated that radiologists’ interpretations are comparable by using 2D synthetic mammography (SM) versus interpretations rendered from standard digital mammography (FFDM) (23). Initial experimental reconstructions of 2D images from the tomosynthesis data set suggested that radiologists’ performance levels were not comparable to performance when using the original (dose-requiring) FFDM images (24). However, this field continues to evolve rapidly, and improvements in the quality of synthesized reconstructions have been clearly demonstrated, leading to the very recent FDA approval of 2D SM generated from the tomosynthesis data (25). This study was undertaken to assess interpretation performance and dose when 2D SM is used alone or in combination with digital breast tomosynthesis versus performance when standard FFDM is used alone or in combination with tomosynthesis.
Materials and Methods
Case Selection
From a pool of 1184 Health Insurance Portability and Accountability Act–compliant combined FFDM and tomosynthesis research studies performed between 2008 and 2011 at our facility, a group of combination examinations was specifically selected from our research database for this study to design a test set. All patients were recruited with institutional review board–approved protocols and provided written informed consent when they arrived at our breast imaging facility for a screening or diagnostic appointment or a biopsy procedure. Included in the research database were deidentified mammography and tomosynthesis images, imaging reports, and surgical pathology results if an image-guided biopsy and/or surgery was performed. Inclusion criteria for this study were (a) the availability of the original low-dose projection data from the combined FFDM and tomosynthesis study and (b) an assessment that the cancers and benign biopsy cases ascertained during the period in question to be included in the reader study were visually detectable (in retrospect) and not very obvious at FFDM, as determined by two reviewers who did not participate in the interpretations. These were M.L.Z., a breast imaging radiologist with 17 years of experience in mammogram interpretation and 7 years of experience in tomosynthesis image interpretation, and a nonauthor reviewer who did not participate in the observer performance study, who had 35 years of experience in mammogram interpretation and 7 years of experience in tomosynthesis image interpretation. We randomly selected negative cases from all available cases with a predetermined breast density distribution to allow for a distribution similar to that expected in our practice. The final cohort was specifically selected to represent the range of lesions and normal confounders identified in clinical practice.
Image Acquisition and Processing Protocol
During the combined FFDM and tomosynthesis acquisition, the breast is compressed in a conventional manner, and the x-ray tube moves along a limited arc, allowing for 11 or 15 low-dose projection images (“frames”) to be acquired. The unit then acquires the 2D FFDM image prior to release of compression. After acquisition, the data from the frames are used to reconstruct 1-mm-thick sections separated by 1 mm (no spacing or overlap), the number of which varies according to the thickness of the compressed breast. The radiation dose associated with the series of low-dose projection images is set by the acquisition unit to be approximately the same as that of a standard digital mammogram.
In addition to the tomosynthesis image set, a 2D SM, which simulates a conventional 2D digital mammogram, was generated from each set of tomosynthesis sections. The SM images are created by summing and filtering the stack of reconstructed tomosynthesis sections, similar to generating a weighted maximum intensity projection image. The image processing software used in this study (C-View; Hologic, Bedford, Conn) was recently reviewed and given approval for clinical use by an FDA panel (25). The company processed the submitted image set, but the authors had full control over the study design, study execution, data analyses, and interpretation of the results. This acquisition protocol and processing procedure resulted in three sets of mammograms for each participant, including an actually acquired 2D mammogram (FFDM), a 2D SM, and a tomosynthesis reconstructed image set. Each examination yielded four images (a craniocaudal and a mediolateral oblique image of each breast).
Description of the Data Set
The final cohort included images from 123 patients, ranging in age from 35 to 74 years (mean, 51 years; median, 51 years). Ninety-six of the 123 examinations were performed by using 11-projection low-dose image acquisitions, and 27 were performed by using 15 image acquisitions. Included in the study cohort were 39 (32%) normal studies (Breast Imaging Reporting and Data System [BI-RADS] score of 1), 13 (10%) benign studies (BI-RADS score of 2)—all with verified 1-year negative follow-up results—and 71 studies with a single biopsy-proven lesion. The distribution and pathologic findings of the lesions that underwent biopsy were 30 masses (13 malignant and 17 benign), nine asymmetries (four malignant and five benign), five architectural distortions (four malignant and one benign), 19 clusters of calcifications (nine malignant and 10 benign), and eight masses with associated clustered calcifications (six malignant and two benign). For the cases with biopsy findings, lesion size ranged from 3 mm to 160 mm (median, 15 mm; mean, 26 mm). The verified cancer cases included 15 cases of invasive ductal carcinoma, nine cases of invasive ductal carcinoma and ductal carcinoma in situ (DCIS), seven cases of DCIS only, four cases of invasive lobular carcinoma, and one case of papillary carcinoma. The subjectively rated breast density distribution of the cases as recorded during the original clinical interpretation of the mammograms were five of 123 (4%) almost entirely fatty cases (BI-RADS score of 1), 30 of 123 (24%) scattered fibroglandular densities (BI-RADS score of 2), 80 of 123 (65%) heterogeneously dense cases (BI-RADS score of 3), and eight of 123 (6%) extremely dense cases (BI-RADS score of 4). The subjective breast density ratings for the cancer cases were three of 36 (8%), 10 of 36 (28%), 21 of 36 (58%), and two of 36 (6%) for tissue density BI-RADS scores of 1–4, respectively. Twenty-eight of the cases had been used in a prior study that focused on calcifications (15), and 29 were used in another study in which noncalcified lesions were evaluated (12).
Observer Study
Eight Mammography Quality Standards Act–qualified radiologists (V.J.C., D.M.C., A.E.K., A.H.L., G.Y.R., M.L.S., J.H.S., and L.P.W.) with breast imaging experience ranging from 3 to 24 years (mean, 11.2 years) volunteered to participate as readers in the study. None of these radiologists participated in the case selection. Seven of the eight radiologists had been specifically trained in the interpretation of tomosynthesis images since 2006, through participation in previous reader studies and also review of different case sets with available diagnostic outcomes for FDA-mandated initial clinical interpretive training. The youngest radiologist (M.L.S.) had 3 years of experience in tomosynthesis image interpretation through participation in previous reader studies. In addition, all eight readers have routinely interpreted tomosynthesis images in clinical practice since 2011, in both screening and diagnostic settings. For this study, radiologists were asked to retrospectively interpret and sequentially rate the enriched set of 123 mammograms in a fully crossed, mode-balanced (by reader) study. One mode included the review and separate rating of each breast by using the original FFDM images, followed by review of the accompanying tomosynthesis images and then a rating of each breast in the combination study. The other mode included the interpretation of and ratings for each breast by using the synthetic 2D images alone, followed by review of the associated tomosynthesis images and ratings for the combination study. Prior to commencement of the readings, the radiologists received a detailed “instructions for observers” document that defined the task at hand. The document defined the general type of examinations used in this study and the sequential ratings of each breast but did not explain that one set of images was created synthetically. It provided the setup and protocol for reviewing and rating the images. The document also informed readers that computer-aided detection would not be provided and that if there were more than one suspect lesion in a breast, the most suspect lesion should be rated. In each mode, the radiologist was prompted to rate each breast, first with the 2D images alone and then again with the tomosynthesis images by using the seven-point forced BI-RADS (1, 2, 3, 4a, 4b, 4c, or 5) scores. If a breast had a BI-RADS score of 3 and higher, the reader was prompted to provide the type of abnormality in question and a probability of malignancy rating based on the scale of 0–100. There was a minimum of an 8-week interval between reading modes before the same case could be reviewed again with the second mode.
The reader study was conducted on a dual-monitor SecurView DX workstation (Hologic) that was controlled remotely via a laptop with a study management application that was developed in-house. This application, called StudyManager, communicated with the Hologic SecurView system by using the SecurView AppSync programming interface. StudyManager was responsible for driving the study (eg, case by reader by mode randomization, verification of availability of specific cases for review, workflow listing, and completeness of rating form by breast and by case) and for recording all scores. However, all case viewing was done on the SecurView workstation with all clinical functional operations enabled. The workstation includes two 5-megapixel liquid-crystal displays that allowed for the viewing of one, two, or four images per display monitor so up to eight images could be displayed simultaneously, and the system allows for reader-selected display and manipulation of the tomosynthesis data sets, as are performed in clinical practice.
Data Analysis
We analyzed overall accuracy of the breast-based assessment of 246 breasts in 123 patients by eight radiologists with two sequential reading modes: (a) FFDM followed by FFDM with tomosynthesis and (b) SM followed by SM with tomosynthesis. Two primary comparisons were of interest—namely, (a) FFDM alone versus SM alone and (b) combined FFDM with tomosynthesis versus combined SM with tomosynthesis. Accuracy of reported probability of malignancy ratings was evaluated on the basis of the mean area under the receiver operating characteristic (ROC) curve (AUC). The reader-averaged AUC was analyzed by using the multisample nonparametric bootstrap method to account for possible correlation in the evaluation of breasts of the same patients, as well as correlation, if any, between repeated assessments of the same cases by different radiologists with different modalities and between-reader variability. Bootstrap percentile confidence intervals and the corresponding estimated P values were computed on the basis of 100 000 bootstrap samples (1000 resamples of cases by 100 resamples of readers). For individual readers, the analysis was conducted by using 10 000 case-based bootstrap resamples. Statistical inferences were performed at the significance level of .05. In the secondary analysis, we analyzed ROC curves constructed from the forced BI-RADS ratings. Differences in sensitivity and specificity were analyzed by using the generalized linear mixed model for binary data (proc glimmix, SAS version 9.3; SAS, Cary, NC), accounting for correlations between evaluations of the same cases, as well as for the between-reader variability.
Results
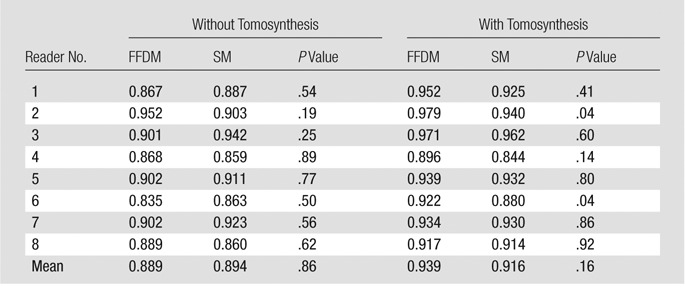
The reader-averaged AUCs for SM and FFDM alone were 0.894 and 0.889, respectively (difference, −0.005; 95% confidence interval [CI]: −0.062, 0.054; P = .86). For SM plus tomosynthesis and FFDM plus tomosynthesis, AUCs were 0.916 and 0.939, respectively (difference, 0.023; 95% CI: −0.011, 0.057; P = .19, Fig 1). We note that even for the fixed-reader analysis (bootstrap of cases only), the difference between the combined modalities was also not significant (P = .08). Five readers performed somewhat better with SM than with FFDM, while all eight readers performed marginally better with FFDM plus tomosynthesis (Table). However, these differences were minimal and did not lead to any substantial differences in the mean AUCs. With the exception of reader 4, who performed slightly worse (AUC difference, 0.015) with SM plus tomosynthesis, as compared with SM alone, all other readers improved their performance in the corresponding sequential reading modes when tomosynthesis was made available to them after review of either the original FFDM or SM alone.
Figure 1:
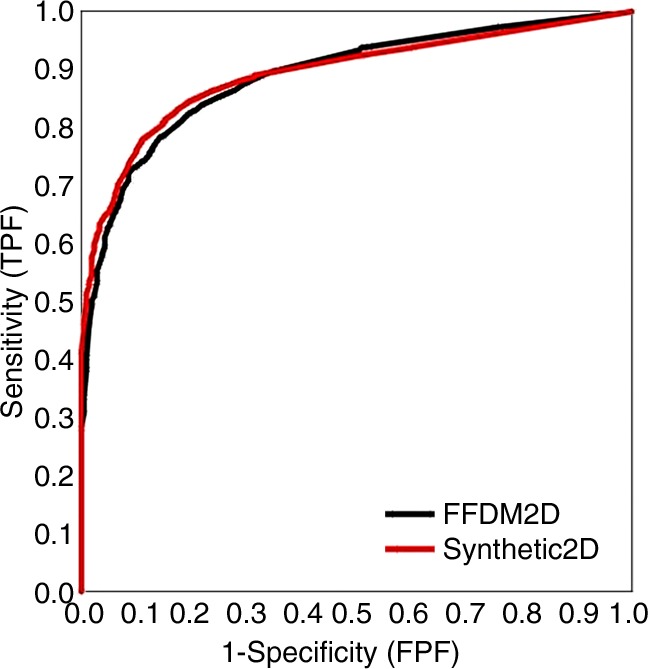
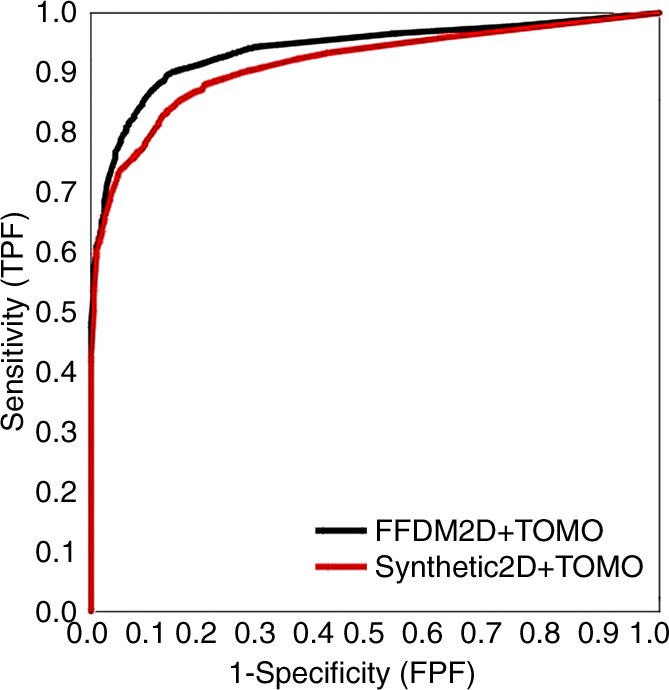
Overall ROC curves based on probability of malignancy ratings for individual breasts. FPF = false-positive fraction, TOMO = tomosynthesis, TPF = true-positive fraction.
Empirical Breast-based AUCs Based on Probability of Malignancy Ratings in 36 Patients with and 87 Patients without Verified Cancer
Similar proximity of the overall performance levels was observed for ROC curves based on the forced BI-RADS ratings (Fig 2). We noted, however, that when using SM, radiologists tended to give a higher BI-RADS score to the breast in question when a biopsy-proven cancer was present. In these cases, there was a small, albeit persistent, shift toward BI-RADS 4c and 5 ratings, with differences in sensitivity of the two operating points of 0.14 (P = .048) for BI-RADS rating 4c and 0.12 (P = .009) for BI-RADS rating 5. Figure 3 shows an example of a spiculated mass at FFDM and SM, and Figure 4 shows fine pleomorphic calcifications at FFDM and SM.
Figure 2:
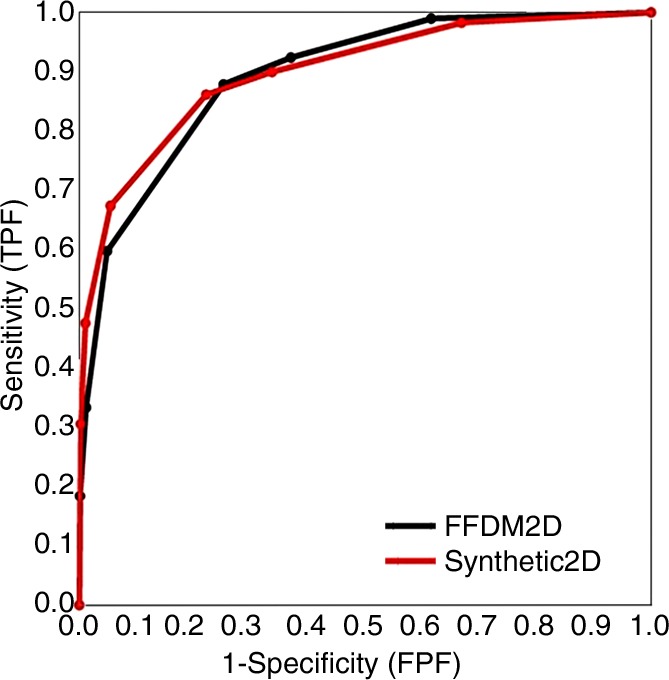
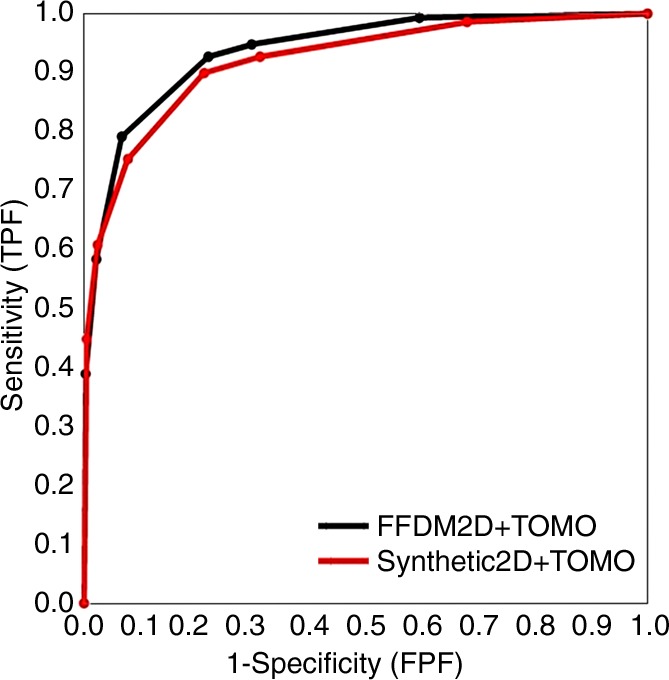
Overall breast-based ROC curves for forced BI-RADs ratings. FPF = false-positive finding, TOMO = tomosynthesis, TPF = true-positive finding.
Figure 3a:

(a) FFDM and (b) SM craniocaudal images demonstrate a spiculated mass in a 58-year-old woman that proved to be invasive ductal carcinoma at biopsy.
Figure 4a:
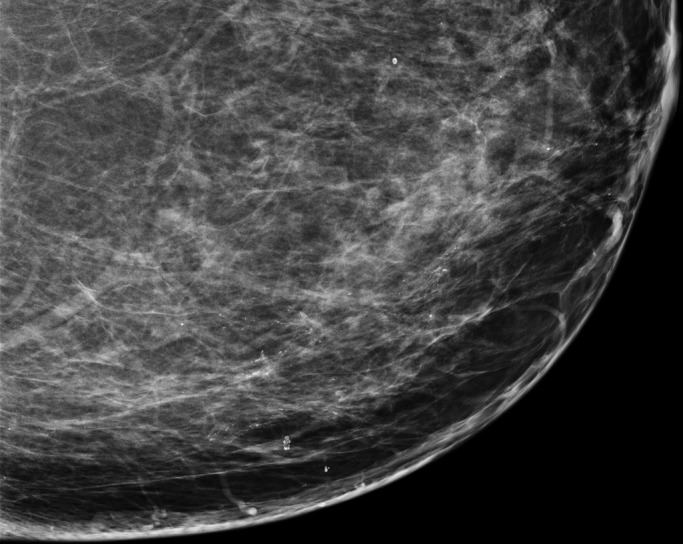
(a) FFDM and (b) SM craniocaudal images demonstrate segmental distribution of fine pleomorphic calcifications in a 55-year-old woman that were due to DCIS.
Figure 3b:
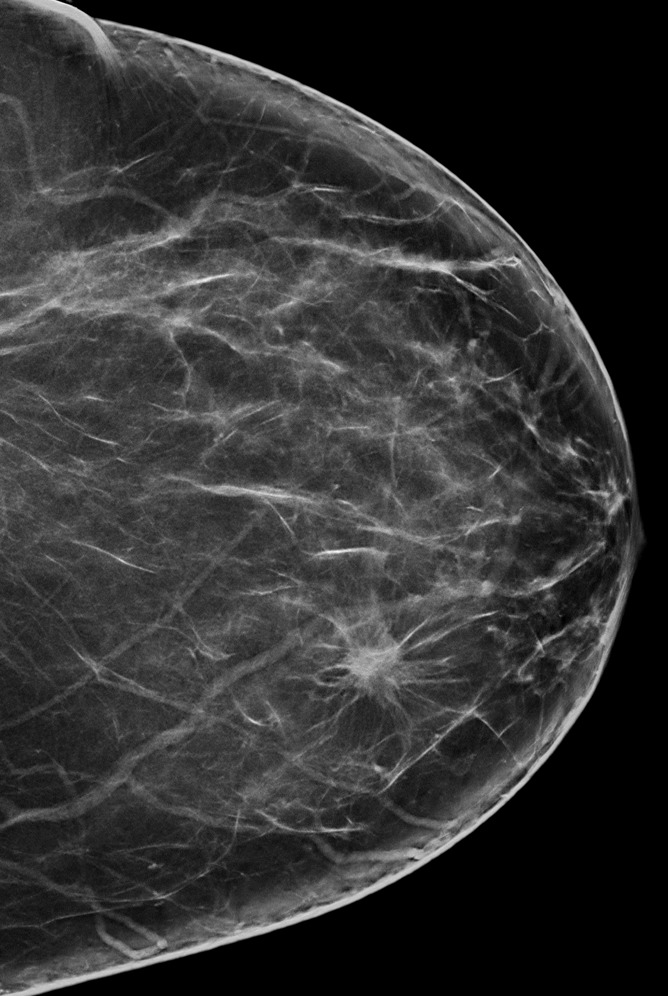
(a) FFDM and (b) SM craniocaudal images demonstrate a spiculated mass in a 58-year-old woman that proved to be invasive ductal carcinoma at biopsy.
Figure 4b:
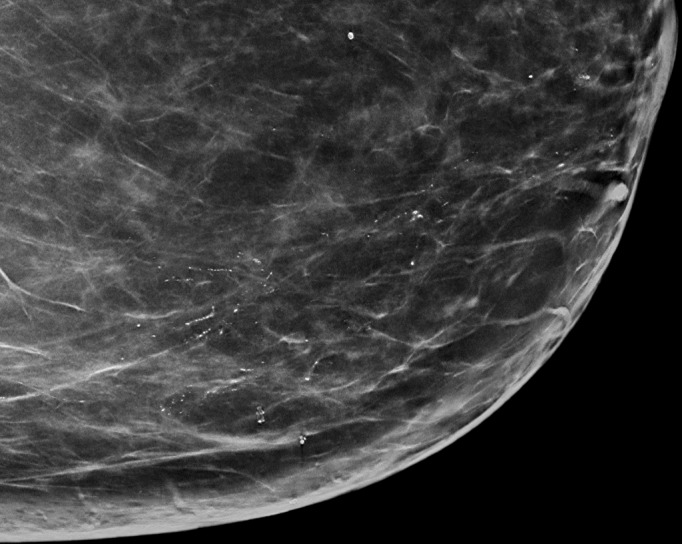
(a) FFDM and (b) SM craniocaudal images demonstrate segmental distribution of fine pleomorphic calcifications in a 55-year-old woman that were due to DCIS.
To evaluate if there would be a difference in recall rates when using SM, the data were analyzed by evaluating the frequency of BI-RADS 3 and higher scores in each mode for both the proven cancer cases and the benign cases. For the verified cancer cases, there was no significant difference in the frequency of recall scores (BI-RADS scores 3–5) between SM and FFDM alone (0.90 vs 0.92, respectively; P = .56) or between combined SM with tomosynthesis and FFMD with tomosynthesis (0.93 vs 0.95, respectively; P = .39). Similarly, for the verified benign cases, the recall rate was similar for SM and FFDM alone (0.34 vs 0.37, respectively; P = .26) and SM with tomosynthesis and FFMD with tomosynthesis (0.31 vs 0.30, respectively; P = .54).
Overall, in the nine cases (seven DCIS and two invasive ductal carcinoma) visible only as microcalcifications, the readers identified the case as abnormal (BI-RADS score of 3–5) in 88% of ratings (63 of 72) by using FFDM with tomosynthesis and in 86% of ratings (62 of 72) by using SM with tomosynthesis (P = .77). In the 27 cases where the finding was primarily a soft tissue–density lesion (eg, mass, architectural distortion, or asymmetry), the reader identified the case as abnormal (BI-RADS score of 3–5) in 97.2% of cases (210 of 216) by using FFDM with tomosynthesis and in 94.9% of cases (205 of 216) by using SM with tomosynthesis (P = .20).
Discussion
In this study, we attempted to assess whether or not the recently FDA-approved synthetically reconstructed projection 2D images (SMs) would result in similar clinical performance to standard FFDM images by using a reasonably plausible stress test. We found that, when used as a 2D examination alone, SM images yielded a performance similar to that of the originally acquired FFDM images. The confidence limits for the difference in the overall AUCs were ±0.058 for SM and FFDM alone and ±0.034 for SM and FFDM in combination with tomosynthesis. These values further support the reasonable similarity in overall performance levels of radiologists when using SM in lieu of FFDM. For data sets with sample structure and levels of variability similar to the ones we observed in this study, there is a 39% and 83% statistical power for detecting a difference of .05 in the mean AUCs for 2D images alone and 2D images in combination with tomosynthesis images, respectively. However, performance was slightly lower when radiologists interpreted the combined SM and tomosynthesis images. The difference in AUC was smaller than that reported previously for an experimental version of synthetically reconstructed 2D images (24) and was not specifically related to the detection of microcalcification clusters. In our study, five of eight readers performed slightly (though not significantly) better with the SM images alone than with the original FFDM images alone. This change in performance is likely due to improvements in the quality of the synthetic images that has occurred since that older study was conducted. Our study suggests that as 2D reconstruction approaches continue to improve, they could potentially produce images that are actually better than FFDM because they have the advantage of leveraging information from the multiple projection views (frames) of the same tissue structure. Both of the combined mammogram and tomosynthesis modalities used here had performance that was better than that using traditional FFDM alone, and the performance difference between the two corresponding 2D or combination imaging approaches is small, even with a stress test. Hence, we believe that the FDA-approved synthetic 2D images should be considered acceptable and adequate for routine clinical practice. This approach will substantially reduce the radiation exposure to women undergoing imaging with this combined procedure. This is of particular importance in screening, where most women (>990 of 1000) do not have cancer in any one examination cycle.
It is interesting to note that SM images alone performed at least as well, if not slightly better than, the originally acquired digital mammograms alone in this study, while not providing as much improvement when used in combination with the tomosynthesis image set. One plausible explanation for this finding may be the fact that all the information in the 2D SM is derived solely from the tomosynthesis image set, while the FFDM is likely to carry some independent, non–fully correlated information. Hence, the combination of FFDM and tomosynthesis may contain some minimal amount of additional diagnostic information not available in the combination SM and tomosynthesis examination. Another possible explanation is that further improvements in the synthetic 2D images are needed to realize an overall improvement in the combination mode.
Our study had several limitations. A substantial fraction of our tomosynthesis data sets included only 11 acquired low-dose projection frames, resulting in potentially suboptimal SM and tomosynthesis combined examinations, as compared with those studies that had 15 projection frames acquired. This could have biased the study toward the FFDM and tomosynthesis arm. However, we have no specific data to prove this assumption. This is a preliminary single-site, retrospective study, with all generalizability-related issues. The level of variability in the observed data indicates that our study was underpowered for estimating differences between performance levels by using SM and FFDM alone (ie, confidence limits ± 0.05; statistical power < 50%). However, this type of an assessment is secondary in terms of clinical relevance, as any SM versions are reconstructed from the tomosynthesis images and are not designed for stand-alone use. Because both tomosynthesis and SM images continue to improve rapidly, it is possible that currently or in the very near future, SM images may yield better performance than conventional FFDM images, and so these results may only reflect interpretive performance with the version of software used in this study. Further, we only used FFDM and tomosynthesis images from a single manufacturer and 2D SM images from a single version of software from the same manufacturer; thus, results with other equipment and SM algorithms may be different. For a reader study like the one presented here, one has to select the version of software being tested for the duration of the study, even if more current versions become available over the course of the study. In this particular instance, the version of SM images presented here is no longer the most advanced version, with additional improvements already being investigated. In addition, the study is potentially biased somewhat toward FFDM, because most positive examination findings were originally detected at FFDM. Last, the case distribution used in the study can be looked upon as somewhat of a stress set, likely to result in an upper limit of expected differences in performance levels between the modes, and in clinical practice, one should expect an even smaller difference.
In conclusion, the use of SM in lieu of FFDM, whether alone or in combination with tomosynthesis data sets, does not result in any clinically meaningful differences in diagnostic accuracy and may eliminate the need for FFDM as part of a routine clinical study.
Advance in Knowledge
■ Performance levels as demonstrated by probability of malignancy–based area under the receiver operating characteristic curve (AUC) analysis with synthetic mammography (SM) alone (AUC = 0.89) and in combination with tomosynthesis (AUC = 0.92) were comparable to performance levels when using digital mammography alone (AUC = 0.89) or digital mammography with tomosynthesis (AUC = 0.94).
Implications for Patient Care
■ Two-dimensional SM can be used as an acceptable replacement for directly acquired mammograms in tomosynthesis-based evaluations.
■ The use of SMs reduces radiation dose to patients undergoing tomosynthesis-based screening mammography.
PODCAST
From the 2011 RSNA Annual Meeting.
Received July 2, 2013; revision requested August 19; revision received October 23; accepted November 5; final version accepted November 22.
See also the editorial by Kopans and the article by Skaane et al in this issue.
Funding: This research was supported by the National Institutes of Health (grants CA144055 and CA163300).
Disclosures of Conflicts of Interest: M.L.Z. Financial activities related to the present article: institution received a grant from Hologic. Financial activities not related to the present article: author received travel expenses to attend a scientific advisory meeting for Hologic. Other relationships: none to disclose. B.G. No relevant conflicts of interest to disclose. V.J.C. No relevant conflicts of interest to disclose. D.M.C. No relevant conflicts of interest to disclose. A.E.K. No relevant conflicts of interest to disclose. A.H.L. No relevant conflicts of interest to disclose. G.Y.R. No relevant conflicts of interest to disclose. M.L.S. No relevant conflicts of interest to disclose. J.H.S. Financial activities related to the present article: none to disclose. Financial activities not related to the present article: author received money for (a) consultancies with Cognolink, Guidepoint Global, and MedaCorp, (b) for expert testimony in a case of a missed breast cancer, (c) for lectures, including service on speakers’ bureaus, (d) for development of educational presentations, and (e) for travel, accommodations, and meeting expenses; and institution received a grant from Hologic per a PI Global research agreement. Other relationships: none to disclose. L.P.W. No relevant conflicts of interest to disclose. A.I.B. Financial activities related to the present article: author received fees from Hologic for participation in review activities. Financial activities not related to the present article: none to disclose. Other relationships: none to disclose.
Abbreviations:
- AUC
- area under the ROC curve
- BI-RADS
- Breast Imaging Reporting and Data System
- CI
- confidence interval
- DCIS
- ductal carcinoma in situ
- FDA
- Food and Drug Administration
- FFDM
- full-field digital mammography
- ROC
- receiver operating characteristic
- SM
- synthesized mammography
- 2D
- two-dimensional
References
- 1.Niklason LT, Christian BT, Niklason LE, et al. Digital tomosynthesis in breast imaging. Radiology 1997;205(2):399–406. [DOI] [PubMed] [Google Scholar]
- 2.Moore RH, Kopans DB, Rafferty EA, et al. Initial callback rates for conventional and digital breast tomosynthesis mammography comparison in the screening environment [abstr]. In: Radiological Society of North America Scientific Assembly and Annual Meeting Program. Oak Brook, Ill: Radiological Society of North America, 2007; 381. [Google Scholar]
- 3.Hologic submission to FDA panel for approval of tomosynthesis. View online. Published September 24, 2010. Accessed December 18, 2013.
- 4.Poplack SP, Tosteson TD, Kogel CA, Nagy HM. Digital breast tomosynthesis: initial experience in 98 women with abnormal digital screening mammography. AJR Am J Roentgenol 2007;189(3):616–623. [DOI] [PubMed] [Google Scholar]
- 5.Smith A, Niklason L, Jing Z. Performance of breast tomosynthesis as an adjunct imaging modality to digital mammography [abstr]. Eur Radiol 2008;18(1):150. [Google Scholar]
- 6.Smith A, Rafferty E, Niklason L. Breast tomosynthesis reduces radiologist performance variability compared to digital mammography [abstr]. Eur Radiol 2009;19(1):S151. [Google Scholar]
- 7.Gur D, Abrams GS, Chough DM, et al. Digital breast tomosynthesis: observer performance study. AJR Am J Roentgenol 2009;193(2):586–591. [DOI] [PubMed] [Google Scholar]
- 8.Bernardi D, Ciatto S, Pellegrini M, et al. Prospective study of breast tomosynthesis as a triage to assessment in screening. Breast Cancer Res Treat 2012;133(1):267–271. [DOI] [PubMed] [Google Scholar]
- 9.Gennaro G, Toledano A, di Maggio C, et al. Digital breast tomosynthesis versus digital mammography: a clinical performance study. Eur Radiol 2010;20(7):1545–1553. [DOI] [PubMed] [Google Scholar]
- 10.Skaane P, Gullien R, Bjørndal H, et al. Digital breast tomosynthesis (DBT): initial experience in a clinical setting. Acta Radiol 2012;53(5):524–529. [DOI] [PubMed] [Google Scholar]
- 11.U.S. Department of Health & Human Services. U.S. Food and Drug Administration. Medical devices, products and medical procedures, device approvals and clearances, recently approved devices. View online. Published September 6, 2013. Accessed December 18, 2013.
- 12.Zuley ML, Bandos AI, Ganott MA, et al. Digital breast tomosynthesis versus supplemental diagnostic mammographic views for evaluation of noncalcified breast lesions. Radiology 2013;266(1):89–95. [DOI] [PMC free article] [PubMed] [Google Scholar]
- 13.Rafferty EA, Park JM, Philpotts LE, et al. Assessing radiologist performance using combined digital mammography and breast tomosynthesis compared with digital mammography alone: results of a multicenter, multireader trial. Radiology 2013;266(1):104–113. [DOI] [PMC free article] [PubMed] [Google Scholar]
- 14.Rose SL, Tidwell AL, Bujnoch LJ, Kushwaha AC, Nordmann AS, Sexton R, Jr. Implementation of breast tomosynthesis in a routine screening practice: an observational study. AJR Am J Roentgenol 2013;200(6):1401–1408. [DOI] [PubMed] [Google Scholar]
- 15.Spangler ML, Zuley ML, Sumkin JH, et al. Detection and classification of calcifications on digital breast tomosynthesis and 2D digital mammography: a comparison. AJR Am J Roentgenol 2011;196(2):320–324. [DOI] [PubMed] [Google Scholar]
- 16.Skaane P, Bandos AI, Gullien R, et al. Prospective trial comparing full-field digital mammography (FFDM) versus combined FFDM and tomosynthesis in a population-based screening programme using independent double reading with arbitration. Eur Radiol 2013;23(8):2061–2071. [DOI] [PMC free article] [PubMed] [Google Scholar]
- 17.Gur D, Bandos AI, Rockette HE, et al. Localized detection and classification of abnormalities on FFDM and tomosynthesis examinations rated under an FROC paradigm. AJR Am J Roentgenol 2011;196(3):737–741. [DOI] [PubMed] [Google Scholar]
- 18.Skaane P, Bandos AI, Gullien R, et al. Comparison of digital mammography alone and digital mammography plus tomosynthesis in a population-based screening program. Radiology 2013;267(1):47–56. [DOI] [PubMed] [Google Scholar]
- 19.Zuley ML, Bandos AI, Abrams GS, et al. Time to diagnosis and performance levels during repeat interpretations of digital breast tomosynthesis: preliminary observations. Acad Radiol 2010;17(4):450–455. [DOI] [PubMed] [Google Scholar]
- 20.Bernardi D, Ciatto S, Pellegrini M, et al. Application of breast tomosynthesis in screening: incremental effect on mammography acquisition and reading time. Br J Radiol 2012;85(1020):e1174–e1178. [DOI] [PMC free article] [PubMed] [Google Scholar]
- 21.Olgar T, Kahn T, Gosch D. Average glandular dose in digital mammography and breast tomosynthesis. Rofo 2012;184(10):911–918. [DOI] [PubMed] [Google Scholar]
- 22.Sechopoulos I. A review of breast tomosynthesis. Part I. The image acquisition process. Med Phys 2013;40(1):014301. [DOI] [PMC free article] [PubMed] [Google Scholar]
- 23.Vecchio S, Albanese A, Vignoli P, Taibi A. A novel approach to digital breast tomosynthesis for simultaneous acquisition of 2D and 3D images. Eur Radiol 2011;21(6):1207–1213. [DOI] [PubMed] [Google Scholar]
- 24.Gur D, Zuley ML, Anello MI, et al. Dose reduction in digital breast tomosynthesis (DBT) screening using synthetically reconstructed projection images: an observer performance study. Acad Radiol 2012;19(2):166–171. [DOI] [PMC free article] [PubMed] [Google Scholar]
- 25.U.S. Food and Drug Administration, Meeting of the Radiological Devices Advisory Panel. P080003/S001 Hologic Selenia Dimensions 3D system FDA executive summary. View online. Published October 24, 2012. Accessed December 18, 2013. [Google Scholar]
Associated Data
This section collects any data citations, data availability statements, or supplementary materials included in this article.


