

A dedicated extremity cone-beam CT scanner with weight-bearing capability provides sufficient image quality and a favorable dose profile to warrant further evaluation.
Abstract
Purpose
To provide initial assessment of image quality and dose for a cone-beam computed tomographic (CT) scanner dedicated to extremity imaging.
Materials and Methods
A prototype cone-beam CT scanner has been developed for imaging the extremities, including the weight-bearing lower extremities. Initial technical assessment included evaluation of radiation dose measured as a function of kilovolt peak and tube output (in milliampere seconds), contrast resolution assessed in terms of the signal difference–to-noise ratio (SDNR), spatial resolution semiquantitatively assessed by using a line-pair module from a phantom, and qualitative evaluation of cadaver images for potential diagnostic value and image artifacts by an expert CT observer (musculoskeletal radiologist).
Results
The dose for a nominal scan protocol (80 kVp, 108 mAs) was 9 mGy (absolute dose measured at the center of a CT dose index phantom). SDNR was maximized with the 80-kVp scan technique, and contrast resolution was sufficient for visualization of muscle, fat, ligaments and/or tendons, cartilage joint space, and bone. Spatial resolution in the axial plane exceeded 15 line pairs per centimeter. Streaks associated with x-ray scatter (in thicker regions of the patient—eg, the knee), beam hardening (about cortical bone—eg, the femoral shaft), and cone-beam artifacts (at joint space surfaces oriented along the scanning plane—eg, the interphalangeal joints) presented a slight impediment to visualization. Cadaver images (elbow, hand, knee, and foot) demonstrated excellent visibility of bone detail and good soft-tissue visibility suitable to a broad spectrum of musculoskeletal indications.
Conclusion
A dedicated extremity cone-beam CT scanner capable of imaging upper and lower extremities (including weight-bearing examinations) provides sufficient image quality and favorable dose characteristics to warrant further evaluation for clinical use.
© RSNA, 2013
Introduction
In current clinical practice, computed tomography (CT) is used for a number of musculoskeletal conditions, including trauma, neoplasm, inflammatory and/or infectious disease, preoperative planning, and postoperative assessment (1). Current CT scanners use multidetector CT configurations (2) in which a narrowly collimated, fan-shaped x-ray beam and detector with typically up to 64 detector rows rotates around the patient to acquire multiple image sections per rotation. The use of multiple detector rows and helical acquisition enables faster scanning and larger volume coverage per rotation, and the use of thin detector rows (<1 mm) enables isotropic, submillimeter spatial resolution, facilitating three-dimensional multiplanar and volumetric renderings. Simultaneous demonstration of numerous structures of interest is possible with use of volume rendering, with contrast resolution typically sufficient for visualization among soft tissues (muscle, fat, tendons and/or ligaments) and bone (3). Current clinical CT embodiments involve scanning a patient in a non–weight-bearing position.
Cone-beam CT uses a large-area detector (typically >1000 detector rows and columns covering ∼30 × 30 cm2) and a pyramid-shaped x-ray beam (“cone”), obtaining fully volumetric data from multiple projections acquired in a single rotation about the patient without moving the patient through the scanner (4). For both multidetector and cone-beam CT, volumetric images are reconstructed by using three-dimensional filtered back projection (5) or newer iterative, model-based image reconstruction techniques (6–8). The relatively simple mechanical configuration of cone-beam CT facilitates the development of novel platforms specifically suited to a variety of clinical applications, including dental and/or maxillofacial imaging (9), breast imaging (10), image-guided radiation therapy (11), and surgery and/or interventions (12). Similarly, musculoskeletal extremity imaging presents a potentially valuable extension of such cone-beam CT platforms, motivated by the need to image weight-bearing extremities, potentially improve image quality and reduce radiation dose, enhance workflow, simplify site considerations, and reduce cost in comparison to that of multidetector CT. With a specialized musculoskeletal application in mind, a cone-beam CT device for extremity imaging was designed, developed, and tested on an experimental platform (13,14). Subsequently, a clinical prototype has been constructed, including a weight-bearing capability for lower extremities. The purpose of this study was to provide initial technical and preclinical assessment of image quality and dose for the prototype cone-beam CT extremity scanner.
Materials and Methods
The system reported below was developed in academic-industry collaboration between Johns Hopkins University (Baltimore, Md) and Carestream Health (Rochester, NY), in which the latter provided material and financial support. Authors N.P., R.S., D.Y., D.H.F., and J.Y. are employees of Carestream Health. Authors J.A.C., A.A.M., W.Z., G.K.T., J.W.S. and J.H.S. controlled the data and information included herein. All studies were conducted in accordance with state and institutional requirements.
System Description
A description of the system is provided in Appendix E1 (online), Figure 1, and Figure E1 (online). Other details of design and mechanical components are detailed in a previous article (13). Each scan involved 490 projections acquired over a 220° arc in 20 seconds. Separate cone-beam CT image reconstruction protocols were used for the visualization of bone (0.26 × 0.26 × 0.26-mm3 voxels, ramp filter) and soft tissue (0.52 × 0.52 × 0.52-mm3 voxels, ramp and Hann filters). Although no additional image artifact correction methods were applied in the current studies, they are the subject of future work.
Figure 1:

Scanner configuration. Photograph of prototype cone-beam CT extremity scanner shows orientation of scanner and patient for imaging of lower extremities (weight-bearing examination).
Performance Characterization
Radiation dose.—Imaging dose was measured as a function of kilovolt peak and tube output (in milliampere seconds). Dose measurements were acquired by placing a 0.6-cm3 Farmer ionization chamber at the center and periphery of a 16-cm-diameter acrylic CT dose index (CTDI) phantom. To account for dose associated with x-ray scatter in a broad beam, additional 16-cm CTDI phantoms were placed above and below, spanning a total length of approximately 45 cm, and all dose measurements were performed in the central axial plane as outlined in American Association of Physicists in Medicine Task Group Report No. 111 (15). The dose was measured at the center (Dcenter) and at the four peripheral positions (Dperiph). Because the system involves a short-scan orbit of approximately 220° (and a nonuniform Dperiph), the short-scan weighted dose (Dw) was computed in a manner analogous to weighted CTDI by combining the central dose with the average peripheral dose (16), as follows:
Because the 16-cm-diameter phantom may not represent the spectrum of sizes pertinent to extremity imaging, the size-specific dose estimate was computed by using scale factors specified in American Association of Physicists in Medicine Report No. 204 (17), scaling Dw by a factor of 1.4 (wrist) or 0.8 (large knee). Similar measurements were performed with a clinical multidetector CT scanner (dual-source 64-section CT scanner [Somatom Definition Flash; Siemens Healthcare, Erlangen, Germany]) by using routine institutional protocols (www.ctisus.com) for CT of the extremities (100 kVp, 250 mAs, 0.85 pitch). Two variations were considered in the multidetector CT setup: a single-leg setup (one stack of CTDI phantoms, 16-cm diameter, 45-cm length, with the Farmer chamber placed in the center) and a double-leg setup (two side-by-side stacks of CTDI phantoms, with the Farmer chamber placed in the center of either stack). The scan length in each case matched that of the cone-beam CT scanner (22 cm).
Contrast resolution.—The performance in the imaging of soft tissue was assessed in terms of contrast resolution in a 16-cm-diameter cylindrical phantom (Solid Water; Gammex, Madison, Wis) that included electron density inserts spanning a range of Hounsfield units, including −100 HU (“adipose tissue”), +3 HU (Solid Water), −45 HU (BR-12 “breast”), +10 HU (“muscle”), +280 HU (“trabecular bone”), and +1600 HU (“cortical bone”). Images were acquired at varying levels of dose at variable kilovolt peak (60–120 kVp) and milliampere second. Contrast resolution was assessed in terms of the signal difference–to-noise ratio (SDNR), as follows:
where μinsert and μbackground are the mean voxel value over 30 × 30 voxel regions of interest in a given tissue-equivalent insert and the Solid Water background, respectively, and σinsert and σbackground, the standard deviation in voxel values over the respective regions of interest (all computed and averaged over 20 contiguous sections about the central axial plane). For the soft-tissue SDNR analysis, images were reconstructed according to the soft-tissue reconstruction protocol. Images of a cadaveric knee were also acquired at each setting.
Spatial resolution.—Spatial resolution was semiquantitatively assessed by using a line-pair module from a CatPhan phantom (The Phantom Laboratory, Greenwich, NY). The phantom was imaged at 80 kVp and 108 mAs per scan. The minimum detectable line-pair group was qualitatively assessed in comparison to a previous analysis of modulation transfer function (13) for the same system configuration. Images were reconstructed using both 1 × 1 and 2 × 2 detector binning according to the bone reconstruction protocol. Images of a cadaveric hand were also acquired at each setting.
Human cadaver images.—Qualitative assessment was performed with fresh cadaver specimens by imaging one of each of the following joints: elbow (82-year-old female), hand (74-year-old female), knee (67-year-old male), and foot (79-year-old male). Examinations were performed in both the upright configuration (knee and foot) and the conventional horizontal configuration (hand and elbow). Imaging protocols were selected on the basis of the results of the SDNR study. Assessment involved an expert observer (J.A.C., a musculoskeletal radiologist with >15 years of experience reading CT images) interpreting each cone-beam CT image on a calibrated, diagnostic-quality display in a darkened reading room.
Each image was assessed on a qualitative ordinal scale (1 = poor, 2 = fair, 3 = good, 4 = very good, 5 = excellent) with respect to five pertinent visualization tasks: tendons and/or ligaments, muscle, joint space and/or cartilage, bone cortex, and bone trabeculae. Fractures were created (Appendix E2, online) and assessed in the hand and knee and evaluated as an additional visualization task.
These initial studies were intended as tests of feasibility and potential image quality (not as a statistically powered analysis of diagnostic performance). Image artifacts were also rated as to the extent to which they potentially inhibited the performance of each task, as follows: 1 = minor or no effect on visibility, 2 = slightly reduces visibility, or 3 = strongly reduces visibility. The nature of artifacts (ie, rings, shading, streaks, or blur) was also recorded.
Results
Radiation Dose
Dose measurements are summarized in Figure 2. The absolute dose at the center of the 16-cm-diameter phantom (Dcenter per unit total scan milliampere second) ranged from 0.03 mGy/mAs at 60 kVp to 0.40 mGy/mAs at 120 kVp. As shown in Figure 2b, the dose is heterogeneous within the phantom due to the short arc (220°) of the x-ray source and detector, with the peripheral dose eight times lower at position 3 (near the gantry door) than at position 1 (at the midpoint of the source orbit). The dose for various scan protocols within the power limits of the x-ray generator yielded are shown in the Table. For example, the nominal 80-kVp protocol (selected on the basis of SDNR results, below) imparts a center dose of 9.0 mGy; alternatively, the dose with side-specific dose estimate was approximately 14.0 mGy for the smaller (8 cm) size and approximately 8.0 mGy for the larger (22 cm) size. The dose measured with the multidetector CT scanner was 39.7 mGy for the single-leg setup and 27.4 mGy for the double-leg setup.
Figure 2a:
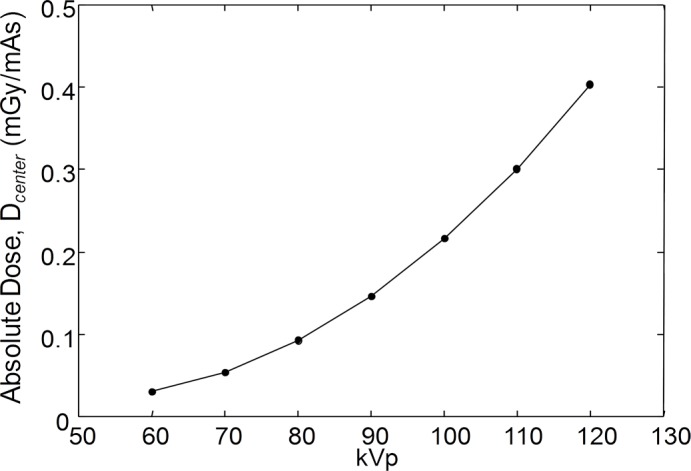
(a) Graph of absolute dose (per unit scan milliampere second) at center of 16-cm CTDI phantom measured as a function of kilovolt peak. (b) Spatial distribution of dose in relation to orbit of x-ray source for nominal knee protocol (80 kVp and 108 mAs, for central dose of 9 mGy).
Figure 2b:

(a) Graph of absolute dose (per unit scan milliampere second) at center of 16-cm CTDI phantom measured as a function of kilovolt peak. (b) Spatial distribution of dose in relation to orbit of x-ray source for nominal knee protocol (80 kVp and 108 mAs, for central dose of 9 mGy).
Summary of Scan Techniques and Radiation Dose

The system was operated at the maximum tube current (10 mA) for the 60–80-kVp protocols. For the 90–120-kVp protocols, the tube current was adjusted to maintain a constant dose of approximately 11–12 mGy.
Obtained in a 16-cm-diameter phantom.
SSDE = side-specific dose estimate.
Contrast Resolution
As shown in Figure 3a, SDNR was maximized with the 80-kVp scan technique, although the peak in SDNR is due to the limitation in generator power (0.875 kW) and maximum tube current (10 mA) and should not be considered a true “optimum.” Specifically, the lower kilovolt peak techniques (60–80 kVp) operate at maximum tube current (10 mA) and lower dose (see the Table and the top horizontal axis in Fig 3a) and therefore exhibit increased noise. (It was not possible to deliver a higher dose owing to the milliampere limit.) The higher kilovolt peak techniques (90–120 kVp) operate at a fixed dose of 11–12 mGy (a dose typical of extremity CT [18]) and exhibit the expected reduction in SDNR versus beam energy due to reduced contrast and detection efficiency. The 80-kVp technique is therefore the best operating point for the current system configuration within a dose level of less than 12 mGy. Figure 3b demonstrates the result in a tissue-simulating (“adipose”) insert in the Solid Water phantom, illustrating the tradeoffs between contrast, noise, and tube output, which are also evident in the cadaver knee image in Figure 3c. Within the power limits of the prototype, the 80-kVp setting was used in all results below.
Figure 3a:

Contrast resolution. All results correspond to soft-tissue reconstruction protocol (0.52-mm isotropic voxels). (a) SDNR versus kilovolt peak for selected inserts: adipose (−100 HU), breast (−45 HU), and muscle (+10 HU), with absolute central dose shown on top axis. Curve fits are intended as a guide to the eye (not an analytical model). (b) Axial images in region of adipose insert (−100 HU) at 60–110 kVp. (c) Sagittal sections of cadaver knee at 60, 80, and 100 kVp. Window width is 388 HU in each case, with levels of +112 HU at 60 kVp, −63 HU at 80 kVp, and −190 HU at 100 kVp.
Figure 3b:

Contrast resolution. All results correspond to soft-tissue reconstruction protocol (0.52-mm isotropic voxels). (a) SDNR versus kilovolt peak for selected inserts: adipose (−100 HU), breast (−45 HU), and muscle (+10 HU), with absolute central dose shown on top axis. Curve fits are intended as a guide to the eye (not an analytical model). (b) Axial images in region of adipose insert (−100 HU) at 60–110 kVp. (c) Sagittal sections of cadaver knee at 60, 80, and 100 kVp. Window width is 388 HU in each case, with levels of +112 HU at 60 kVp, −63 HU at 80 kVp, and −190 HU at 100 kVp.
Figure 3c:

Contrast resolution. All results correspond to soft-tissue reconstruction protocol (0.52-mm isotropic voxels). (a) SDNR versus kilovolt peak for selected inserts: adipose (−100 HU), breast (−45 HU), and muscle (+10 HU), with absolute central dose shown on top axis. Curve fits are intended as a guide to the eye (not an analytical model). (b) Axial images in region of adipose insert (−100 HU) at 60–110 kVp. (c) Sagittal sections of cadaver knee at 60, 80, and 100 kVp. Window width is 388 HU in each case, with levels of +112 HU at 60 kVp, −63 HU at 80 kVp, and −190 HU at 100 kVp.
Spatial Resolution
Figure 4 illustrates the spatial resolution measurements qualitatively in a line-pair phantom and a cadaver hand. For the two detector readout modes (1 × 1 full-resolution readout in Fig 4b and 2 × 2 half-resolution readout in Fig 4c), a difference in the minimum resolvable line pair is fairly conspicuous—approximately 17 line pairs per centimeter (lp/cm) for the former and approximately 15 lp/cm for the latter. A corresponding improvement is evident in the zoomed axial images of a cadaver wrist in Figure 4d and 4e, with the full-resolution mode demonstrating a finer level of trabecular detail. The results are consistent with previous quantitative assessment of modulation transfer function (13,14), where the modulation transfer function was predicted and verified to be approximately 0.5 at approximately 15 lp/cm. In the current prototype configuration, the full-resolution readout mode entails a factor of two increase in scanning time (from 20 to 40 seconds) compared with the half-resolution mode.
Figure 4a:

Spatial resolution. (a) Axial view of CatPhan line-pair module. (b, c) Magnified views of phantom for (b) 1 × 1 detector readout (full-resolution, 1536 × 1536-pixel format) and (c) 2 × 2 detector readout (half-resolution binning, 768 × 768-pixel format). In each case, voxel size in cone-beam CT reconstructions was 0.26 mm according to the bone visualization protocol. (d, e) Axial sections of cadaver wrist obtained with same protocols as in b and c, respectively (window width, 850 HU; level, 222 HU).
Figure 4b:

Spatial resolution. (a) Axial view of CatPhan line-pair module. (b, c) Magnified views of phantom for (b) 1 × 1 detector readout (full-resolution, 1536 × 1536-pixel format) and (c) 2 × 2 detector readout (half-resolution binning, 768 × 768-pixel format). In each case, voxel size in cone-beam CT reconstructions was 0.26 mm according to the bone visualization protocol. (d, e) Axial sections of cadaver wrist obtained with same protocols as in b and c, respectively (window width, 850 HU; level, 222 HU).
Figure 4c:

Spatial resolution. (a) Axial view of CatPhan line-pair module. (b, c) Magnified views of phantom for (b) 1 × 1 detector readout (full-resolution, 1536 × 1536-pixel format) and (c) 2 × 2 detector readout (half-resolution binning, 768 × 768-pixel format). In each case, voxel size in cone-beam CT reconstructions was 0.26 mm according to the bone visualization protocol. (d, e) Axial sections of cadaver wrist obtained with same protocols as in b and c, respectively (window width, 850 HU; level, 222 HU).
Figure 4d:

Spatial resolution. (a) Axial view of CatPhan line-pair module. (b, c) Magnified views of phantom for (b) 1 × 1 detector readout (full-resolution, 1536 × 1536-pixel format) and (c) 2 × 2 detector readout (half-resolution binning, 768 × 768-pixel format). In each case, voxel size in cone-beam CT reconstructions was 0.26 mm according to the bone visualization protocol. (d, e) Axial sections of cadaver wrist obtained with same protocols as in b and c, respectively (window width, 850 HU; level, 222 HU).
Figure 4e:

Spatial resolution. (a) Axial view of CatPhan line-pair module. (b, c) Magnified views of phantom for (b) 1 × 1 detector readout (full-resolution, 1536 × 1536-pixel format) and (c) 2 × 2 detector readout (half-resolution binning, 768 × 768-pixel format). In each case, voxel size in cone-beam CT reconstructions was 0.26 mm according to the bone visualization protocol. (d, e) Axial sections of cadaver wrist obtained with same protocols as in b and c, respectively (window width, 850 HU; level, 222 HU).
Human Cadaver Images
Figures 5 and E2 (online) and Figures 6 and E3 (online) show cone-beam CT scans of a cadaveric hand and knee, respectively, with representative soft-tissue and bone visualization imaging task examples. Overall, qualitative assessment of cone-beam CT images of the hand, elbow, knee, and ankle indicated good to excellent visibility of pertinent features (range in ordinal scores, 3–5). Bone tasks—including visualization of the bone cortex and trabeculae—had uniformly excellent visibility (median score, 5). Joints (articular surfaces) demonstrated very good visibility (median score, 4; scores were slightly higher for the knee and elbow [range, 4–5] and lower and/or more variable for the hand and ankle [range, 3–5]). Soft-tissue task performance was classified as good (score, 3) to excellent (score, 5) depending on the extremity, with reduced visibility in the hand and foot (range, 3–4) compared with the knee and elbow (range, 4–5). The challenge to soft-tissue visualization tasks was related to mild-to-moderate artifacts noted as streaks associated with x-ray scatter, beam hardening, and/or cone-beam artifact. Such artifacts mainly arose when the joint planes (cortical bone surfaces) were parallel to the scanning plane and were therefore more evident in structures exhibiting multiple articulations, such as the hand and foot. As shown in Figure 5a, especially at extended distance above or below the central axial plane, cone-beam artifacts arising from cortical bone surfaces parallel to the source plane are evident at a level that could diminish the visibility of adjacent soft tissues. The effect is intrinsic to reconstruction from data acquired from a simple circular orbit. Possible methods to mitigate such effects include purposely positioning the anatomy such that the bone surfaces are at a greater angle from the source plane (ie, orienting the patient or scanner at an angle with respect to the axis of rotation), use of a noncircular source-detector orbit (eg, circle-and-line or saddle-type trajectories), and use of alternative reconstruction methods that may be more robust against the effect. The statistical significance among the observer-based assessment of image quality as well as the analysis of intra- and interreader variability is the subject of an expanded reader study outside the scope of this initial qualitative assessment.
Figure 5a:

Cone-beam CT images of cadaver hand obtained with prototype scanner. (a) Coronal and (b) sagittal sections from soft-tissue and bone reconstructions, respectively. Soft-tissue and bone visibility are demonstrated along with artifacts arising from joint surfaces parallel to the axial scan plane.
Figure 6a:
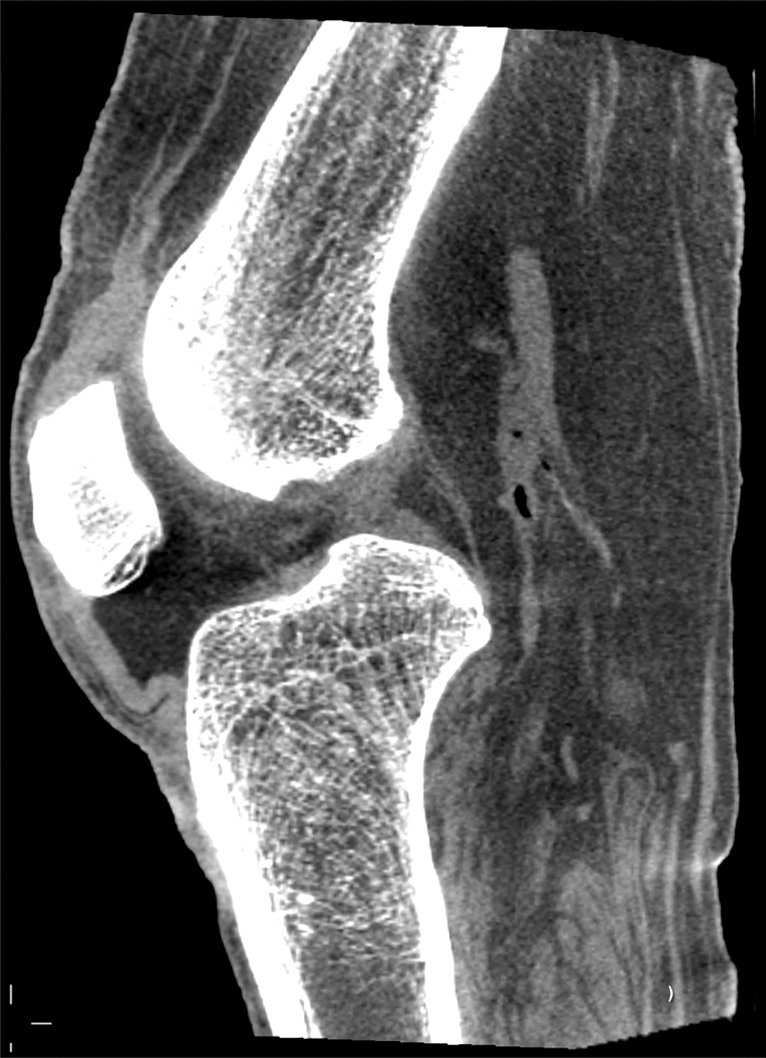
Cone-beam CT images of cadaver knee obtained with prototype scanner. (a) Sagittal and (b) coronal sections from soft-tissue and bone reconstructions, respectively. There is good muscle-fat differentiation in a and excellent visibility of cortical and trabecular architecture in b.
Figure 5b:

Cone-beam CT images of cadaver hand obtained with prototype scanner. (a) Coronal and (b) sagittal sections from soft-tissue and bone reconstructions, respectively. Soft-tissue and bone visibility are demonstrated along with artifacts arising from joint surfaces parallel to the axial scan plane.
Figure 6b:

Cone-beam CT images of cadaver knee obtained with prototype scanner. (a) Sagittal and (b) coronal sections from soft-tissue and bone reconstructions, respectively. There is good muscle-fat differentiation in a and excellent visibility of cortical and trabecular architecture in b.
Discussion
This initial technical and qualitative assessment of imaging performance for a prototype cone-beam CT scanner dedicated to musculoskeletal extremity imaging with weight-bearing capability demonstrates that three-dimensional images exhibiting excellent bone visualization and good (or very good) soft-tissue visualization can be produced at a low radiation dose. The results are consistent with those from previous reports on design and technical aspects from theoretical modeling (14) and benchtop studies (13). The radiation dose (Dcenter, ∼9 mGy) was favorable to that measured for clinical protocols with a multidetector CT scanner (∼27–40 mGy), although we recognize that direct comparison is somewhat complicated by issues of single-extremity versus double-extremity scanning. For example, although the cone-beam CT scanner allows scanning of a single knee (at 9.0 mGy), multidetector CT would typically involve scanning both knees simultaneously (at 27 mGy). It is also worth noting that the methodology and phantom draw from dosimetry standards developed in the context of head and body CT, and appropriate revision of standards to an extremities context (eg, usually a smaller diameter, typified by a large central bone volume surrounded by soft tissue, and explicitly accommodating scenarios for imaging one or both extremities) are a worthwhile area of future work. The presence of artifacts in the studies reported above is to be expected because no artifact corrections were applied, and the images are considered “raw” reconstructions that stand to benefit from correction techniques analogous to those developed for multidetector CT. Some of these artifacts are related to joint geometry and surface orientation relative to the x-ray source; these may be partly ameliorated by modifying joint position in the scanner. These initial results lack statistical power but nonetheless suggest a potential role for dedicated cone-beam CT in the musculoskeletal imaging arsenal that warrants further investigation.
There are several important clinical and economic implications of this device. The clinical implications include the ability to obtain more physiologic information from weight-bearing imaging of the lower extremities. In clinical practice, load-bearing radiography of the lower extremities is advocated for the depiction of malalignment and joint narrowing (19–25). The economic implication is that single-organ, simplified, and “defeatured” devices may be used to decrease costs and provide advanced imaging capability in musculoskeletal medicine specialty practices (26). In addition, new applications may arise as the added value of cross-sectional over projectional imaging is demonstrated while the cost and dose gap are closed. The three-dimensional data from cone-beam CT facilitate more quantitative analysis (27–30), such as segmentation, erosion and/or osteolysis detection, characterization of subchondral bone architecture, and measurement of bone mineral density. There are clinical reports in the literature about another cone-beam CT system commercially available outside the United States (31,32). These initial descriptive articles provide insight into some clinical applications of this technology (eg, wrist arthrography and weight-bearing arthroplasty imaging) but have not as yet quantitatively described technical development or evaluated diagnostic performance.
There are some limitations to cone-beam CT technology in general and of the initial prototype for musculoskeletal imaging. The scanning time on the initial prototype is relatively long (∼20 seconds) compared with that of extremity multidetector CT, raising the potential for motion artifacts in clinical practice. Immobilization with a hand or knee air cast within the gantry is planned for first patient studies. In general, cone-beam CT with a broad volumetric beam exhibits more pronounced x-ray scatter and “cone-beam” artifacts than multidetector CT, which are areas of ongoing development in artifact correction. Cortical bone surfaces oriented parallel to the axial plane in particular exhibited artifacts that limited soft-tissue visibility. In addition, flat-panel detectors typically exhibit higher electronic noise than detectors used in multidetector CT, presenting a challenge to performance at reduced radiation dose and visibility of soft-tissue structures. Although the clinical workflow associated with the system has some advantages in comparison to multidetector CT (most notably the capacity for radiography and fluoroscopy on the same system and the ability to conduct weight-bearing three-dimensional imaging of the lower extremities), it also has limitations, including a more complicated patient setup—for example, positioning within the scanner, operation of the scanner door and/or associated chair, and immobilization. Nonetheless, this device embodies characteristics that could be well suited to a new specialty application of cone-beam CT, and the trade-offs in comparison to general multidetector CT scanners for body imaging may be tolerable within this application-specific context. In a practice setting that includes a sufficient workload in musculoskeletal medicine, such a device could be cost-beneficial in off-loading from traditional multidetector CT scanners while providing additional functional imaging capabilities.
In addition, there are limitations associated with the methodology in the performance evaluation, which focused on methods suited to routine technical assessment. Although dosimetry methods were drawn from existing standards for cone-beam CT dose measurement, such standards are evolving and in some cases are not precisely defined, viz, in relation to the extremities. Evaluation of SDNR in a simple cylindrical phantom provides a basic assessment of large-area transfer characteristics and is among the most basic metrics of imaging performance that may relate to soft-tissue visibility. Evaluation of spatial resolution in a line-pair pattern similarly provides a very basic assessment that is limited to the axial plane (two-dimensional), and characterization may be subjective. Limitations of the cadaver study include a limited number of specimens (one for each anatomic site) and the use of one observer.
In summary, a dedicated extremity cone-beam CT scanner with weight-bearing capability provides sufficient image quality and favorable dose profile to warrant further evaluation for clinical use.
Advance in Knowledge
■ A cone-beam CT scanner dedicated to imaging of the extremities demonstrates contrast resolution and spatial resolution suitable to pertinent imaging tasks in musculoskeletal radiology at a radiation dose less than that of standard multidetector CT and enables imaging of weight-bearing anatomy.
Implication for Patient Care
■ The ability to obtain high-quality, low-dose volumetric CT scans of the extremities with weight-bearing capability may facilitate the acquisition of cross-sectional functional CT data in clinical practice.
APPENDIX
SUPPLEMENTAL FIGURES
Received January 28, 2013; revision requested March 13; revision received June 5; accepted June 19; final version accepted August 27.
Supported by an Academic-Industry partnership with Carestream Health (Rochester, NY).
Funding: This research was supported by the National Institutes of Health (grant 2R01-CA-112163).
Disclosures of Conflicts of Interest: J.A.C. Financial activities related to the present article: institution received a grant from Carestream Health. Financial activities not related to the present article: received money for board membership from GE and Vital; is a paid consultant for BioClinica, Medtronic, Pfizer, Johnson & Johnson, and Best Doctors; has grants/grants pending from Siemens and Toshiba; receives payment for lectures including service on speakers bureaus from Siemens; owns stock/stock options in Merge; receives travel/accommodations/meeting expenses from Siemens and Carestream Health. Other relationships: none to disclose. A.A.M. Financial activities related to the present article: institution received a grant from Carestream Health. Financial activities not related to the present article: none to disclose. Other relationships: none to disclose. W.Z. Financial activities related to the present article: institution received a grant from Carestream Health. Financial activities not related to the present article: none to disclose. Other relationships: none to disclose. G.K.T. No relevant conflicts of interest to disclose. J.W.S. Financial activities related to the present article: institution received a grant from Carestream Health. Financial activities not related to the present article: none to disclose. Other relationships: none to disclose. N.P. Financial activities related to the present article: none to disclose. Financial activities not related to the present article: is employed by Carestream Health. Other relationships: none to disclose. R.S. Financial activities related to the present article: is employed by Carestream Health. Financial activities not related to the present article: none to disclose. Other relationships: none to disclose. D.Y. Financial activities related to the present article: is employed by Carestream Health. Financial activities not related to the present article: none to disclose. Other relationships: none to disclose. D.H.F. Financial activities related to the present article: is employed by Carestream Health. Financial activities not related to the present article: none to disclose. Other relationships: has a patent for an extremity imaging apparatus for cone-beam CT. J.Y. Financial activities related to the present article: is employed by Carestream Health. Financial activities not related to the present article: none to disclose. Other relationships: none to disclose. J.H.S. Financial activities related to the present article: institution received a grant from Carestream Health; institution received support for travel to meetings for the study and other purposes from Carestream Health; institution received fees for participation in review activities such as data monitoring boards, statistical analysis, end point committees, and the like from Carestream; institution received payment for writing or reviewing the manuscript from Carestream. Financial activities not related to the present article: institution has grants/grants pending from Carestream. Other relationships: none to disclose.
Abbreviations:
- CTDI
- CT dose index
- SDNR
- signal difference–to-noise ratio
References
- 1.Fayad LM, Bluemke DA, Fishman EK. Musculoskeletal imaging with computed tomography and magnetic resonance imaging: when is computed tomography the study of choice? Curr Probl Diagn Radiol 2005;34(6):220–237. [DOI] [PubMed] [Google Scholar]
- 2.Horton KM, Sheth S, Corl F, Fishman EK. Multidetector row CT: principles and clinical applications. Crit Rev Computed Tomogr 2002;43(2):143–181. [PubMed] [Google Scholar]
- 3.Choplin RH, Farber JM, Buckwalter KA, Swan S. Three-dimensional volume rendering of the tendons of the ankle and foot. Semin Musculoskelet Radiol 2004;8(2):175–183. [DOI] [PubMed] [Google Scholar]
- 4.Jaffray DA, Siewerdsen JH. Cone-beam computed tomography with a flat-panel imager: initial performance characterization. Med Phys 2000;27(6):1311–1323. [DOI] [PubMed] [Google Scholar]
- 5.Feldkamp LA, Davis LC, Kress JW. Practical cone-beam algorithm. J Opt Soc Am A 1984;1(6):612–619. [Google Scholar]
- 6.Elbakri IA, Fessler JA. Statistical image reconstruction for polyenergetic x-ray computed tomography. IEEE Trans Med Imaging 2002;21(2):89–99. [DOI] [PubMed] [Google Scholar]
- 7.Bian J, Siewerdsen JH, Han X, et al. Evaluation of sparse-view reconstruction from flat-panel-detector cone-beam CT. Phys Med Biol 2010;55(22):6575–6599. [DOI] [PMC free article] [PubMed] [Google Scholar]
- 8.Chen GH, Tang J, Leng S. Prior image constrained compressed sensing (PICCS). Proc Soc Photo Opt Instrum Eng 2008;6856:685618. [DOI] [PMC free article] [PubMed] [Google Scholar]
- 9.Miracle AC, Mukherji SK. Conebeam CT of the head and neck, part 2: clinical applications. AJNR Am J Neuroradiol 2009;30(7):1285–1292. [DOI] [PMC free article] [PubMed] [Google Scholar]
- 10.Boone JM, Nelson TR, Lindfors KK, Seibert JA. Dedicated breast CT: radiation dose and image quality evaluation. Radiology 2001;221(3):657–667. [DOI] [PubMed] [Google Scholar]
- 11.Jaffray DA, Siewerdsen JH, Wong JW, Martinez AA. Flat-panel cone-beam computed tomography for image-guided radiation therapy. Int J Radiat Oncol Biol Phys 2002;53(5):1337–1349. [DOI] [PubMed] [Google Scholar]
- 12.Siewerdsen JH, Moseley DJ, Burch S, et al. Volume CT with a flat-panel detector on a mobile, isocentric C-arm: pre-clinical investigation in guidance of minimally invasive surgery. Med Phys 2005;32(1):241–254. [DOI] [PubMed] [Google Scholar]
- 13.Zbijewski W, De Jean P, Prakash P, et al. A dedicated cone-beam CT system for musculoskeletal extremities imaging: design, optimization, and initial performance characterization. Med Phys 2011;38(8):4700–4713. [DOI] [PMC free article] [PubMed] [Google Scholar]
- 14.Prakash P, Zbijewski W, Gang GJ, et al. Task-based modeling and optimization of a cone-beam CT scanner for musculoskeletal imaging. Med Phys 2011;38(10):5612–5629. [DOI] [PMC free article] [PubMed] [Google Scholar]
- 15.Roos PG, Colbeth RE, Mollov I, et al. Multiple-gain-ranging readout method to extend the dynamic range of amorphous silicon flat-panel imagers. In: Yaffe MJ, Flynn MJ, eds. Proceedings of SPIE: medical imaging 2004—physics of medical imaging. Vol 5368. Bellingham, Wash: International Society for Optical Engineering, 2004; 139–149.
- 16.Xu J, Reh DD, Carey JP, Mahesh M, Siewerdsen JH. Technical assessment of a cone-beam CT scanner for otolaryngology imaging: image quality, dose, and technique protocols. Med Phys 2012;39(8):4932–4942. [DOI] [PubMed] [Google Scholar]
- 17.American Association of Physicists in Medicine. Size specific dose estimates (SSDE) in pediatric and adult CT examinations. Report of AAPM task group 204. AAPM Report no. 204. New York, NY: American Association of Physicists in Medicine, 2011. [Google Scholar]
- 18.Biswas D, Bible JE, Bohan M, Simpson AK, Whang PG, Grauer JN. Radiation exposure from musculoskeletal computerized tomographic scans. J Bone Joint Surg Am 2009;91(8):1882–1889. [DOI] [PubMed] [Google Scholar]
- 19.Wevers HW, Siu DW, Cooke TD. A quantitative method of assessing malalignment and joint space loss of the human knee. J Biomed Eng 1982;4(4):319–324. [DOI] [PubMed] [Google Scholar]
- 20.Lynch JA, Buckland-Wright JC, Macfarlane DG. Precision of joint space width measurement in knee osteoarthritis from digital image analysis of high definition macroradiographs. Osteoarthritis Cartilage 1993;1(4):209–218. [DOI] [PubMed] [Google Scholar]
- 21.Buckland-Wright JC, Macfarlane DG, Lynch JA, Jasani MK, Bradshaw CR. Joint space width measures cartilage thickness in osteoarthritis of the knee: high resolution plain film and double contrast macroradiographic investigation. Ann Rheum Dis 1995;54(4):263–268. [DOI] [PMC free article] [PubMed] [Google Scholar]
- 22.Ravaud P, Chastang C, Auleley GR, et al. Assessment of joint space width in patients with osteoarthritis of the knee: a comparison of 4 measuring instruments. J Rheumatol 1996;23(10):1749–1755. [PubMed] [Google Scholar]
- 23.Messner K, Fahlgren A, Persliden J, Andersson BM. Radiographic joint space narrowing and histologic changes in a rabbit meniscectomy model of early knee osteoarthrosis. Am J Sports Med 2001;29(2):151–160. [DOI] [PubMed] [Google Scholar]
- 24.Wolfe F, Lane NE, Buckland-Wright C. Radiographic methods in knee osteoarthritis: a further comparison of semiflexed (MTP), schuss-tunnel, and weight-bearing anteroposterior views for joint space narrowing and osteophytes. J Rheumatol 2002;29(12):2597–2601. [PubMed] [Google Scholar]
- 25.Mazzuca SA, Brandt KD, Lane KA, Katz BP. Knee pain reduces joint space width in conventional standing anteroposterior radiographs of osteoarthritic knees. Arthritis Rheum 2002;46(5):1223–1227. [DOI] [PubMed] [Google Scholar]
- 26.Thrall JH. Utilization of imaging: challenges and opportunities. J Am Coll Radiol 2009;6(5):287–288. [DOI] [PubMed] [Google Scholar]
- 27.Adams JE. Quantitative computed tomography. Eur J Radiol 2009;71(3):415–424. [DOI] [PubMed] [Google Scholar]
- 28.Engelke K, Libanati C, Liu Y, et al. Quantitative computed tomography (QCT) of the forearm using general purpose spiral whole-body CT scanners: accuracy, precision and comparison with dual-energy x-ray absorptiometry (DXA). Bone 2009;45(1):110–118. [DOI] [PubMed] [Google Scholar]
- 29.Sehmisch S, Dullin C, Zaroban A, et al. The use of flat panel volumetric computed tomography (fpVCT) in osteoporosis research. Acad Radiol 2009;16(4):394–400. [DOI] [PubMed] [Google Scholar]
- 30.Kallioniemi AS, Jurvelin JS, Nieminen MT, Lammi MJ, Töyräs J. Contrast agent enhanced pQCT of articular cartilage. Phys Med Biol 2007;52(4):1209–1219. [DOI] [PubMed] [Google Scholar]
- 31.Koskinen SK, Haapamäki VV, Salo J, et al. CT arthrography of the wrist using a novel, mobile, dedicated extremity cone-beam CT (CBCT). Skeletal Radiol 2013;42(5):649–657. [DOI] [PubMed] [Google Scholar]
- 32.Tuominen EK, Kankare J, Koskinen SK, Mattila KT. Weight-bearing CT imaging of the lower extremity. AJR Am J Roentgenol 2013;200(1):146–148. [DOI] [PubMed] [Google Scholar]
Associated Data
This section collects any data citations, data availability statements, or supplementary materials included in this article.