

Intraprocedural tumor perfusion reduction may be associated with transplant-free survival in patients with unresectable hepatocellular carcinoma who are undergoing chemoembolization.
Abstract
Purpose
To investigate the predictive value of transcatheter intraarterial perfusion (TRIP) magnetic resonance (MR) imaging–measured tumor perfusion changes during transarterial chemoembolization on transplant-free survival (TFS) in patients with unresectable hepatocellular carcinoma (HCC).
Materials and Methods
This HIPAA-compliant prospective study was approved by the institutional review board. Written informed consent was obtained from all patients. Fifty-one consecutive adult patients with surgically unresectable single or multifocal measurable HCC and adequate laboratory parameters who underwent chemoembolization in a combined MR imaging–interventional radiology suite between February 2006 and June 2010 were studied. Tumor perfusion changes during chemoembolization were measured by using TRIP MR imaging with area under the time–signal intensity curve calculation. The end point of the study was TFS. The authors assessed the correlation between the percentage perfusion reduction in the tumor during chemoembolization and TFS by using univariate and multivariate analyses.
Results
Fifty patients (mean age, 61 years; 39 men aged 42–87 years [mean age, 61 years] and 11 women aged 49–83 years [mean age, 62 years]) were eligible for the analysis. Patients with 35%–85% intraprocedural tumor area under the time–signal intensity curve reduction (n = 32) showed significantly improved median TFS compared with patients with an area under the time–signal intensity curve reduction outside this range (n = 18) (16.6 months [95% confidence interval: 11.2, 22.0 months] vs 9.3 months [95% confidence interval: 6.6, 12.0 months], respectively; P = .046; hazard ratio: 0.46; 95% confidence interval: 0.21, 1.00). The cumulative TFS rates in the 35%–85% and less than 35% or more than 85% perfusion reduction groups at 1, 2, and 5 years after chemoembolization were 66.4%, 42.2%, and 28.2% versus 33.8%, 16.9%, and 0%, respectively.
Conclusion
The study shows evidence of an association between intraprocedural tumor perfusion reduction during chemoembolization and TFS and suggests the utility of TRIP MR imaging– measured tumor perfusion reduction as an intraprocedural imaging biomarker during chemoembolization.
© RSNA, 2014
Hepatocellular carcinoma (HCC) is the most common primary hepatic malignancy and the third leading cause of cancer-related death worldwide (1–4). Although thermal ablation, surgical resection, and orthotopic liver transplantation represent curative treatments for HCC, only 15% of patients with HCC are candidates for definitive therapy because of advanced multifocal intrahepatic disease, poor hepatic reserve, extrahepatic tumor spread, and/or scarcity of donor organs (5,6). Local-regional therapies, including transarterial chemoembolization and yttrium 90 (90Y) radioembolization, have promising roles in the management of HCC (7,8). In two randomized controlled trials, chemoembolization demonstrated improvement in survival in selected patients with intermediate-stage HCC (9,10).
Radiologic imaging, especially contrast material–enhanced computed tomography (CT) and magnetic resonance (MR) imaging, plays an important role in the diagnosis of HCC and in the assessment of treatment response. Objective imaging response guidelines, such as World Health Organization criteria, Response Evaluation Criteria in Solid Tumors, modified Response Evaluation Criteria in Solid Tumors, and tumor necrosis criteria, are methods to assess HCC response after local-regional therapies (11–15). Potential functional imaging biomarkers (eg, dynamic contrast-enhanced perfusion CT or MR imaging and diffusion MR imaging) enable assessment of vascular and cellular changes suggestive of early tumor response after transarterial local-regional therapies (16–18). Intraprocedural imaging biomarkers predictive of survival during transarterial local-regional therapies could potentially further enhance the benefits of these interventions in patients with unresectable HCC, as intraprocedural prognostic factors could be used to guide the selection of optimal therapeutic end points at the time of treatment.
Intraprocedural MR imaging allows assessment of tumor functional status during transarterial local-regional therapies (19). Transcatheter intraarterial perfusion (TRIP) MR imaging, which employs catheter-directed intraarterial injections of contrast material, can be applied to monitor tumor perfusion changes during chemoembolization (20–23) and to model the biodistribution of chemoembolic material before delivery (24,25). Recent clinical studies have suggested that chemoembolization end points can affect treatment outcome (26) and have indicated that intraprocedural perfusion changes measured with TRIP MR imaging can help predict tumor necrosis imaging response after chemoembolization (27). In our study, we aimed to investigate the predictive value of TRIP MR imaging–measured tumor perfusion changes during transarterial chemoembolization on transplant-free survival (TFS) in patients with unresectable HCC.
Materials and Methods
Patients
This prospective study was approved by our institutional review board and compliant with the Health Insurance Portability and Accountability Act. All patients provided written informed consent before study participation. Between February 2006 and June 2010, 51 consecutive patients with surgically unresectable HCC who underwent combined MR imaging– and digital subtraction angiography (DSA)–monitored chemoembolization at our single institution were prospectively enrolled in this study. Inclusion criteria included patient age of at least 18 years, surgically unresectable HCC, single or multifocal measurable HCC, Eastern Cooperative Oncology Group (ECOG) performance status of 2 or less, Child-Pugh class A or B liver disease, less than 50% overall liver tumor burden, total bilirubin level of less than 4.0 mg/dL, serum creatinine level of less than 2.0 mg/dL, international normalized ratio of 1.5 or less, platelet count of more than 50 000/µL, ability to maintain adequate breath hold (30 seconds), life expectancy of more than 6 months, and no contraindications to MR imaging. Patients with portal vein thrombosis were included if superselective segmental chemoembolization was technically feasible. Diagnostic criteria for HCC included percutaneous liver biopsy or characteristic radiologic evidence of HCC as defined by using accepted guidelines (28). Surgical unresectability was determined by consensus at multidisciplinary tumor board that included an attending transplant surgeon.
Transarterial Chemoembolization
Chemoembolization was monitored in a combined MR imaging and DSA interventional radiology suite (Miyabi; Siemens Healthcare, Erlangen, Germany). Chemoembolization procedures were performed by one Certificate of Added Qualification–licensed interventional radiologist with more than 10 years of clinical experience (R.A.O.). Patients were transferred between the angiography and MR imaging units according to an institutional safe transfer protocol. MR perfusion imaging was performed before and after chemotherapy injection. Chemoembolization was performed under DSA guidance by using triple chemotherapy mixture (100 mg of cisplatin, 30 mg of mitomycin C, and 30 mg of doxorubicin) with iodized oil (Ethiodol; Savage Laboratories, Melville, NY) and was followed by delivery of embolic microspheres (Embosphere; Biosphere Medical, Rockland, Mass), a frequently used chemoembolization method in the United States (13,29). Procedural details of combined MR imaging– and DSA-monitored chemoembolization have been previously described (21,22).
Intraprocedural MR Imaging
Intraprocedural MR imaging was performed by using a body array coil with a 1.5-T clinical MR unit (Magnetom Espree, Siemens Healthcare). Axial and coronal T1-weighted spoiled gradient-echo and T2-weighted turbo spin-echo images were obtained after each patient transfer to localize consistent optimal section positions for serial subsequent TRIP MR imaging.
Intraprocedural three- or four-dimensional TRIP MR imaging was performed in axial orientations with full spatial coverage of the targeted liver segments. Three-dimensional TRIP MR imaging with a dynamic two-dimensional saturation-recovery gradient-echo sequence (21) was performed with the following parameters: 2.4/1.2/90 (repetition time msec/echo time msec/inversion time msec), 8-mm-thick sections, and 10–14 sections. Four-dimensional TRIP MR imaging with a dynamic three-dimensional gradient-echo sequence (22,23) was performed with the following parameters: 4.0/1.7 (repetition time msec/echo time msec), 5-mm-thick sections, and 24–28 partitions. Other common parameters were as follows: 15° flip angle, 192 × 128 matrix, 380–450-mm field of view, and generalized autocalibrating partially parallel factor of 2. These imaging parameters were chosen to provide a relatively linear relationship between signal intensity and tissue contrast material concentration and rapid acquisition of T1-weighted images (19). Five seconds after each dynamic TRIP MR imaging examination, a gadopentetate dimeglumine solution (Magnevist; Berlex, Montville, NJ) was injected by hand through the catheter inside the hepatic artery. Ten milliliters of the 20% gadopentetate dimeglumine solution was injected at 2 mL for lobar hepatic artery injections, and 5 mL/sec of 20% gadolinium solution was injected at 1 mL/sec for segmental hepatic artery injections. Dynamic images were repeatedly acquired for 32–35 seconds with a 2.1–2.5-second sampling rate. Patients were asked to hold their breath during first-pass TRIP MR imaging to minimize respiratory motion.
An identical TRIP MR imaging protocol with the same contrast material injection rate was used before and after chemoembolization in each patient for consistency.
MR Imaging Perfusion Data Analysis
TRIP MR images were exported to a Siemens workstation for perfusion analysis. The investigator who performed perfusion analysis was blinded to survival outcomes. Image analysis was performed by a certified radiologist or biomedical engineers with more than 5 years of experience in MR imaging (R.C.G., D.W., and A.C.L.). On the basis of intraprocedural anatomic images and previous diagnostic findings, we selected TRIP MR imaging section positions at the center of each tumor. An entire tumor region of interest within this central section was drawn by consensus of two observers under the guidance of the attending interventional radiologist who performed all chemoembolization procedures in this study. The average time–signal intensity curves of the regions of interest for the TRIP MR image series were generated. We then determined the optimal postinjection interval by accessing each prechemoembolization TRIP MR imaging series and performing area under the time–signal intensity curve semiquantitative perfusion measurements (21,27). The signal integration interval was chosen to start at the initiation of signal enhancement and end just beyond peak signal enhancement. To maintain consistency, identical time intervals were used for pre- and postchemoembolization TRIP MR imaging when calculating the area under the time–signal intensity curve. The change in tumor perfusion after chemoembolization was calculated as the percentage reduction from preprocedural values. For multiple tumors treated within the same chemoembolization session, size-weighted average percentage perfusion reduction—defined as Σ(tumor area × percentage perfusion reduction)/Σ(tumor area), where Σ represents the sum over all treated tumors—was calculated.
Outcome Measures and Statistical Analysis
After chemoembolization, patients were followed up clinically for toxicities and adverse events, which were graded according to the National Cancer Institute’s Common Terminology Criteria for Adverse Events, version 4.0. Toxicities were recorded at any time during follow-up but were censored to curative treatment (transplantation). Toxicity was recorded only if the grade increased from baseline. Disease response was monitored with contrast-enhanced cross-sectional imaging (CT or MR imaging) 1 month after chemoembolization and then at 3-month intervals thereafter.
The end point of this study was TFS, which was defined as the survival time from study enrollment censored at liver transplantation. Patients underwent liver transplantation within the usual guidelines of the United Network for Organ Sharing (UNOS), including HCC within Milan criteria (30) with stratification for organ allocation based on calculated Model for End Stage Liver Disease score with tumor exception points; tumor downstaging was allowed. Not all patients were listed for liver transplantation, as some were beyond UNOS transplant criteria. All survival analyses were calculated from the date of combined DSA- and MR imaging–monitored chemoembolization session that provided successful measurement of intraprocedural tumor perfusion changes. The survival status was determined by the U.S. Social Security Death Index database. Study follow-up was closed on December 31, 2012.
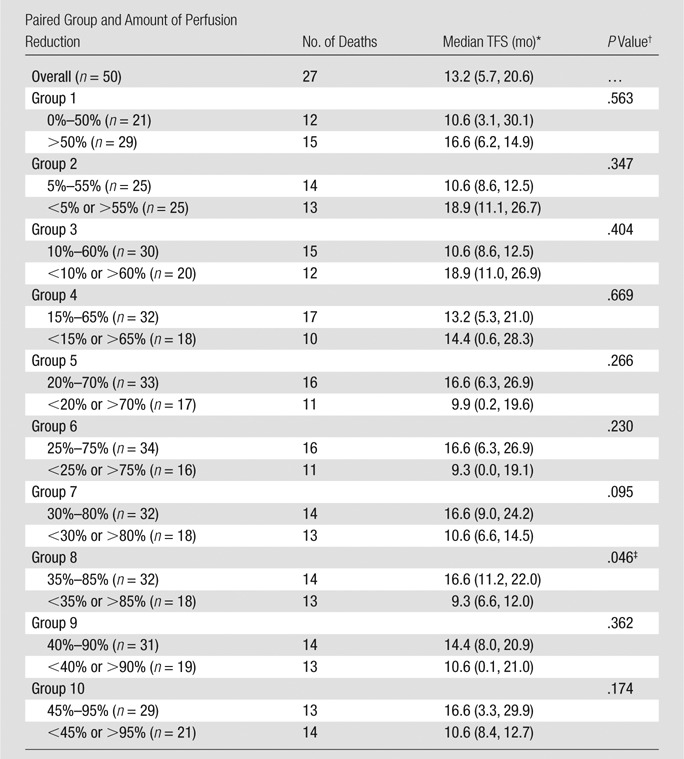
Exploratory analyses were initially performed to identify how intraprocedural tumor perfusion reduction affects TFS. For these analyses, we performed multiple paired survival analyses after categorizing patients into two groups on the basis of percentage perfusion reduction. Categorization was performed by using 5% incremental change in the area under the time–signal intensity curve reduction, as follows: 0%–50%, 5%–55%, 10%–60%, 15%–65%, 20%–70%, 25%–75%, 30%–80%, 35%–85%, 40%–90%, and 45%–95%. Ten pair groups were formed. The median TFS for each paired group was calculated and compared by using the Kaplan-Meier method with the log-rank test. We identified the classification that generated a statistically significant difference in median TFS between pair groups. This identified categorization method was subsequently applied for further analysis.
The cumulative survival rates for the identified perfusion reduction classification groups were calculated by using the Kaplan-Meier method. Comparison of the pretreatment patient demographic and disease characteristics between the two groups was performed with the t test for continuous variables and the Fisher exact test or χ2 test for categoric variables. The rate of orthotopic liver transplantation after chemoembolization between the two groups was also compared.
Univariate and multivariate analyses were conducted to identify factors associated with TFS. Univariate analysis was performed by using the Kaplan-Meier method with the log-rank test to compare survival. Multivariate analysis was performed by using the stepwise forward Cox proportional hazards regression. Hazard ratios were calculated by using univariate and multivariate Cox proportional hazards models. Only variables that demonstrated significance in the univariate analysis entered the multivariate model. Patient age, sex, tumor distribution, tumor size, Child-Pugh class, baseline serum α-fetoprotein level, ECOG performance status, Okuda stage, American Joint Committee on Cancer stage, Cancer of the Liver Italian Program (CLIP) score, UNOS stage, and intraprocedural area under the time–signal intensity curve reduction were included as independent variables for analysis. Child-Pugh class and baseline α-fetoprotein level would not enter the multivariate analysis if the CLIP score was selected into the multivariate model, as these metrics are captured within the CLIP score. Tumor distribution and size would not be included in multivariate analysis if the American Joint Committee on Cancer stage entered multivariate analysis, because they were covered by means of American Joint Committee on Cancer staging. Statistical analyses were performed with software (version 17; SPSS, Chicago Ill). All P values were two sided, and P < .05 was considered indicative of a statistically significant difference.
Results
Patient Cohort
Of the 51 patients who were recruited for combined MR imaging– and DSA-monitored chemoembolization, 50 were eligible for the present analysis. The one patient excluded from analysis did not undergo postprocedural TRIP MR imaging after chemoembolization owing to catheter kinking, which precluded the ability to inject contrast agent. Baseline patient demographics of the 50 patients are summarized in Table 1. Of the 50 patients, 39 (78%) were men. The median patient age was 58 years (range, 42–87 years).
Table 1.
Summary of Baseline Patient Characteristics
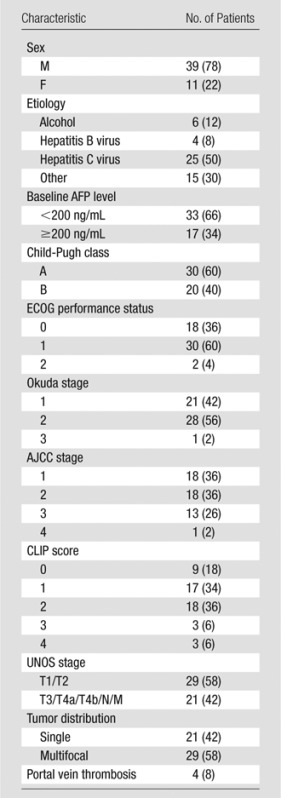
Note.—Numbers in parentheses are percentages. The median patient age was 58 years (range, 42–87 years), and the median size of the largest lesion was 3.8 cm (range, 1.4–16.3 cm). AFP = α-fetoprotein, AJCC = American Joint Committee on Cancer.
Perfusion Reduction and Chemoembolization Outcomes
Mean pre- and postchemoembolization areas under the time–signal intensity curve were 300 and 150 arbitrary units, respectively. The mean reduction in tumor perfusion induced by chemoembolization was 50.0% (range, 0%–96.6%). The 25th, 50th, and 75th percentiles of intraprocedural perfusion percentage reduction were 31.5%, 51.1%, and 68.1%, respectively.
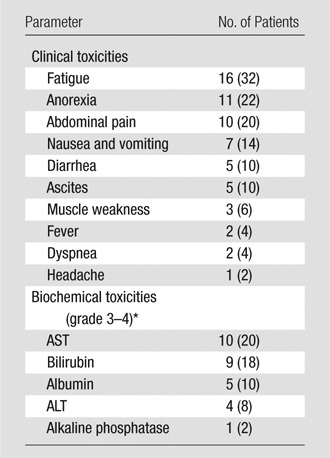
Postchemoembolization clinical and laboratory toxicities are listed in Table 2. The most common findings after treatment included fatigue (16 of 50 patients, 32%), anorexia (11 of 50 patients, 22%), and abdominal pain (10 of 50 patients, 20%). Grade 3–4 bilirubin toxicity was noted in nine of the 50 patients (18%). Fifteen of the 50 patients underwent repeat transarterial chemoembolization for treatment of residual tumor in the same or contralateral liver lobe, recurrent tumor at a previously treated site, or newly developed tumor.
Table 2.
Clinical and Laboratory Toxicities
Note.—Numbers in parentheses are percentages.
ALT = alanine aminotransferase, AST = aspartate aminotransferase.
Exploratory Analyses for TFS
At the time of analysis, 27 of the 50 patients had died. The median TFS was 13.2 months (95% confidence interval: 5.7, 20.6 months). The proportions of survival at 1, 2, and 5 years after chemoembolization were 53.4%, 32.0%, and 16%, respectively. Table 3 shows the median TFS in different pair groups classified according to intraprocedural area under the time–signal intensity curve reduction. From paired groups 6–9, there indicates a trend that intermediate to upper level percentage tumor perfusion reduction yields better median TFS than very small (eg, <25%) or very large (eg, >90%) perfusion reduction. The 35%–85% classification (paired group 8) generated a statistically significant difference in median TFS between patient groups (P = .046) (Table 3).
Table 3.
Exploratory Analyses for TFS
Note.—Data were obtained with Kaplan-Meier analysis.
Numbers in parentheses are 95% confidence intervals.
Determined with the log-rank test.
Statistically significant difference in median TFS between patient groups.
Association between Intraprocedural Tumor Perfusion Reduction and TFS
The difference in median TFS between patient groups classified according to 35%–85% perfusion reduction was statistically significant (P = .046). For the 32 patients with 35%–85% perfusion reduction during chemoembolization, the median survival was 16.6 months (95% confidence interval: 11.2, 22.0 months) (Fig 1), and the survival rates at 1, 2, and 5 years after chemoembolization were 66.4%, 42.2%, and 28.2%, respectively. In comparison, for the remaining 18 patients, the median survival was 9.3 months (95% confidence interval: 6.6, 12.0 months) (Fig 2), and the survival rates at 1, 2, and 5 years after chemoembolization were 33.8%, 16.9%, and 0%, respectively. Furthermore, there were no significant differences between the two groups with regard to baseline patient characteristics (Table 4), and there was no statistically significant difference in the rate of repeat chemoembolization in the 35%–85% perfusion reduction group (11 of 32 patients) versus the less than 35% and more than 85% perfusion reduction group (four of 15 patients) (P = .523). Of note, further subset analysis of the less than 35% and more than 85% perfusion reduction categories into individual groups was limited by small sample sizes (11 patients in the <35% group and seven in the >85% group).
Figure 1a:
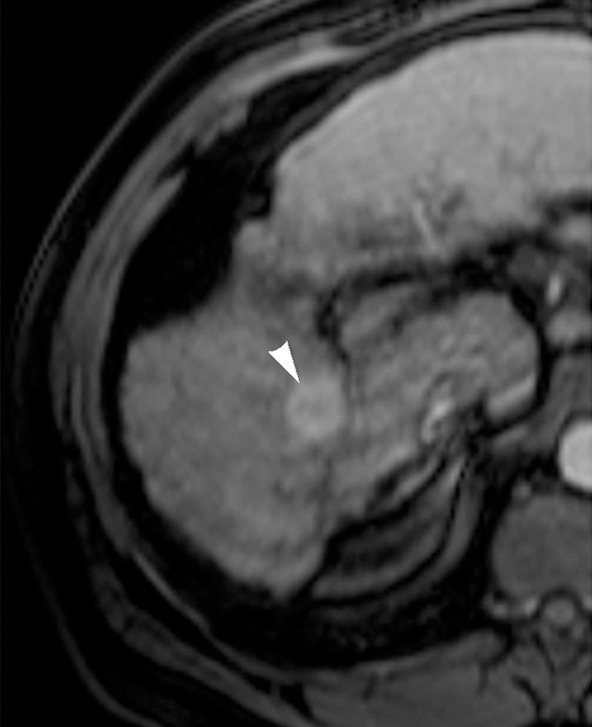
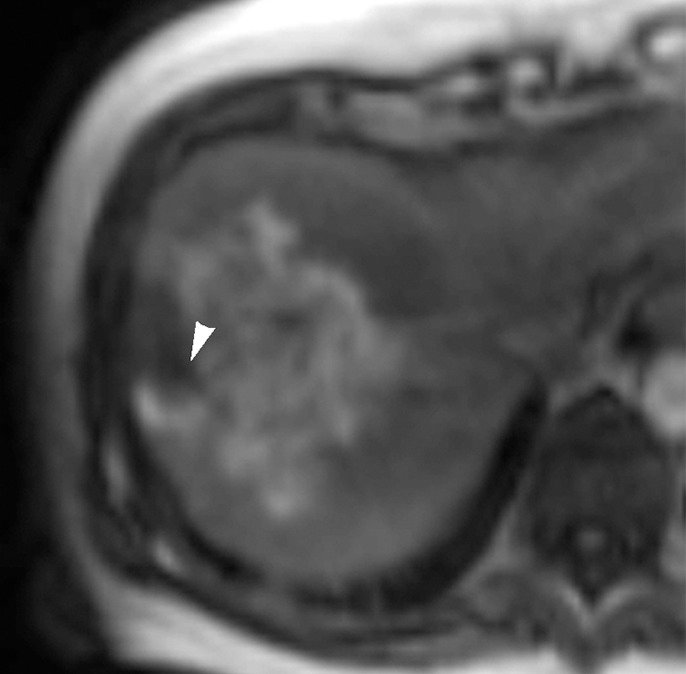
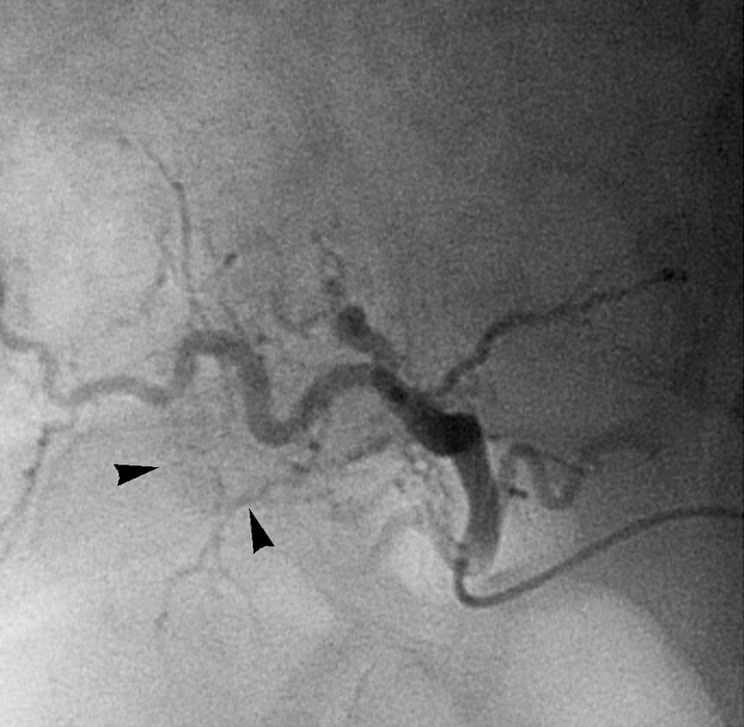
Images in 65-year-old man with focal HCC (arrowhead). (a) Postcontrast arterial phase T1-weighted MR image shows 2.2-cm tumor. (b) Segmental chemoembolization of hypervascular mass was subsequently performed. (c) Pre- and (d) postchemoembolization TRIP MR images demonstrate marked tumor perfusion reduction, which was calculated to be 69%. Clinical follow-up revealed 22.7-month TFS.
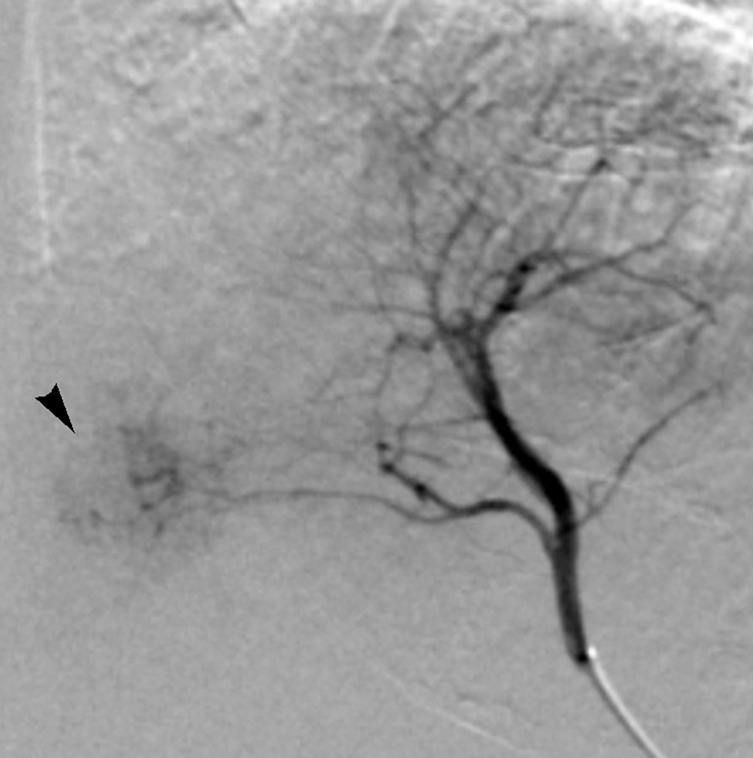
Figure 2a:
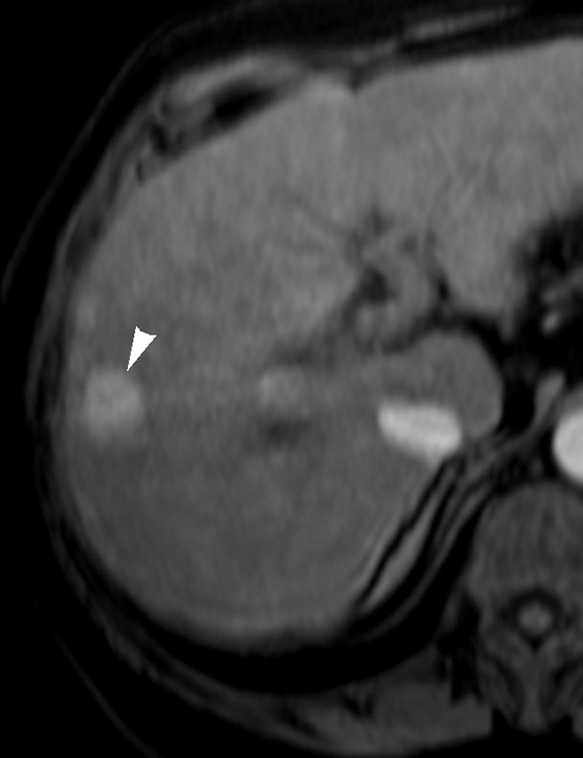
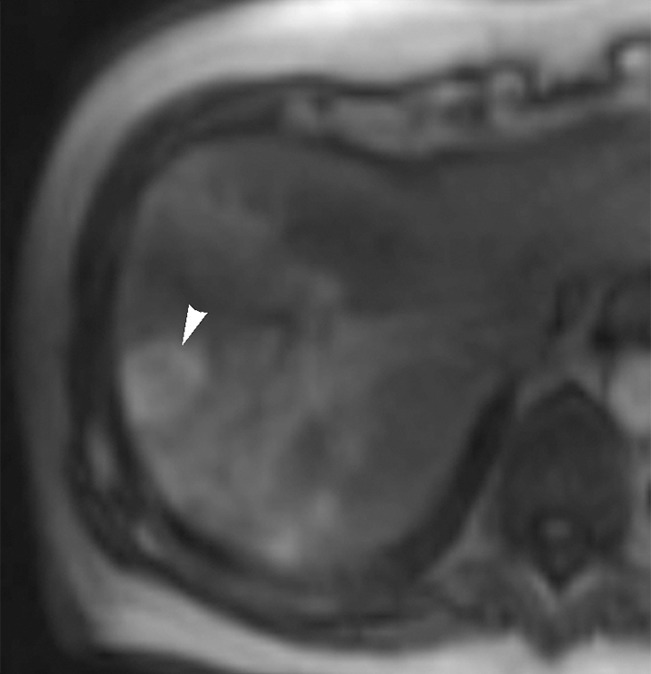
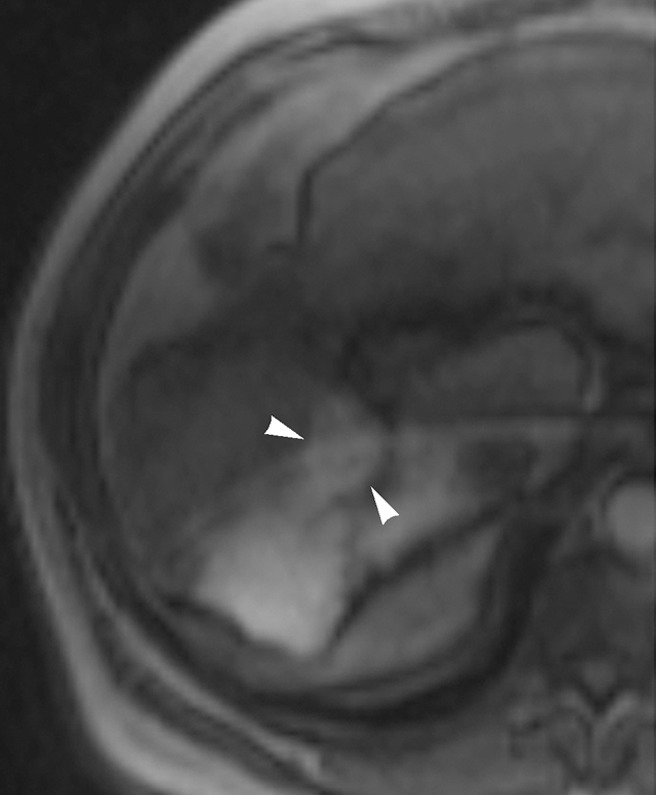
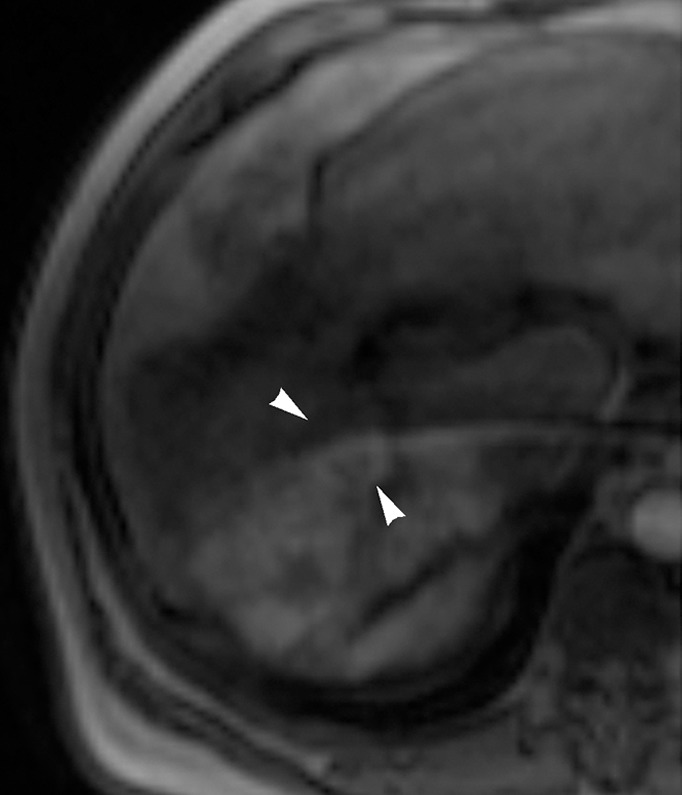
Images in 54-year-old man with nodular HCC (arrowheads). (a) Postcontrast arterial phase T1-weighted MR image depicts 2.4-cm enhancing mass. (b) Chemoembolization of tumor was consequently performed. (c) Pre- and (d) postchemoembolization TRIP MR images display limited tumor perfusion reduction, which was calculated to be 31%. Clinical follow-up demonstrated 5.9-month TFS.
Table 4.
Patient Characteristics according to Perfusion Reduction Group
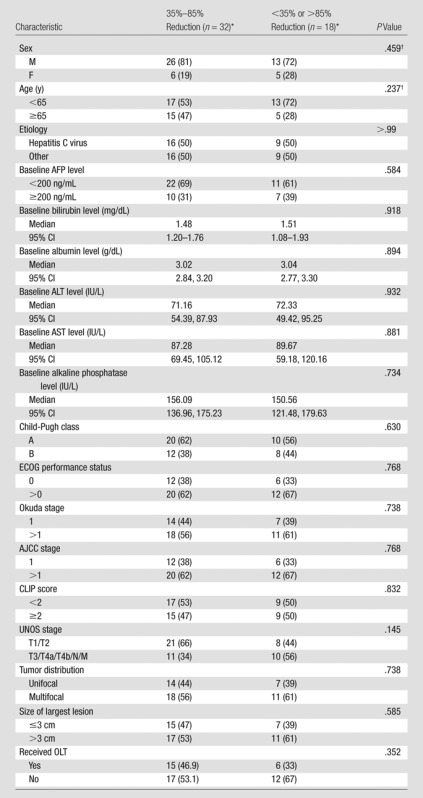
Note.—AFP = α-fetoprotein, AJCC = American Joint Committee on Cancer, ALT = alanine aminotransferase, AST = aspartate aminotransferase, CI = confidence interval, OLT = orthotopic liver transplantation.
Except where indicated, data are numbers of patients, with percentages in parentheses.
Determined with the Fisher exact test.
Figure 1b:
Images in 65-year-old man with focal HCC (arrowhead). (a) Postcontrast arterial phase T1-weighted MR image shows 2.2-cm tumor. (b) Segmental chemoembolization of hypervascular mass was subsequently performed. (c) Pre- and (d) postchemoembolization TRIP MR images demonstrate marked tumor perfusion reduction, which was calculated to be 69%. Clinical follow-up revealed 22.7-month TFS.
Figure 1c:
Images in 65-year-old man with focal HCC (arrowhead). (a) Postcontrast arterial phase T1-weighted MR image shows 2.2-cm tumor. (b) Segmental chemoembolization of hypervascular mass was subsequently performed. (c) Pre- and (d) postchemoembolization TRIP MR images demonstrate marked tumor perfusion reduction, which was calculated to be 69%. Clinical follow-up revealed 22.7-month TFS.
Figure 1d:
Images in 65-year-old man with focal HCC (arrowhead). (a) Postcontrast arterial phase T1-weighted MR image shows 2.2-cm tumor. (b) Segmental chemoembolization of hypervascular mass was subsequently performed. (c) Pre- and (d) postchemoembolization TRIP MR images demonstrate marked tumor perfusion reduction, which was calculated to be 69%. Clinical follow-up revealed 22.7-month TFS.
Figure 2b:
Images in 54-year-old man with nodular HCC (arrowheads). (a) Postcontrast arterial phase T1-weighted MR image depicts 2.4-cm enhancing mass. (b) Chemoembolization of tumor was consequently performed. (c) Pre- and (d) postchemoembolization TRIP MR images display limited tumor perfusion reduction, which was calculated to be 31%. Clinical follow-up demonstrated 5.9-month TFS.
Figure 2c:
Images in 54-year-old man with nodular HCC (arrowheads). (a) Postcontrast arterial phase T1-weighted MR image depicts 2.4-cm enhancing mass. (b) Chemoembolization of tumor was consequently performed. (c) Pre- and (d) postchemoembolization TRIP MR images display limited tumor perfusion reduction, which was calculated to be 31%. Clinical follow-up demonstrated 5.9-month TFS.
Figure 2d:
Images in 54-year-old man with nodular HCC (arrowheads). (a) Postcontrast arterial phase T1-weighted MR image depicts 2.4-cm enhancing mass. (b) Chemoembolization of tumor was consequently performed. (c) Pre- and (d) postchemoembolization TRIP MR images display limited tumor perfusion reduction, which was calculated to be 31%. Clinical follow-up demonstrated 5.9-month TFS.
Univariate and Multivariate Analyses
Table 5 presents the results of univariate and multivariate analyses. Univariate analysis indicated that tumor distribution (solitary vs multifocal, P = .057), CLIP score (<2 vs ≥2, P ≤ .001), Child-Pugh class (A vs B, P = .002), and intraprocedural tumor area under the time–signal intensity curve reduction (35%–85% vs <35% or >85%, P = .046) had significant effects on TFS. CLIP score was confirmed to be a significant prognostic factor for mortality at multivariate analysis (hazard ratio: 0.27; 95% confidence interval: 0.10, 0.76; P = .013). Figure 3 illustrates the survival distribution function by intraprocedural tumor perfusion reduction (35%–85% vs <35% or >85%).
Table 5.
Prognostic Factors Associated with TFS
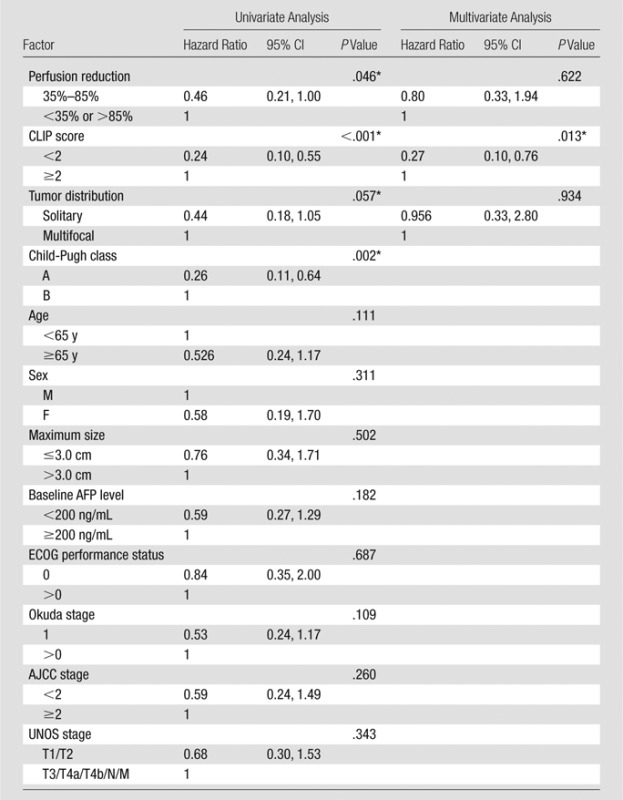
Note.—AFP = α-fetoprotein, AJCC = American Joint Committee on Cancer, CI = confidence interval.
Statistically significant.
Figure 3:

Graph shows TFS of HCC patients with 35%–85% and less than 35% or more than 85% tumor perfusion reduction during chemoembolization.
Discussion
The promising roles established by transarterial local-regional therapies in the management of HCC oblige standardization in the procedural method and demand evidence of clinical benefit (31). To serve as effective biomarkers of response after therapy, conventional anatomic and newer functional imaging should correlate with clinical outcome (31). Meanwhile, imaging biomarkers applied during imaging-guided local-regional therapies could be used to target end points associated with improved treatment outcomes. In our study, we sought to understand the relationship between intraprocedural perfusion reduction during chemoembolization and TFS and to determine the utility of intraprocedural MR imaging–measured tumor perfusion reduction as an imaging biomarker for TFS in patients with unresectable HCC after chemoembolization.
We found that patient groups classified according to 35%–85% intraprocedural tumor area under the time–signal intensity curve reduction criteria demonstrated a substantial difference in median TFS after chemoembolization. The TFS rate at 5 years after chemoembolization of patients with 35%–85% reduction was strikingly higher than that of patients with less than 35% or more than 85% reduction (28.2% vs 0%, respectively). These findings concur with recent data indicating that intermediate to upper level reduction in tumor perfusion during chemoembolization improves tumor necrosis imaging response (27). In our study cohort, intraprocedural tumor perfusion reduction with 35%–85% classification showed a significant univariate association with TFS.
Potential explanations as to why 35%–85% tumor perfusion reduction during lobar or segmental chemoembolization improved TFS over other reduction levels lie in the mechanism of action of this therapy and its consequences on treated tissue. Chemoembolization delivers a combination of chemotherapy and embolic materials by means of hepatic arterial infusion. The purposes of embolization are to (a) reduce blood supply to tumors, thereby inducing regional tissue ischemia and tumor necrosis, and (b) retain chemotherapy at increased local concentrations (32,33). On this basis, underembolization with less than 35% perfusion reduction may result in insufficient ischemic effect and poor chemotherapy retention, which undermine the intended efficacy of chemoembolization. Conversely, excessive ischemic effect may theoretically lead to unwanted localized hypoxia and secondary induction of intratumoral vascular endothelial growth factor overexpression (34,35). Vascular endothelial growth factor drives cancer angiogenesis and endothelial cell proliferation and appears to affect the prognosis of patients with HCC (36). In this manner, overembolization during chemoembolization with more than 85% elimination of forward arterial blood flow may lead to tumor recurrence and treatment failure. Thus, a 35%–85% perfusion reduction may achieve appropriate degrees of tumor devascularization and chemotherapy retention (32) while subduing potential complications caused by overembolization, such as hypoxia-driven tumor angiogenesis, arterial occlusion, and accelerated liver failure (37,38). These advantages may translate into survival benefit. It should be noted that the subjective angiographic chemoembolization end point rating scale has been shown to correlate with objectively measured intraprocedural perfusion reductions obtained with TRIP MR imaging during chemoembolization and may be used to avoid an excessive ischemic effect during tumor transarterial embolotherapy procedures (39), particularly given the fact that intraprocedural TRIP MR imaging adds procedure time and cost and is limited because most interventional radiologists do not have access to a combined MR imaging–interventional radiology suite. Future correlation of intraprocedural TRIP MR imaging parameters with C-arm CT measurements may also expand utility of quantitative intraprocedural tumor perfusion monitoring to more interventional radiology operators.
Although our data confirmed different survival outcomes on the basis of hepatic functional reserve as measured with Child-Pugh score (P = .002), we found no significant TFS difference between patients with an ECOG performance status of 0 or greater than 0 (P = .687) and those with a baseline serum α-fetoprotein level of less than 200 ng/dL and at least 200 ng/dL (P = .182)—factors known to be associated with survival. This may be due to the limited sample size. In comparison, we were able to identify tumor perfusion reduction by using 35%–85% classification during chemoembolization as a promising prognosticator for TFS in univariate analysis (P = .046) by using the same study cohort. This suggests that intraprocedural area under the time–signal intensity curve reduction may be relatively more statistically powerful in predicting survival.
Our results advocate the use of TRIP MR imaging–measured tumor perfusion reduction as an intraprocedural imaging biomarker for survival. This may facilitate further standardization of the chemoembolization technique on the basis of measurable intraprocedural functional end points. As our data suggest, the variation in perfusion reduction during chemoembolization can greatly impact its efficacy. Optimization of intraprocedural perfusion reduction end points of chemoembolization may be necessary. In addition, although our results are derived from iodized oil chemoembolization, the findings herein might be applicable to other transarterial therapies associated with ischemia-driven hypoxia, including bland embolization, chemoembolization with drug-eluting beads, and perhaps 90Y radioembolization.
Our study had several limitations. First, our semiquantitative TRIP MR imaging technique provided only relative changes rather than absolute measurements in tumor perfusion after chemoembolization. Future studies should investigate the relationship between absolute tumor perfusion values and clinical outcomes by using quantitative TRIP MR imaging approaches (23,40). Second, an optimal, more refined intraprocedural perfusion reduction interval that is narrower than the proposed 35%–85% range remains undetermined. A larger sample size will be required to define such optimal perfusion reduction. Third, the study sample was somewhat heterogeneous in tumor and liver disease characteristics, and the angiographic end points of chemoembolization, which ranged from substasis to stasis at the discretion of the attending interventional radiology operator, may be viewed as arbitrary. Fourth, our study includes patients who underwent lobar or segmental chemoembolization for primary liver cancer, and the results may therefore not necessarily be extrapolated to superselective chemoembolization performed via a direct tumor feeding artery or secondary liver tumors. Fifth, the lack of data about local tumor progression or metastasis and cause of death in relation to perfusion reduction level limits the capacity to conclusively define the pathophysiologic mechanisms that underlie the worse survival outcomes in patients with perfusion reduction levels of less than 35% or more than 85%. Finally, reproducibility data about quantitative TRIP MR imaging measurements are limited despite potential to affect quantitative results. However, published data have confirmed the ability of TRIP MR imaging to depict progressive tumor perfusion reduction achieved by means of injection of incremental embolic doses and validate the capability of this technique to accurately measure flow reduction and tumor devascularization (19).
In conclusion, intraprocedural tumor perfusion reduction may be associated with TFS in patients with unresectable HCC undergoing chemoembolization. Chemoembolization provided improved survival benefit with 35%–85% relative perfusion reduction. The present results also suggest that TRIP MR imaging–measured tumor perfusion reduction may serve as an intraprocedural imaging biomarker during chemoembolization. Future studies can help determine whether the results can be extended to bland embolization and chemoembolization with use of drug-eluting beads.
Advances in Knowledge
■ After transcatheter intraarterial perfusion (TRIP) MR imaging–monitored chemoembolization, patients with 35%–85% intraprocedural tumor perfusion reduction had a significant improvement in median transplant-free survival compared with patients with perfusion reduction outside this range (16.6 months [95% confidence interval: 11.2, 22.0 months] vs 9.3 months [95% confidence interval: 6.6, 12.0 months], respectively; P = .046).
■ The cumulative survival rates in patients with 35%–85% and less than 35% or more than 85% intraprocedural tumor perfusion reduction at 1, 2, and 5 years after chemoembolization were 66.4%, 42.2%, and 28.2% versus 33.8%, 16.9%, and 0%, respectively.
Implication for Patient Care
■ TRIP MR imaging–measured tumor perfusion reduction may serve as an intraprocedural imaging biomarker to guide the selection of optimal therapeutic end points during chemoembolization.
Received June 7, 2013; revision requested September 5; revision received December 18; accepted January 7, 2014; final version accepted January 20.
Current address: Siemens Medical Solutions USA, Minneapolis, Minn
Funding: This research was supported by the National Institutes of Health (grants R01 CA126809 and R01 CA134719).
Disclosures of Conflicts of Interest: D.W. Financial activities related to the present article: none to disclose. Financial activities not related to the present article: is employed by Siemens Healthcare. Other relationships: has a patent issued. R.C.G. No relevant conflicts of interest to disclose. B.J. No relevant conflicts of interest to disclose. R.J.L. No relevant conflicts of interest to disclose. A.R. No relevant conflicts of interest to disclose. K.M. No relevant conflicts of interest to disclose. R.K.R. No relevant conflicts of interest to disclose. K.T.S. No relevant conflicts of interest to disclose. L.M.K. No relevant conflicts of interest to disclose. M.F.M. No relevant conflicts of interest to disclose. A.C.L. Financial activities related to the present article: none to disclose. Financial activities not related to the present article: none to disclose. Other relationships: has a patent issued. R.S. No relevant conflicts of interest to disclose. R.A.O. Financial activities related to the present article: none to disclose. Financial activities not related to the present article: none to disclose. Other relationships: has a patent issued.
Abbreviations:
- CLIP
- Cancer of the Liver Italian Program
- DSA
- digital subtraction angiography
- ECOG
- Eastern Cooperative Oncology Group
- HCC
- hepatocellular carcinoma
- TFS
- transplant-free survival
- TRIP
- transcatheter intraarterial perfusion
- UNOS
- United Network for Organ Sharing
References
- 1.Raoul JL. Natural history of hepatocellular carcinoma and current treatment options. Semin Nucl Med 2008;38(2):S13–S18. [DOI] [PubMed] [Google Scholar]
- 2.Altekruse SF, McGlynn KA, Reichman ME. Hepatocellular carcinoma incidence, mortality, and survival trends in the United States from 1975 to 2005. J Clin Oncol 2009;27(9):1485–1491. [DOI] [PMC free article] [PubMed] [Google Scholar]
- 3.El-Serag HB, Rudolph KL. Hepatocellular carcinoma: epidemiology and molecular carcinogenesis. Gastroenterology 2007;132(7):2557–2576. [DOI] [PubMed] [Google Scholar]
- 4.Di Bisceglie AM. Epidemiology and clinical presentation of hepatocellular carcinoma. J Vasc Interv Radiol 2002;13(9 Pt 2):S169–S171. [DOI] [PubMed] [Google Scholar]
- 5.Zhu AX, El-Khoueiry A, Llovet JM. Accomplishments in 2008 in the management of hepatobiliary cancers. Gastrointest Cancer Res 2009;3(5 Supplement 2):S28–S36. [PMC free article] [PubMed] [Google Scholar]
- 6.Lu DS, Yu NC, Raman SS, et al. Radiofrequency ablation of hepatocellular carcinoma: treatment success as defined by histologic examination of the explanted liver. Radiology 2005;234(3):954–960. [DOI] [PubMed] [Google Scholar]
- 7.Graziadei IW, Sandmueller H, Waldenberger P, et al. Chemoembolization followed by liver transplantation for hepatocellular carcinoma impedes tumor progression while on the waiting list and leads to excellent outcome. Liver Transpl 2003;9(6):557–563. [DOI] [PubMed] [Google Scholar]
- 8.Kulik LM, Carr BI, Mulcahy MF, et al. Safety and efficacy of 90Y radiotherapy for hepatocellular carcinoma with and without portal vein thrombosis. Hepatology 2008;47(1):71–81. [DOI] [PubMed] [Google Scholar]
- 9.Llovet JM, Real MI, Montaña X, et al. Arterial embolisation or chemoembolisation versus symptomatic treatment in patients with unresectable hepatocellular carcinoma: a randomised controlled trial. Lancet 2002;359(9319):1734–1739. [DOI] [PubMed] [Google Scholar]
- 10.Lo CM, Ngan H, Tso WK, et al. Randomized controlled trial of transarterial lipiodol chemoembolization for unresectable hepatocellular carcinoma. Hepatology 2002;35(5):1164–1171. [DOI] [PubMed] [Google Scholar]
- 11.Riaz A, Miller FH, Kulik LM, et al. Imaging response in the primary index lesion and clinical outcomes following transarterial locoregional therapy for hepatocellular carcinoma. JAMA 2010;303(11):1062–1069. [DOI] [PMC free article] [PubMed] [Google Scholar]
- 12.Riaz A, Ryu RK, Kulik LM, et al. Alpha-fetoprotein response after locoregional therapy for hepatocellular carcinoma: oncologic marker of radiologic response, progression, and survival. J Clin Oncol 2009;27(34):5734–5742. [DOI] [PubMed] [Google Scholar]
- 13.Lewandowski RJ, Mulcahy MF, Kulik LM, et al. Chemoembolization for hepatocellular carcinoma: comprehensive imaging and survival analysis in a 172-patient cohort. Radiology 2010;255(3):955–965. [DOI] [PMC free article] [PubMed] [Google Scholar]
- 14.Riaz A, Memon K, Miller FH, et al. Role of the EASL, RECIST, and WHO response guidelines alone or in combination for hepatocellular carcinoma: radiologic-pathologic correlation. J Hepatol 2011;54(4):695–704. [DOI] [PMC free article] [PubMed] [Google Scholar]
- 15.Lencioni R, Llovet JM. Modified RECIST (mRECIST) assessment for hepatocellular carcinoma. Semin Liver Dis 2010;30(1):52–60. [DOI] [PubMed] [Google Scholar]
- 16.Hylton N. Dynamic contrast-enhanced magnetic resonance imaging as an imaging biomarker. J Clin Oncol 2006;24(20):3293–3298. [DOI] [PubMed] [Google Scholar]
- 17.Kamel IR, Liapi E, Reyes DK, Zahurak M, Bluemke DA, Geschwind JF. Unresectable hepatocellular carcinoma: serial early vascular and cellular changes after transarterial chemoembolization as detected with MR imaging. Radiology 2009;250(2):466–473. [DOI] [PMC free article] [PubMed] [Google Scholar]
- 18.Chen CY, Li CW, Kuo YT, et al. Early response of hepatocellular carcinoma to transcatheter arterial chemoembolization: choline levels and MR diffusion constants—initial experience. Radiology 2006;239(2):448–456. [DOI] [PubMed] [Google Scholar]
- 19.Wang D, Bangash AK, Rhee TK, et al. Liver tumors: monitoring embolization in rabbits with VX2 tumors—transcatheter intraarterial first-pass perfusion MR imaging. Radiology 2007;245(1):130–139. [DOI] [PubMed] [Google Scholar]
- 20.Lewandowski RJ, Wang D, Gehl J, et al. A comparison of chemoembolization endpoints using angiographic versus transcatheter intraarterial perfusion/MR imaging monitoring. J Vasc Interv Radiol 2007;18(10):1249–1257. [DOI] [PubMed] [Google Scholar]
- 21.Larson AC, Wang D, Atassi B, et al. Transcatheter intraarterial perfusion: MR monitoring of chemoembolization for hepatocellular carcinoma—feasibility of initial clinical translation. Radiology 2008;246(3):964–971. [DOI] [PubMed] [Google Scholar]
- 22.Gaba RC, Wang D, Lewandowski RJ, et al. Four-dimensional transcatheter intraarterial perfusion MR imaging for monitoring chemoembolization of hepatocellular carcinoma: preliminary results. J Vasc Interv Radiol 2008;19(11):1589–1595. [DOI] [PMC free article] [PubMed] [Google Scholar]
- 23.Wang D, Jin B, Lewandowski RJ, et al. Quantitative 4D transcatheter intraarterial perfusion MRI for monitoring chemoembolization of hepatocellular carcinoma. J Magn Reson Imaging 2010;31(5):1106–1116. [DOI] [PMC free article] [PubMed] [Google Scholar]
- 24.Lewandowski RJ, Tepper J, Wang D, et al. MR imaging perfusion mismatch: a technique to verify successful targeting of liver tumors during transcatheter arterial chemoembolization. J Vasc Interv Radiol 2008;19(5):698–705. [DOI] [PubMed] [Google Scholar]
- 25.Gaba RC, Jin B, Wang D, et al. Locoregional chemoembolic delivery: prediction with transcatheter intraarterial perfusion MRI. AJR Am J Roentgenol 2012;198(5):1196–1202. [DOI] [PubMed] [Google Scholar]
- 26.Jin B, Wang D, Lewandowski RJ, et al. Chemoembolization endpoints: effect on survival among patients with hepatocellular carcinoma. AJR Am J Roentgenol 2011;196(4):919–928. [DOI] [PMC free article] [PubMed] [Google Scholar]
- 27.Wang D, Gaba RC, Jin B, et al. Intraprocedural transcatheter intra-arterial perfusion MRI as a predictor of tumor response to chemoembolization for hepatocellular carcinoma. Acad Radiol 2011;18(7):828–836. [DOI] [PMC free article] [PubMed] [Google Scholar]
- 28.Bruix J, Sherman M, Llovet JM, et al. Clinical management of hepatocellular carcinoma: conclusions of the Barcelona–2000 EASL conference. European Association for the Study of the Liver. J Hepatol 2001;35(3):421–430. [DOI] [PubMed] [Google Scholar]
- 29.Gaba RC. Chemoembolization practice patterns and technical methods among interventional radiologists: results of an online survey. AJR Am J Roentgenol 2012;198(3):692–699. [DOI] [PubMed] [Google Scholar]
- 30.Mazzaferro V, Regalia E, Doci R, et al. Liver transplantation for the treatment of small hepatocellular carcinomas in patients with cirrhosis. N Engl J Med 1996;334(11):693–699. [DOI] [PubMed] [Google Scholar]
- 31.Thomas MB, Jaffe D, Choti MM, et al. Hepatocellular carcinoma: consensus recommendations of the National Cancer Institute Clinical Trials Planning Meeting. J Clin Oncol 2010;28(25):3994–4005. [DOI] [PMC free article] [PubMed] [Google Scholar]
- 32.Bruix J, Sala M, Llovet JM. Chemoembolization for hepatocellular carcinoma. Gastroenterology 2004;127(5, Suppl 1):S179–S188. [DOI] [PubMed] [Google Scholar]
- 33.Brown DB, Geschwind JF, Soulen MC, Millward SF, Sacks D. Society of Interventional Radiology position statement on chemoembolization of hepatic malignancies. J Vasc Interv Radiol 2006;17(2 Pt 1):217–223. [DOI] [PubMed] [Google Scholar]
- 34.Guo WJ, Li J, Chen Z, et al. Transient increased expression of VEGF and MMP-1 in a rat liver tumor model after hepatic arterial occlusion. Hepatogastroenterology 2004;51(56):381–386. [PubMed] [Google Scholar]
- 35.Virmani S, Rhee TK, Ryu RK, et al. Comparison of hypoxia-inducible factor-1α expression before and after transcatheter arterial embolization in rabbit VX2 liver tumors. J Vasc Interv Radiol 2008;19(10):1483–1489. [DOI] [PMC free article] [PubMed] [Google Scholar]
- 36.Schoenleber SJ, Kurtz DM, Talwalkar JA, Roberts LR, Gores GJ. Prognostic role of vascular endothelial growth factor in hepatocellular carcinoma: systematic review and meta-analysis. Br J Cancer 2009;100(9):1385–1392. [DOI] [PMC free article] [PubMed] [Google Scholar]
- 37.Soo CS, Chuang VP, Wallace S, Charnsangavej C, Carrasco H. Treatment of hepatic neoplasm through extrahepatic collaterals. Radiology 1983;147(1):45–49. [DOI] [PubMed] [Google Scholar]
- 38.Charnsangavej C, Chuang VP, Wallace S, Soo CS, Bowers T. Angiographic classification of hepatic arterial collaterals. Radiology 1982;144(3):485–494. [DOI] [PubMed] [Google Scholar]
- 39.Jin B, Wang D, Lewandowski RJ, et al. Quantitative 4D transcatheter intraarterial perfusion MRI for standardizing angiographic chemoembolization endpoints. AJR Am J Roentgenol 2011;197(5):1237–1243. [DOI] [PMC free article] [PubMed] [Google Scholar]
- 40.Wang D, Virmani S, Tang R, et al. Four-dimensional transcatheter intraarterial perfusion (TRIP)–MRI for monitoring liver tumor embolization in VX2 rabbits. Magn Reson Med 2008;60(4):970–975. [DOI] [PMC free article] [PubMed] [Google Scholar]