

CT, fluorine 18 (18F) fluorodeoxyglucose PET, and 18F 16β-fluoro-5-dihydrotestosterone PET provided clinically relevant prognostic information in patients with bone metastases from castration-resistant prostate cancer, and imaging features such as CT lesion morphologic analysis, total number of bone lesions, and degree of androgen receptor expression were significantly associated with patient survival.
Abstract
Purpose
To compare the features of bone metastases at computed tomography (CT) to tracer uptake at fluorine 18 fluorodeoxyglucose (FDG) positron emission tomography (PET) and fluorine 18 16β-fluoro-5-dihydrotestosterone (FDHT) PET and to determine associations between these imaging features and overall survival in men with castration-resistant prostate cancer.
Materials and Methods
This is a retrospective study of 38 patients with castration-resistant prostate cancer. Two readers independently evaluated CT, FDG PET, and FDHT PET features of bone metastases. Associations between imaging findings and overall survival were determined by using univariate Cox proportional hazards regression.
Results
In 38 patients, reader 1 detected 881 lesions and reader 2 detected 867 lesions. Attenuation coefficients at CT correlated inversely with FDG (reader 1: r = −0.3007; P < .001; reader 2: r = −0.3147; P < .001) and FDHT (reader 1: r = −0.2680; P = .001; reader 2: r = −0.3656; P < .001) uptake. The number of lesions on CT scans was significantly associated with overall survival (reader 1: hazard ratio [HR], 1.025; P = .05; reader 2: HR, 1.021; P = .04). The numbers of lesions on FDG and FDHT PET scans were significantly associated with overall survival for reader 1 (HR, 1.051–1.109; P < .001) and reader 2 (HR, 1.026–1.082; P ≤ .009). Patients with higher FDHT uptake (lesion with the highest maximum standardized uptake value) had significantly shorter overall survival (reader 1: HR, 1.078; P = .02; reader 2: HR, 1.092; P = .02). FDG uptake intensity was not associated with overall survival (reader 1, P = .65; reader 2, P = .38).
Conclusion
In patients with castration-resistant prostate cancer, numbers of bone lesions on CT, FDG PET, and FDHT PET scans and the intensity of FDHT uptake are significantly associated with overall survival.
© RSNA, 2013
Introduction
Recent advances in molecular biology have led to improved understanding of the mechanisms behind the development of advanced castration-resistant prostate cancer (1). The androgen receptor has been found to play a central role in the pathogenesis of this condition, and novel therapies directed against the androgen receptor and androgen receptor signaling have shown a clear survival benefit in this patient population (2,3). Despite the enthusiasm generated by these recent developments, there is still a need for imaging biomarkers that can reliably document the extent of disease and monitor treatment response to these and other novel therapies, particularly regarding metastatic bone disease. Bone involvement is the leading cause of morbidity and mortality in advanced prostate cancer, and often results in pain, pathologic fractures, hematologic disorders due to bone marrow replacement by tumor, and neurologic complications such as spinal cord compression (4).
Parallel to recent therapeutic developments, molecular imaging probes that target different elements of the androgen receptor signaling pathway are currently being evaluated in the clinic. One such probe is fluorine 18 16β-fluoro-5-dihydrotestosterone (FDHT), an analog of the primary ligand of the androgen receptor (5). FDHT and other more established tracers, such as fluorine 18 fluorodeoxyglucose (FDG), are imaged with positron emission tomography (PET), typically performed in combination with computed tomographic (CT) imaging, which is used for attenuation correction and anatomic correlation. Prostate bone metastases most commonly appear osteoblastic on CT images, but they are difficult to evaluate because anatomic boundaries of individual tumor lesions are not well characterized, and quantification of multiple bone lesions is not commonly attempted (6). Furthermore, blastic changes may persist long after successful treatment, which limits the use of CT for outcome assessment (7). Despite this, unlike PET/CT, CT is widely available and often used for the assessment of lymph nodes and other sites of disease in advanced prostate cancer (8). Thus, it may be clinically relevant to establish the relationship between CT features and molecular events within the tumor microenvironment. The purpose of this study was to compare the features of bone metastases on CT images with tracer uptake on FDG PET and FDHT PET images and to determine the associations between these imaging features and overall survival in men with castration-resistant prostate cancer.
Materials and Methods
The institutional review board approved this observational, cross-sectional retrospective review of data from a cohort of men with progressive castration-resistant prostate cancer. This cohort was recruited under an institutional protocol with the primary objective of studying the accumulation and biodistribution of FDHT in patients with progressive prostate cancer. Written informed consent for participation in this protocol was obtained from all patients. The study was compliant with the Health Insurance Portability and Accountability Act.
Eligibility Criteria and Patient Characteristics
The eligibility criteria for our study were as follows: (a) histologically confirmed prostate cancer; (b) progressive disease manifested as (i) new osseous lesions on bone scintigraphs and/or increase in measurable soft-tissue disease or the appearance of new sites of disease on CT or magnetic resonance images since the date of the last imaging study performed or (ii) biochemical progression, defined as an increase in prostate-specific antigen level on three observations taken at least 1 week apart (with a total increase of more than 50% from baseline); and (c) castration-resistant disease (serum testosterone levels <50 ng/dL) (9). A total of 60 consecutive patients evaluated between June 2007 and November 2008 satisfied the inclusion criteria. Of these, six patients with lymph node, lung, and/or liver metastases but no bone metastases and 16 patients with widespread disease (no discretely measurable individual bone lesions) were excluded. Thus, the final study population consisted of 38 patients. Patient and tumor characteristics, including treatment received immediately after inclusion in this study, are summarized in Table 1.
Table 1.
Patient Characteristics

Note.—PSA = prostate-specific antigen.
Data in parentheses are range.
Data in parentheses are percentages.
FDHT and FDG PET/CT Acquisition
FDG and FDHT PET/CT examinations were performed with a PET/CT scanner (Discovery STE; GE Healthcare, Milwaukee, Wis). FDG examinations were performed approximately 60 minutes after intravenous administration of about 370 MBq of FDG. FDHT examinations were performed approximately 40 minutes after intravenous administration of about 333 MBq of FDHT (5). Patients were imaged from skull base to upper thighs. Low-dose CT (120–140 kV, 80 mA) was also performed with a section thickness and reconstruction interval of 5 mm and pitch of 0.75–1.5. Oral contrast material (25 mL of diatrizoate meglumine and diatrizoate sodium [Gastroview; Mallinckrodt Imaging, Hazelwood, Mo] diluted in 1000 mL of a sugar-free beverage solution [Crystal Lite; Kraft Foods, Glenview, Ill]) was administered 30–60 minutes before CT acquisition as part of the FDG PET/CT. No intravenous contrast material was administered.
Image Interpretation
A dually trained radiologist and nuclear medicine physician with 8 years of experience (C.W.) and a radiologist with 2 years of experience in PET/CT (A.W.) independently evaluated all imaging examinations. Bone lesions on CT scans were classified into the following subtypes: (a) osteoblastic dense; (b) osteoblastic ground glass; (c) osteoblastic mixed; (d) osteoblastic miliary; (e) osteolytic; and (f) mixed osteolytic and osteoblastic, based on the experience of the authors observing distinct patterns of bone lesions at CT (Fig 1). For every bone lesion at CT, anatomic site (specific bone or bones in the thorax, spine, pelvis or extremities) and average CT Hounsfield unit were recorded by the readers. The FDG and FDHT scans for each patient were imported to a dedicated workstation (PET VCAR; GE Healthcare) and automatically coregistered to each other by using a system of coarse and fine adjustments based on the characteristics of the bone and soft tissue on the companion CT scans. For inter-PET comparison, FDG-avid lesions were semiautomatically segmented. The bookmarked regions of interest were then automatically duplicated and propagated onto the coregistered FDHT images. The propagated regions of interest were accepted, rejected, or manually adjusted by the reader on an as-needed basis. Lesions identified only at FDHT PET were segmented and propagated onto the coregistered FDG images in a similar manner. All bone lesions were quantified by measuring their maximum standardized uptake value (SUVmax) adjusted to body weight. On PET scans, a bone metastasis was defined as focal tracer accumulation above background (blood pool) activity not explainable by physiologic or benign (eg, trauma) processes with or without a matched lesion at the same site on CT imaging (Figs 2, 3).
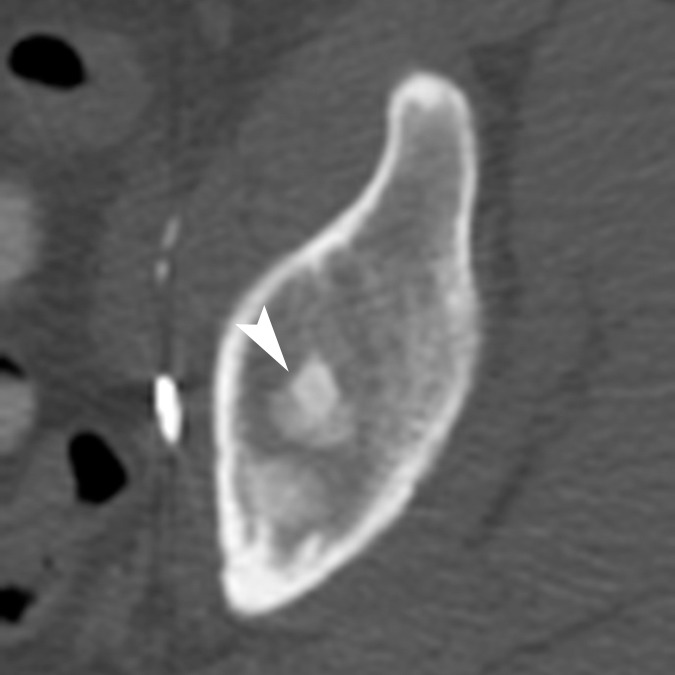
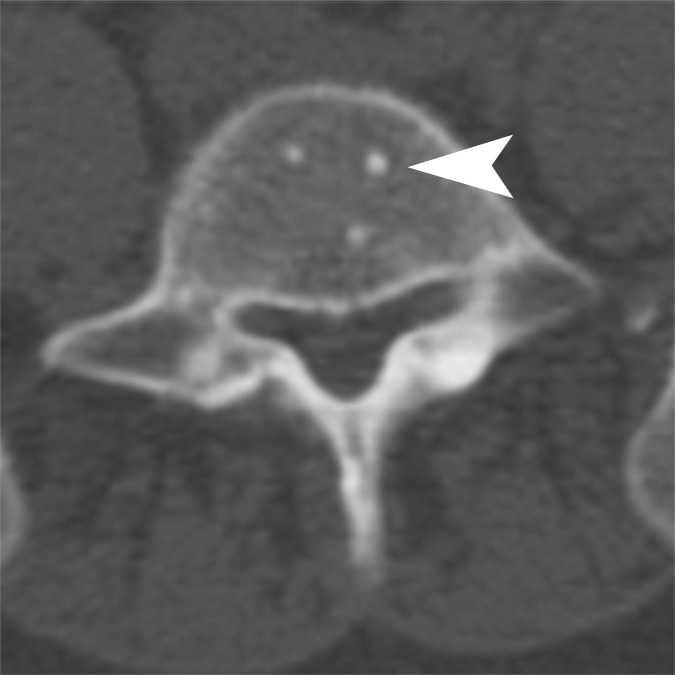
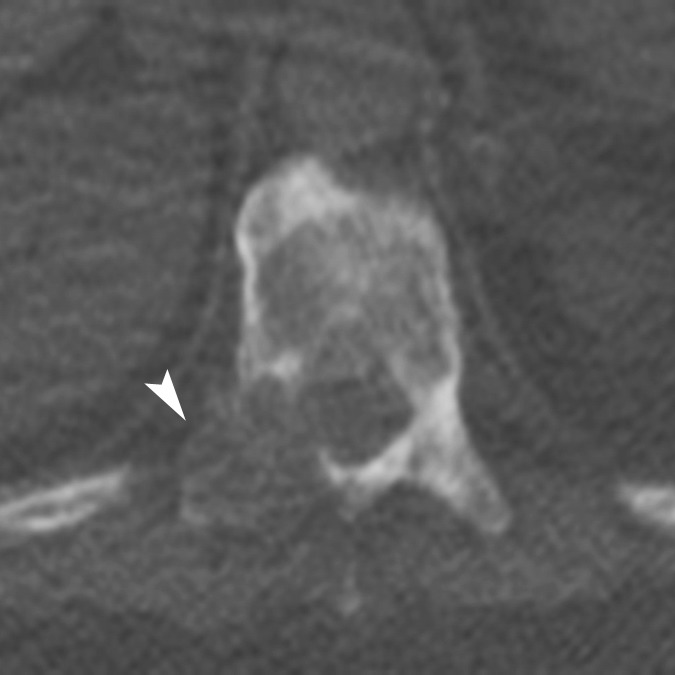
Figure 1a:

Representative examples of the different CT lesion morphologies (arrowhead) evaluated in this study. (a) Osteoblastic dense, (b) osteoblastic ground glass, (c) osteoblastic mixed dense and ground glass, (d) miliary, (e) osteolytic, and (f) mixed osteolytic and osteoblastic.
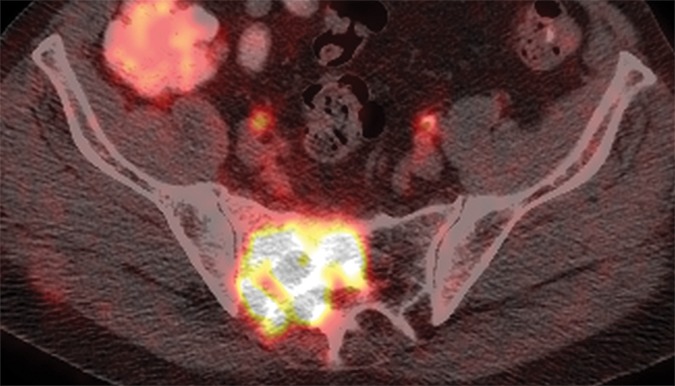
Figure 2a:

(a) Axial CT, (b) fused FDG PET/CT, and (c) fused FDHT PET/CT images in an 81-year-old patient with an FDHT-predominant phenotype. A ground-glass lesion in the left sacral ala (white arrowheads) has an attenuation of 352 HU and uptake on FDG (SUVmax, 8) and FDHT (SUVmax, 22) PET images. A subtle ground-glass lesion in the right ilium (black arrowheads) demonstrates uptake at FDHT PET (SUVmax, 10) but no abnormal uptake at FDG PET. An osteoblastic dense lesion (839 HU) in the right ilium (arrows) shows increased uptake at FDHT (SUVmax, 13) but no uptake at FDG PET. All measurements are from reader 1.
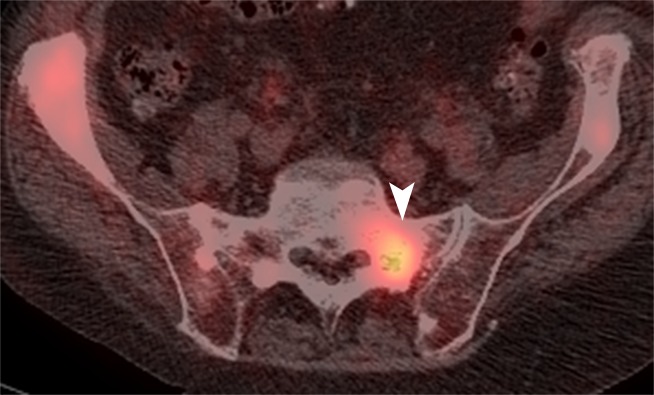
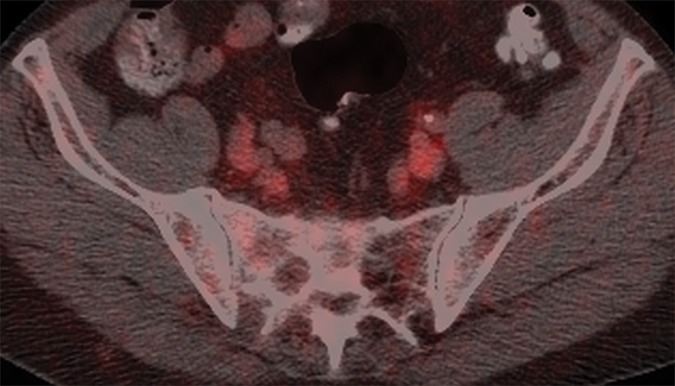
Figure 3a:

(a) Axial CT, (b) fused FDG PET/CT, and (c) fused FDHT PET/CT images in a 66-year-old patient with a predominantly lytic lesion in the sacrum (arrow) that shows marked FDG uptake (SUVmax, 16) but no abnormal FDHT uptake on PET images.
Figure 1b:

Representative examples of the different CT lesion morphologies (arrowhead) evaluated in this study. (a) Osteoblastic dense, (b) osteoblastic ground glass, (c) osteoblastic mixed dense and ground glass, (d) miliary, (e) osteolytic, and (f) mixed osteolytic and osteoblastic.
Figure 1c:
Representative examples of the different CT lesion morphologies (arrowhead) evaluated in this study. (a) Osteoblastic dense, (b) osteoblastic ground glass, (c) osteoblastic mixed dense and ground glass, (d) miliary, (e) osteolytic, and (f) mixed osteolytic and osteoblastic.
Figure 1d:
Representative examples of the different CT lesion morphologies (arrowhead) evaluated in this study. (a) Osteoblastic dense, (b) osteoblastic ground glass, (c) osteoblastic mixed dense and ground glass, (d) miliary, (e) osteolytic, and (f) mixed osteolytic and osteoblastic.
Figure 1e:
Representative examples of the different CT lesion morphologies (arrowhead) evaluated in this study. (a) Osteoblastic dense, (b) osteoblastic ground glass, (c) osteoblastic mixed dense and ground glass, (d) miliary, (e) osteolytic, and (f) mixed osteolytic and osteoblastic.
Figure 1f:

Representative examples of the different CT lesion morphologies (arrowhead) evaluated in this study. (a) Osteoblastic dense, (b) osteoblastic ground glass, (c) osteoblastic mixed dense and ground glass, (d) miliary, (e) osteolytic, and (f) mixed osteolytic and osteoblastic.
Figure 2b:
(a) Axial CT, (b) fused FDG PET/CT, and (c) fused FDHT PET/CT images in an 81-year-old patient with an FDHT-predominant phenotype. A ground-glass lesion in the left sacral ala (white arrowheads) has an attenuation of 352 HU and uptake on FDG (SUVmax, 8) and FDHT (SUVmax, 22) PET images. A subtle ground-glass lesion in the right ilium (black arrowheads) demonstrates uptake at FDHT PET (SUVmax, 10) but no abnormal uptake at FDG PET. An osteoblastic dense lesion (839 HU) in the right ilium (arrows) shows increased uptake at FDHT (SUVmax, 13) but no uptake at FDG PET. All measurements are from reader 1.
Figure 2c:

(a) Axial CT, (b) fused FDG PET/CT, and (c) fused FDHT PET/CT images in an 81-year-old patient with an FDHT-predominant phenotype. A ground-glass lesion in the left sacral ala (white arrowheads) has an attenuation of 352 HU and uptake on FDG (SUVmax, 8) and FDHT (SUVmax, 22) PET images. A subtle ground-glass lesion in the right ilium (black arrowheads) demonstrates uptake at FDHT PET (SUVmax, 10) but no abnormal uptake at FDG PET. An osteoblastic dense lesion (839 HU) in the right ilium (arrows) shows increased uptake at FDHT (SUVmax, 13) but no uptake at FDG PET. All measurements are from reader 1.
Figure 3b:
(a) Axial CT, (b) fused FDG PET/CT, and (c) fused FDHT PET/CT images in a 66-year-old patient with a predominantly lytic lesion in the sacrum (arrow) that shows marked FDG uptake (SUVmax, 16) but no abnormal FDHT uptake on PET images.
Figure 3c:
(a) Axial CT, (b) fused FDG PET/CT, and (c) fused FDHT PET/CT images in a 66-year-old patient with a predominantly lytic lesion in the sacrum (arrow) that shows marked FDG uptake (SUVmax, 16) but no abnormal FDHT uptake on PET images.
Statistical Analysis
Patient characteristics are described by using frequency and percentage for categorical variables and median and range for continuous variables. Agreement between all possible pairings of CT, FDG PET, and FDHT PET were analyzed on a lesion basis and compared by using the McNemar test. For lesions that were positive for both scans in a pair, correlation between the two scan measurements was evaluated by using Pearson correlation. Lesion-based analyses included multiple lesions from the same patient, which violates the typical assumption of independent observations required for most standard statistical tests. We handled this by using a variance inflation factor, which is based on the intraclass correlation (ie, correlation between the lesions in the same patient) and the average number of lesions per patient. The intraclass correlation was estimated by using a random effects model. Details of this methodologic approach were previously described (10). Lesion and scan data were summarized per patient and examined in relation to overall survival and progression-free survival. In each patient, the lesion with the highest SUVmax was selected to represent tracer uptake at the per-patient level. Overall survival was calculated from the date of the first PET (FDG or FDHT) to the date of death or last follow-up. One patient, who subsequently developed and died of a second cancer (cholangiocarcinoma), was excluded from the outcome analysis. A post hoc power calculation was performed by using the method developed by Hsieh and Lavori (11). On the basis of the observed variability in SUV, we found that 32 events (the number of deaths in this data set) provided us with 80% power to detect a hazard ratio of 1.1 (an increase of 10% in the risk of death for each unit increase in SUV). A P value of .05 or less indicated statistical significance.
Results
Bone Lesions Detected according to Each Imaging Modality
In the 38 patients, reader 1 detected a total of 881 lesions (range, 1–76 lesions per patient; 351 of 881 lesions [39.8%] at CT only, 241 of 881 lesions [27.3%] at both CT and PET, and 289 of 881 lesions [32.8%] at PET only), while reader 2 detected a total of 867 lesions (range, 1–103 lesions per patient; 439 of 867 lesions [50.6%] at CT only, 330 of 867 lesions [38.0%] at both CT and PET, and 98 of 867 lesions [11.3%] at PET only).
Of 592 lesions detected at CT by reader 1, 183 lesions (30.9%) were FDG positive and 229 lesions (38.6%) were FDHT positive. Of 769 lesions detected at CT by reader 2, 182 lesions (23.6%) were FDG positive and 286 lesions (37.1%) were FDHT positive. Reader 1 detected 530 lesions at PET, of which 306 lesions (57.7%) demonstrated both FDG and FDHT uptake, 48 lesions (9.0%) demonstrated only FDG uptake, and 176 lesions (33.2%) demonstrated only FDHT uptake (Figs 2, 3). Reader 2 detected 428 lesions at PET, of which 152 lesions (35.5%) demonstrated both FDG and FDHT uptake, 51 lesions (11.9%) demonstrated only FDG uptake, and 225 lesions (52.5%) demonstrated only FDHT uptake (Figs 2, 3). The mean SUVmax of the lesions detected at FDG PET was 5.3 (range, 1.5–25.5) for reader 1 and 6.67 (range, 1.4–25.4) for reader 2. The mean SUVmax of the lesions detected at FDHT PET was 7.1 (range, 1.4–28.5) for reader 1 and 9.08 (range 1.8–28.2) for reader 2. Figure 4 shows scatterplots that demonstrate the relationship between FDG SUVmax and FDHT SUVmax for each reader. Most lesions were located in the pelvic bones (295 for reader 1 and 235 for reader 2) and spine (288 for reader 1 and 279 for reader 2). A full breakdown of the anatomic locations of all lesions detected at baseline is provided in Table 2.
Figure 4a:

Scatterplots show the relationship between FDG SUVmax and FDHT SUVmax for each bone lesion according to (a) reader 1 and (b) reader 2.
Table 2.
Anatomic Locations of Bone Metastases Detected with Any or All Modalities
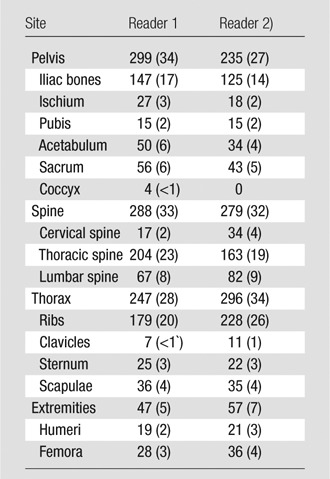
Note.—Reader 1 identified a total of 881 bone metastases and reader 2 calculated a total of 867 bone metastases. Data in parentheses are percentages.
Figure 4b:

Scatterplots show the relationship between FDG SUVmax and FDHT SUVmax for each bone lesion according to (a) reader 1 and (b) reader 2.
Morphologic Patterns of Lesions at CT and Correlation with FDG and FDHT Uptake at PET
Figure 1 shows the various morphologic lesion patterns on CT scans, and Table 3 summarizes their frequency and correspondence with tracer uptake on PET scans. Among the lesions identified on CT scans, the majority (63.5% [376 of 592] for reader 1 and 56.0% [431 of 769] for reader 2) had an osteoblastic dense appearance. According to both readers, 32 of 38 patients (84.2%) had one or more osteoblastic dense lesions. The second most prevalent lesion morphologies were osteoblastic ground glass and mixed osteoblastic with dense and ground-glass components, which together accounted for 28.3% of lesions (168 of 592) according to reader 1 and 38.6% of lesions (297 of 769) according to reader 2. One or more osteoblastic ground-glass lesions were identified in 22 of 38 patients (57.8%) by reader 1 and 26 of 38 patients (68.4%) by reader 2. The attenuation of bone lesions on CT scans correlated inversely with both FDG uptake (reader 1: r = −0.3007, P < .001; reader 2: r = −0.3147, P < .001) and FDHT uptake (reader 1: r = −0.2680, P = .001; reader 2: r = −0.3656, P < .001), and lesions with higher attenuation (ie, more blastic lesions) had lower tracer uptake (Fig 5).
Table 3.
Summary of Morphologic Lesion Patterns at CT and Corresponding Uptake at PET
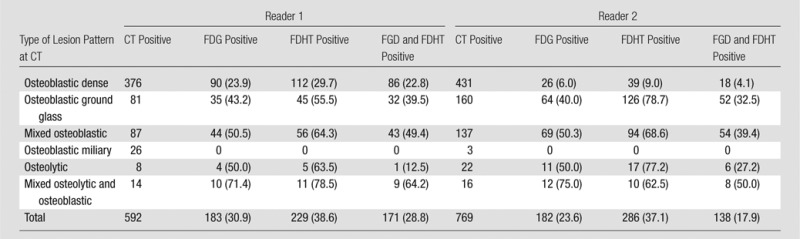
Note.—Data are number of lesions. Data in parentheses are percentages.
Figure 5a:

Scatterplots show the relationships of mean Hounsfield units to SUVmax at FDG PET and SUVmax at FDHT PET for each bone lesion for (a, b) reader 1 and (c, d) reader 2.
Figure 5b:

Scatterplots show the relationships of mean Hounsfield units to SUVmax at FDG PET and SUVmax at FDHT PET for each bone lesion for (a, b) reader 1 and (c, d) reader 2.
Figure 5c:

Scatterplots show the relationships of mean Hounsfield units to SUVmax at FDG PET and SUVmax at FDHT PET for each bone lesion for (a, b) reader 1 and (c, d) reader 2.
Figure 5d:

Scatterplots show the relationships of mean Hounsfield units to SUVmax at FDG PET and SUVmax at FDHT PET for each bone lesion for (a, b) reader 1 and (c, d) reader 2.
Associations of Morphologic Lesion Patterns at CT, Numbers of Bone Lesions at CT and PET, and PET Tracer Uptake with Overall Survival
At least one bone lesion was identified at CT in 36 of 38 patients (94.7%) by reader 1 and 38 of 38 patients (100%) by reader 2. At least one FDG-avid bone lesion was present in 34 of 38 patients (89.4%) according to reader 1 and 28 of 38 patients (73.6%) according to reader 2. At least one FDHT-avid bone lesion was identified in 36 of 38 patients (94.7%) by reader 1 and 28 of 38 patients (73.6%) by reader 2.
Patients were followed until death (n = 33) or for a mean of 37.5 months (range, 6.6–59.1 months; n = 5). For reader 1, patients with one or more ground-glass lesions on CT scans had significantly shorter overall survival than patients without ground-glass lesions on CT scans (median overall survival, 15.3 months vs 39.1 months, respectively; χ2 = 11.65; P < .001). For reader 2, there were no associations between CT lesion morphologies and overall survival. Table 4 summarizes the associations between survival and the numbers of bone lesions on CT and PET scans, as well as SUVmax at PET. The number of bone lesions at CT was significantly associated with overall survival for both reader 1 (hazard ratio [HR], 1.025; 95% confidence interval [CI]: 1.002, 1.049; P = .05) and for reader 2 (HR, 1.021; 95% CI: 1.002, 1.039; P = .04).
Table 4.
Summary of Associations between Overall Survival and Number of Lesions on CT, Number of Lesions on PET, and SUVmax on PET
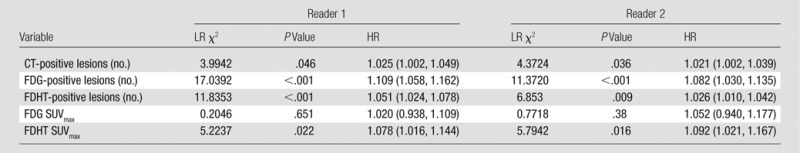
Note.—Data in parentheses are 95% CIs. LR = likelihood ratio.
The numbers of bone lesions on FDG PET and FDHT PET scans were significantly associated with overall survival for reader 1 for FDG (HR, 1.109; 95% CI: 1.058, 1.162; P < .001) and for FDHT (HR, 1.051; 95% CI: 1.024, 1.078; P < .001) and for reader 2 for FDG (HR, 1.082; 95% CI: 1.030, 1.135; P < .001) and for FDHT (HR, 1.026; 95% CI: 1.010, 1.042; P = .009).
Patients with higher FDHT uptake (defined by the bone lesion with the highest SUVmax) had significantly shorter overall survival for both reader 1 (HR, 1.078; 95% CI: 1.016, 1.144; P = .02) and reader 2 (HR, 1.092; 95% CI: 1.021, 1.167; P = .02). The intensity of FDG uptake in bone lesions was not significantly associated with overall survival for either reader (reader 1, P = .65; reader 2, P = .38).
Discussion
In our study, we analyzed the variable morphologic patterns of prostate cancer bone metastases at CT and their associated glycolytic activity and relative androgen receptor expression based on uptake of FDG and FDHT, respectively. We found a significant inverse correlation between attenuation on CT scans and PET tracer uptake, and, more importantly, we found that the numbers of bone lesions on CT, FDG PET, and FDHT PET scans per patient and the intensity of FDHT uptake in bone lesions on PET scans were significantly associated with overall survival.
Our findings are concordant with others (12,13) that suggest the majority of bone metastases in prostate cancer occur in the pelvis and spine and have a dense osteoblastic pattern. The literature (14,15) suggests that osteolytic and osteoblastic lesions actually represent two extremes of a continuum of dysregulated bone remodeling. The exact mechanisms of osteoblastic metastases remain unknown, but it is thought (14) that prostate cancer cells produce osteoblast-stimulating factors. In our study, attenuation of bone lesions on CT scans was inversely proportional to both FDG and FDHT uptake on PET scans (ie, the more blastic the lesion at CT, the lower the uptake at PET), which could indicate decreased metabolic activity in dense osteoblastic lesions. This observation has been previously documented (16,17) in breast cancer metastases, and Beheshti et al (12) identified a similar pattern by using fluorine 18 fluorocholine PET in patients with metastatic prostate cancer. The lack of concordance between the readers in our study regarding associations between CT lesion morphology and overall survival may be related to the presence of multiple lesion morphologies per patient and the limited sample size. The morphologic classification system we used was based on anecdotal experience and consisted of six categories. It is possible that concordance may also be improved in the future by using a different or more simplified classification system.
The numbers of bone lesions we assessed that were identified on the imaging tests had potential prognostic implications. Both readers found a statistically significant association of total numbers of bone lesions per patient on CT, FDG PET, and FDHT PET scans with overall patient survival. In addition, on FDHT PET scans but not on FDG PET scans, the intensity of tracer uptake (defined as the highest bone lesion SUVmax in the patient) correlated inversely with overall survival, and patients with higher uptake had shorter overall survival. There are many possible explanations for the apparent discrepancy in prognostic importance between FDG uptake and FDHT uptake. The diversity of metabolic phenotypes of bone metastases in patients with castration-resistant prostate cancer, potentially evidenced by discordance between FDG and FDHT uptake, was previously documented (5,18). As an analog of the primary ligand of the androgen receptor, FDHT is part of a novel group of PET tracers with specific relevance to castration-resistant prostate cancer (5,19). In vivo quantitative kinetic models of FDHT uptake as a measure of androgen receptor expression and displacement of FDHT by antiandrogen therapy have been demonstrated (5,19). On the other hand, FDG uptake in cancer is mediated by the Warburg effect, where FDG is trapped within tumor cells with a relatively high glycolytic rate; however, FDG uptake is neither specific to nor invariably present in cancer cells, and it may also occur in other inflammatory conditions (20).
Our results may also have been affected by the fact that when we analyzed the extent of FDG and FDHT uptake in each patient we chose to evaluate the SUVmax of the lesion with the most intense tracer uptake at the per-patient level. Although this is a relatively simple and practical approach, it does not fully capture the metastatic burden of each patient in terms of size and number of lesions (up to 103 lesions per patient in our study population) or degree and heterogeneity of tracer uptake within individual lesions. It is possible that other methodologic approaches that incorporate lesion-by-lesion measurements (eg, averaging the SUVmax in several lesions), albeit more labor intensive and cumbersome for routine clinical assessment, may yield different results; however, such analysis was beyond the scope of our study. This issue is relevant because despite the suboptimal results reported in preliminary studies (21,22) of FDG PET in prostate cancer, which were generally attributed to the heterogeneity of the study populations examined (23), more recent studies have shown that FDG PET provides valuable prognostic information in specific clinical contexts. Morris et al (24) evaluated changes in average SUVmax on FDG PET scans measured in up to five lesions before and after treatment with antimicrotubule chemotherapy in patients with castration-sensitive metastatic prostate cancer. They found that PET correctly identified the clinical status of up to 94% of patients in the study. In a study of 43 patients with castrate and noncastrate metastatic prostate cancer who underwent FDG PET and bone scan before experimental therapies, Meirelles et al (25) found that prognosis correlated inversely with the SUVmax of the lesion with the most intense FDG uptake. The apparent discrepancy between our findings and those of Meirelles et al may relate to the heterogeneity of the population (castrate and noncastrate prostate cancer) studied by the latter.
There is an increase in interest not only in the use of FDG and FDHT but in the roles of other PET tracers—including 18 fluorine sodium fluoride, 18 fluorine or carbon 11 acetate, 18 fluorine or carbon 11 choline, and carbon 11 methionine—in the evaluation of prostate cancer (26); however, there are currently no studies in the literature that document the prognostic implications of the uptake of these tracers in patients with prostate cancer.
Our study had several limitations. The PET and CT findings were evaluated in conjunction. Although this approach reflects standard clinical practice, it introduces a degree of bias and lack of independence between the CT and PET findings. Also, we concentrated on bone disease, which accounts for the majority of metastatic sites in advanced prostate cancer, and thus excluded patients with only soft-tissue or nonmeasurable disease. It remains to be clarified whether inclusion of SUVmax measurements in diffuse and soft-tissue disease would affect the associations with clinical outcomes that we identified in this study. The retrospective observational nature of this study and its small sample size indicate that our findings require validation in larger prospective studies. Another limitation was that after undergoing imaging for the purpose of this study, patients received a variety of antiandrogen treatments, including abiraterone and enzalutamide. Although differences in the clinical outcomes achieved with these agents have not been reported in the literature, we could not account for the effect of this treatment heterogeneity in our outcome calculations. To minimize this, we chose to use overall survival as an endpoint for this study instead of progression-free survival.
In summary, CT, FDG PET, and FDHT PET provided clinically relevant prognostic information in patients with bone metastases from castration-resistant prostate cancer. Imaging features such as CT lesion morphology, total number of bone lesions, and degree of androgen receptor expression were significantly associated with patient survival.
Advances in Knowledge
■ In patients with metastatic castration-resistant prostate cancer, attenuation coefficient of bone lesions at CT correlated inversely with tracer uptake at fluorine 18 fluorodeoxyglucose (FDG) PET for both reader 1 (r = −0.3007; P < .001) and reader 2 (r = −0.3147; P < .001), and fluorine 18 16β-fluoro-5-dihydrotestosterone (FDHT) PET for both reader 1 (r = −0.2680; P = .001) and reader 2 (r = −0.3656; P < .001).
■ The total number of bone lesions on CT scans correlated significantly with overall survival for both reader 1 (hazard ratio [HR], 1.025; P = .05) and reader 2 (HR, 1.021; P = .04).
■ The numbers of bone lesions on FDG and FDHT PET scans were also significantly associated with overall survival for both reader 1 (FDG: HR, 1.109; P < .001; FDHT: HR, 1.051; P < .001) and reader 2 (FDG: HR, 1.082; P < .001; FDHT: HR, 1.026; P = .009).
■ Patients with higher FDHT uptake in bone lesions had significantly shorter overall survival according to both reader 1 (HR, 1.078; P = .02) and reader 2 (HR, 1.092; P = .02), but the intensity of FDG uptake in bone lesions was not significantly associated with overall survival (P = .65 and P = .38 for readers 1 and 2, respectively).
Implication for Patient Care
■ CT features of bone metastases in patients with castration-resistant prostate cancer appear to be related to androgen expression and glycolytic activity on PET images; CT features and tracer uptake of bone metastases on PET images might be able to provide prognostic information in these patients.
Acknowledgments
Acknowledgment
We are grateful to Ada Muellner, MS, for editing this manuscript. FDHT was supplied by the Radiochemistry & Molecular Imaging Probes Core of Memorial Sloan-Kettering Cancer Center.
Received March 11, 2013; revision requested April 23; revision received August 30; accepted September 9; final version accepted September 13.
Supported by the Sidney Kimmel Center for Prostate and Urologic Cancers and The Prostate Cancer Foundation. H.A.V. supported by the Peter Michael Foundation. H.I.S. supported by the MSKCC SPORE in Prostate Cancer (grant P50 CA92629), Department of Defense Prostate Cancer Research Program (grant PC051382), and the In Vivo Cellular and Molecular Imaging Center (grand 3 P50 CA086438-13S1).
Funding: This research was supported by the National Institutes of Health (grant P30CA008748).
Disclosures of Conflicts of Interest: H.A.V. No relevant conflicts of interest to disclose. C.W. No relevant conflicts of interest to disclose. J.J.F. No relevant conflicts of interest to disclose. A.W. No relevant conflicts of interest to disclose. D.A.G. No relevant conflicts of interest to disclose. D.K. No relevant conflicts of interest to disclose. M.G. No relevant conflicts of interest to disclose. S.M.L. No relevant conflicts of interest to disclose. M.J.M. No relevant conflicts of interest to disclose. H.I.S. Financial activities related to the present article: author provides consulting for Aragon, Janssen Research and Development, Medivation, and Millennium; author’s institution receives grant money from Aragon, Medivation, Janssen Research and Development, and Janssen Services. Financial activities not related to the present article: none to disclose. Other relationships: none to disclose. H.H. No relevant conflicts of interest to disclose.
Abbreviations:
- CI
- confidence interval
- FDG
- fluorine 18 fluorodeoxyglucose
- FDHT
- fluorine 18 16β-fluoro-5-dihydrotestosterone
- HR
- hazard ratio
- SUV
- standardized uptake value
- SUVmax
- maximum SUV
References
- 1.Schrecengost R, Knudsen KE. Molecular pathogenesis and progression of prostate cancer. Semin Oncol 2013;40(3):244–258. [DOI] [PMC free article] [PubMed] [Google Scholar]
- 2.Scher HI, Beer TM, Higano CS, et al. Antitumour activity of MDV3100 in castration-resistant prostate cancer: a phase 1-2 study. Lancet 2010;375(9724):1437–1446. [DOI] [PMC free article] [PubMed] [Google Scholar]
- 3.Scher HI, Fizazi K, Saad F, et al. Increased survival with enzalutamide in prostate cancer after chemotherapy. N Engl J Med 2012;367(13):1187–1197. [DOI] [PubMed] [Google Scholar]
- 4.Lee RJ, Saylor PJ, Smith MR. Treatment and prevention of bone complications from prostate cancer. Bone 2011;48(1):88–95. [DOI] [PMC free article] [PubMed] [Google Scholar]
- 5.Larson SM, Morris M, Gunther I, et al. Tumor localization of 16beta-18F-fluoro-5alpha-dihydrotestosterone versus 18F-FDG in patients with progressive, metastatic prostate cancer. J Nucl Med 2004;45(3):366–373. [PubMed] [Google Scholar]
- 6.Morisson C, Jeraj R, Liu G. Imaging of castration-resistant prostrate cancer: development of imaging response biomarkers. Curr Opin Urol 2013;23(3):230–236. [DOI] [PubMed] [Google Scholar]
- 7.Bäuerle T, Semmler W. Imaging response to systemic therapy for bone metastases. Eur Radiol 2009;19(10):2495–2507. [DOI] [PubMed] [Google Scholar]
- 8.Mohler JL, Armstrong AJ, Bahnson RR, et al. NCCN Clinical Practice Guidelines in Oncology for Prostate Cancer, v2.2013. http://www.nccn.org/professionals/physician_gls/pdf/prostate.pdf. Published 2013. Accessed July 1, 2013.
- 9.Scher HI, Morris MJ, Basch E, Heller G. End points and outcomes in castration-resistant prostate cancer: from clinical trials to clinical practice. J Clin Oncol 2011;29(27):3695–3704. [DOI] [PMC free article] [PubMed] [Google Scholar]
- 10.Bland JM, Altman DG. Calculating correlation coefficients with repeated observations: Part 1—Correlation within subjects. BMJ 1995;310(6977):446. [DOI] [PMC free article] [PubMed] [Google Scholar]
- 11.Hsieh FY, Lavori PW. Sample-size calculations for the Cox proportional hazards regression model with nonbinary covariates. Control Clin Trials 2000;21(6):552–560. [DOI] [PubMed] [Google Scholar]
- 12.Beheshti M, Vali R, Waldenberger P, et al. The use of F-18 choline PET in the assessment of bone metastases in prostate cancer: correlation with morphological changes on CT. Mol Imaging Biol 2009;11(6):446–454. [DOI] [PubMed] [Google Scholar]
- 13.Wang C, Shen Y. Study on the distribution features of bone metastases in prostate cancer. Nucl Med Commun 2012;33(4):379–383. [DOI] [PubMed] [Google Scholar]
- 14.Ibrahim T, Flamini E, Mercatali L, Sacanna E, Serra P, Amadori D. Pathogenesis of osteoblastic bone metastases from prostate cancer. Cancer 2010;116(6):1406–1418. [DOI] [PubMed] [Google Scholar]
- 15.Nielsen OS, Munro AJ, Tannock IF. Bone metastases: pathophysiology and management policy. J Clin Oncol 1991;9(3):509–524. [DOI] [PubMed] [Google Scholar]
- 16.Cook GJ, Houston S, Rubens R, Maisey MN, Fogelman I. Detection of bone metastases in breast cancer by 18FDG PET: differing metabolic activity in osteoblastic and osteolytic lesions. J Clin Oncol 1998;16(10):3375–3379. [DOI] [PubMed] [Google Scholar]
- 17.Tateishi U, Gamez C, Dawood S, Yeung HW, Cristofanilli M, Macapinlac HA. Bone metastases in patients with metastatic breast cancer: morphologic and metabolic monitoring of response to systemic therapy with integrated PET/CT. Radiology 2008;247(1):189–196. [DOI] [PubMed] [Google Scholar]
- 18.Fox JJ, Autran-Blanc E, Morris MJ, et al. Practical approach for comparative analysis of multilesion molecular imaging using a semiautomated program for PET/CT. J Nucl Med 2011;52(11):1727–1732. [DOI] [PMC free article] [PubMed] [Google Scholar]
- 19.Beattie BJ, Smith-Jones PM, Jhanwar YS, et al. Pharmacokinetic assessment of the uptake of 16beta-18F-fluoro-5alpha-dihydrotestosterone (FDHT) in prostate tumors as measured by PET. J Nucl Med 2010;51(2):183–192. [DOI] [PMC free article] [PubMed] [Google Scholar]
- 20.Upadhyay M, Samal J, Kandpal M, Singh OV, Vivekanandan P. The Warburg effect: insights from the past decade. Pharmacol Ther 2013;137(3):318–330. [DOI] [PubMed] [Google Scholar]
- 21.Yeh SD, Imbriaco M, Larson SM, et al. Detection of bony metastases of androgen-independent prostate cancer by PET-FDG. Nucl Med Biol 1996;23(6):693–697. [DOI] [PubMed] [Google Scholar]
- 22.Shreve PD, Grossman HB, Gross MD, Wahl RL. Metastatic prostate cancer: initial findings of PET with 2-deoxy-2-[F-18]fluoro-D-glucose. Radiology 1996;199(3):751–756. [DOI] [PubMed] [Google Scholar]
- 23.Fox JJ, Morris MJ, Larson SM, Schöder H, Scher HI. Developing imaging strategies for castration resistant prostate cancer. Acta Oncol 2011;50(Suppl 1):39–48. [DOI] [PMC free article] [PubMed] [Google Scholar]
- 24.Morris MJ, Akhurst T, Larson SM, et al. Fluorodeoxyglucose positron emission tomography as an outcome measure for castrate metastatic prostate cancer treated with antimicrotubule chemotherapy. Clin Cancer Res 2005;11(9):3210–3216. [DOI] [PMC free article] [PubMed] [Google Scholar]
- 25.Meirelles GS, Schöder H, Ravizzini GC, et al. Prognostic value of baseline [18F] fluorodeoxyglucose positron emission tomography and 99mTc-MDP bone scan in progressing metastatic prostate cancer. Clin Cancer Res 2010;16(24):6093–6099. [DOI] [PMC free article] [PubMed] [Google Scholar]
- 26.Jadvar H. Molecular imaging of prostate cancer: PET radiotracers. AJR Am J Roentgenol 2012;199(2):278–291. [DOI] [PMC free article] [PubMed] [Google Scholar]