

In the current study, we focused on the role of the nonenhancing region (NER) of glioblastomas and showed that there are imaging phenotypic features related specifically to the NER—most notably the NER crossing the midline and relative cerebral blood volume of NER, which provide important prognostic information; these are complementary to clinical and genomic features and can improve models of patient prognosis.
Abstract
Purpose
To correlate patient survival with morphologic imaging features and hemodynamic parameters obtained from the nonenhancing region (NER) of glioblastoma (GBM), along with clinical and genomic markers.
Materials and Methods
An institutional review board waiver was obtained for this HIPAA-compliant retrospective study. Forty-five patients with GBM underwent baseline imaging with contrast material–enhanced magnetic resonance (MR) imaging and dynamic susceptibility contrast-enhanced T2*-weighted perfusion MR imaging. Molecular and clinical predictors of survival were obtained. Single and multivariable models of overall survival (OS) and progression-free survival (PFS) were explored with Kaplan-Meier estimates, Cox regression, and random survival forests.
Results
Worsening OS (log-rank test, P = .0103) and PFS (log-rank test, P = .0223) were associated with increasing relative cerebral blood volume of NER (rCBVNER), which was higher with deep white matter involvement (t test, P = .0482) and poor NER margin definition (t test, P = .0147). NER crossing the midline was the only morphologic feature of NER associated with poor survival (log-rank test, P = .0125). Preoperative Karnofsky performance score (KPS) and resection extent (n = 30) were clinically significant OS predictors (log-rank test, P = .0176 and P = .0038, respectively). No genomic alterations were associated with survival, except patients with high rCBVNER and wild-type epidermal growth factor receptor (EGFR) mutation had significantly poor survival (log-rank test, P = .0306; area under the receiver operating characteristic curve = 0.62). Combining resection extent with rCBVNER marginally improved prognostic ability (permutation, P = .084). Random forest models of presurgical predictors indicated rCBVNER as the top predictor; also important were KPS, age at diagnosis, and NER crossing the midline. A multivariable model containing rCBVNER, age at diagnosis, and KPS can be used to group patients with more than 1 year of difference in observed median survival (0.49–1.79 years).
Conclusion
Patients with high rCBVNER and NER crossing the midline and those with high rCBVNER and wild-type EGFR mutation showed poor survival. In multivariable survival models, however, rCBVNER provided unique prognostic information that went above and beyond the assessment of all NER imaging features, as well as clinical and genomic features.
© RSNA, 2014
Introduction
The contrast material–enhancing region (CER) in gliomas, particularly in high-grade gliomas, is considered to represent the most aggressive component of the tumor. When present, it is the target of most treatment regimens. The surrounding nonenhancing region (NER) in high-grade gliomas (excluding CER and cystic or necrotic components) usually consists of a mixture of infiltrative tumor and edema (1–3), which is difficult to differentiate with morphologic imaging. The composition and extent of NER are probably a reflection of the aggressiveness and invasiveness of the tumor and, hence, could potentially provide useful prognostic information.
Inclusion of assessment of fluid-attenuated inversion-recovery (FLAIR) signal intensity abnormality in the updated response criteria in neuro-oncologic imaging (4) is a recognition of the importance of the NER when monitoring treatment response. Yet, the morphologic features of the NER alone may prove insufficient to fully predict survival or treatment response. Functional imaging modalities, such as perfusion imaging, provide information about the vasculature and hemodynamic characteristics of NER, which may provide additional prognostic information about the biology of the tumor. Since most of the NER is left behind during surgical resection and most recurrences occur within the original treatment field (5–7), it is imperative to identify methods to study the remaining tissue noninvasively. Currently, imaging is the only technique that meets this need. Imaging biomarkers based on morphologic features and/or physiologic phenotype, such as relative cerebral blood volume of NER (rCBVNER), can provide this information preoperatively and noninvasively. We hypothesize that altered perfusion in the NER is associated with survival and provides unique prognostic information.
Previous studies based on the areas surrounding CER or NER regions of the tumor have focused on differentiating gliomas from metastatic lesions (8–10) or trying to delineate the exact tumor boundaries for surgical planning (11,12). Almost all extent-of-resection studies have focused on using the proportion of CER resection as the key prognostic feature (13–15). To our knowledge, there are no studies that have focused exclusively on NER to predict patient survival or prognosis, except recent literature in which fluorescence-guided surgery with 5-aminolevulinic acid was used (16).
The purpose of this study was to correlate patient survival with various morphologic imaging features and hemodynamic parameters (rCBVNER) obtained from the NER of GBM, with clinical and genomic markers.
Materials and Methods
Patient Characteristics
All patients in this retrospective study had been previously deidentified by The Cancer Genome Atlas (TCGA), a publicly available data set that contains no linkage to patient identifiers and is compliant with the Health Insurance Portability and Accountability Act; therefore, an institutional review board waiver was obtained. Ninety-eight patients with previously untreated GBM with imaging data uploaded on The Cancer Imaging Archive’s TCGA GBM collection (17) were reviewed. Forty-seven patients who did not undergo dynamic susceptibility contrast-enhanced T2*-weighted perfusion studies, five patients who were since excluded from the TCGA project, and one patient with a prior glioma diagnosis were excluded from this study. This study included 45 patients with untreated primary GBM who had the necessary preoperative perfusion images (from dynamic susceptibility contrast-enhanced T2*-weighted perfusion MR imaging performed at two different institutions between 1998 and 2007) and clinical and molecular data from TCGA (17,18). This is a subset of previously published cohorts (19), excluding five patients without necessary images for Visually Accessible Rembrandt Images (VASARI) feature assessment. All patients underwent surgical resection, and tumor specimens were collected as specified by TCGA biologic specimen methods (17,18). Seven of 30 patients at institution 1 underwent gross total resection (GTR), and 23 underwent subtotal resection. Information on the extent of resection was not available from institution 2. The exact imaging data set used in the creation of this manuscript can be obtained from The Cancer Imaging Archive by using a shared list. Instructions for doing this are available at http://cancerimagingarchive.net (17).
MR Imaging Morphologic Analysis
For each patient, three of four board-certified neuroradiologists (C.A.H., with 15 years of experience; A.F., with 22 years of experience; S.N.H., with 5 years of experience; and M.W., with 6 years of experience) independently scored the MR imaging features of the 45 GBM cases by using a controlled vocabulary system for human gliomas (VASARI) on a ClearCanvas workstation (ClearCanvas, Toronto, Ontario, Canada) and an electronic case report form with methods described previously (20–25). For this study, the following seven cardinal features from the VASARI MR imaging feature set that describe the NER of the tumor were included: proportion of NER, proportion of edema, definition of NER margins, T1/FLAIR ratio, deep white matter involvement, NER crossing of the midline, and NER area (26). Because of the sparseness of categories, some levels were combined, as shown in Table 1.
Table 1.
Association of Predictors with Differences in Mean rCBVNER across Predictor Levels Assessed with One-Way Analysis of Variance
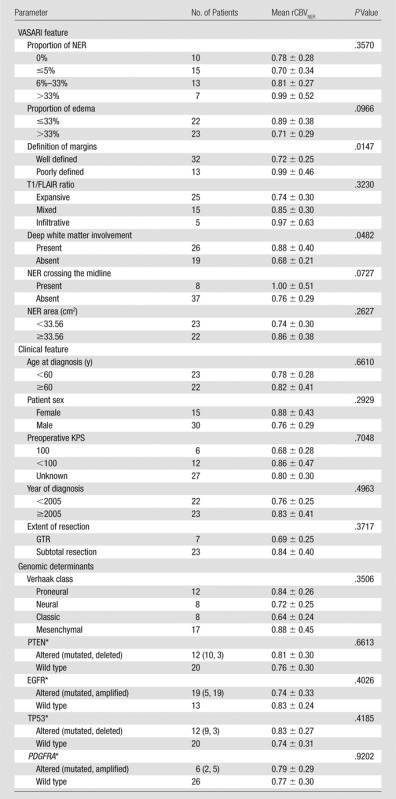
Note.—Mean rCBVNER is presented as mean value ± standard deviation. Numbers in parentheses are the numbers of patients with specific genomic alterations, respectively. PDGFRA = platelet-derived growth factor receptor, alpha polypeptide, PTEN = phosphatase and tensin homolog, TP53 = tumor protein p53.
n = 41 with copy number variation data, n = 36 with mutation data, n = 32 with both; associations with rCBVNER were made with n = 32 by comparing any alteration versus no alteration.
MR Perfusion: Image Acquisition and Postprocessing
At institution 1, studies were performed with either 1.5-T (n = 16) or 3-T Signa Excite (n = 14) units (GE Medical Systems, Milwaukee, Wis). Studies from institution 2 were performed with a 1.5-T Genesis Signa unit (GE Medical Systems) (19). All images were processed by using NordicICE software (NordicImagingLab, Bergen, Norway) with the U.S. Food and Drug Administration–approved dynamic susceptibility contrast-enhanced T2*-weighted perfusion module, which corrects for contrast agent leakage from the intravascular to extracellular space with the method published by Boxerman et al (27). Leakage-corrected relative cerebral blood flow (rCBV) maps were normalized to a globally determined mean value. (Postprocessed images can be retrieved from the TCGA GBM image collection of The Cancer Imaging Archive [17]).
MR Perfusion Parametric Map Analysis
All regions of interest were drawn by two authors (one a board-certified neuroradiologist with more than 9 years of experience in perfusion imaging and the other a trained radiologist and research fellow) in consensus, who were blinded to the morphologic data on the rCBV maps fused with postcontrast T1-weighted images and FLAIR images, as published previously (19). Mean rCBV of CER (rCBVCER), maximum rCBVCER, and rCBVNER were measured from the rCBV maps and were used in the analysis as continuous measures and dichotomized into groups with high and low values, by splitting at the respective median levels. For measuring mean rCBVCER, regions of interest were drawn on the CER of the tumor (excluding any areas of necrosis and vessels) on all of the sections that contained the tumor portion defined as CER, and a mean of these values was obtained. For measuring maximum rCBVCER, a region of interest of 10 × 10 voxels was placed on the part of the tumor with the highest rCBV, on the basis of the qualitative perfusion maps. Three regions of interest of 10 × 10 voxels were placed on areas of nonenhancing FLAIR abnormality within 1 cm of the edge of the enhancing region, defined as the NER; the mean of these values constituted the rCBVNER.
Molecular Data
Genomic alterations were obtained, when available, for each of the 45 samples via the cBIO Genomics Portal (http://www.cbioportal.org, accessed November 21, 2012). Of these 45 samples, 41 had mutation information, 36 had copy number information, and 32 had both types of data. We gathered information for endothelial growth factor receptor (EGFR), phosphatase and tensin homolog (PTEN), tumor protein p53 (TP53), and platelet-derived growth factor receptor, alpha polypeptide (PDGFRA). Other genes in which genomic alteration has been found to be associated with GBM were not well represented in our data. Additionally, 43 of 45 samples had glioma-CpG island methylator phenotype classification, one of which was positive. Molecular classifications according to Verhaak et al were obtained from another publication (28, 29).
Clinical Parameters
Preoperative Karnofsky performance score (KPS), as categorized in Table 1, was obtained from the TCGA clinical file, along with age at diagnosis, year of diagnosis, and survival times. Because treatment regimens are complex and have evolved within the past decade, the year of diagnosis was used (in years since 2000) as a proxy for the standard of care.
Statistical Analysis
Associations between rCBVNER and the clinical, morphologic, and genomic parameters were tested by using analysis of variance, with box plots drawn for illustration. Survival analysis was conducted by using Cox regression for continuous and multivariable models, with the significance of the model determined by using the likelihood ratio test. Hazard ratios and associated P values were also reported. Kaplan-Meier survival curves and log-rank tests were used to compare curves with categorical predictors. Overall survival (OS) was defined as the time from diagnosis until either death or the time the patient was last known to be alive (censored). Progression-free survival (PFS) was defined as the time from diagnosis until tumor progression, recurrence, death, or the time the patient was last known to be alive. The random survival forest method was used to determine variable importance in multivariable models of survival (30–32). The forests were composed of 50 000 trees, with at least three samples retained in a terminal node. Relative importance scores were used to rank prognostic variables, and representative trees were constructed from variables that showed the highest importance. The predictive value of the parameters associated with survival was described by using the area under a time-dependent receiver operating characteristic curve (AUC) for prediction of survival at 1 year (33). Significance of change in AUC was determined by comparison with the results from 1000 permutations of the survival time. Analysis was performed with the R statistical package (R Foundation, Vienna, Austria) by using the “survival” (v 2.37–4), “randomSurvivalForest” (v 3.6.3) (30,31), “rpart” (v 4.1–1), and “risksetROC” (v 1.04) (34) packages. Significant differences were determined by using a level of P < .05. No adjustment was made for multiple comparisons in this exploratory work.
Results
Prognostic Value of rCBVNER Relative to Other Imaging Features
In this study, we observed that worsening OS and PFS were each associated with increasing rCBVNER (Fig 1, Table 2). By considering rCBVNER as a continuous predictor, we found that the risk of death increased by 0.59% for every 1–standard deviation increase in rCBVNER for OS (hazard ratio, 1.59; P = .041). The risk of progression or death was estimated to increase by 0.33% per 1–standard deviation increase in rCBVNER, although the finding is not significant (hazard ratio, 1.33; P = 0.17).
Figure 1a:

Graphs of survival estimates demonstrate that rCBVNER is a significant predictor of (a) OS (log-rank test, P = .0103) and (b) PFS (log-rank test, P = .0223). rCBVNER is dichotomized at the median observed value.
Table 2.
Association of rCBV, VASARI, and Clinical and Genomic Predictors with Survival (OS and PFS) by Using Cox Regression (Hazard Ratio) and Log-Rank Tests
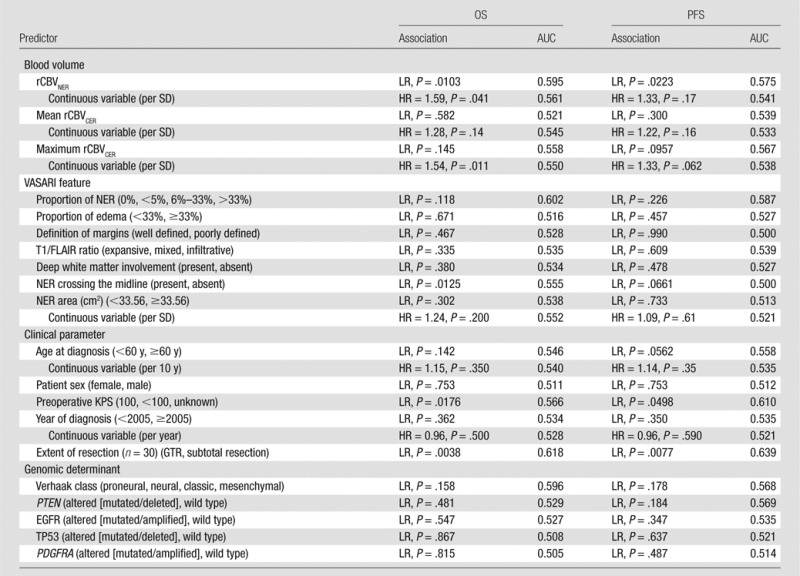
Note.—Time-dependent AUC is given for survival at 1 year. HR = hazard ratio, LR = log-rank test, PDGFRA = platelet-derived growth factor receptor, alpha polypeptide, PTEN = phosphatase and tensin homolog, SD = standard deviation, TP53 = tumor protein p53.
Figure 1b:

Graphs of survival estimates demonstrate that rCBVNER is a significant predictor of (a) OS (log-rank test, P = .0103) and (b) PFS (log-rank test, P = .0223). rCBVNER is dichotomized at the median observed value.
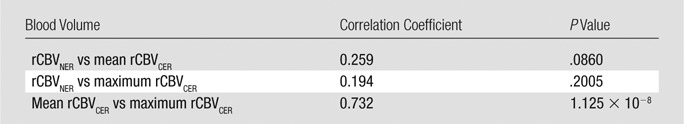
rCBVNER was not strongly correlated with either mean rCBVCER or maximum rCBVCER (Table 3), which suggests that it offers unique information. Alone, maximum rCBVCER was a significant predictor of OS (hazard ratio, 1.54; P = .011), but mean rCBVCER was not (hazard ratio, 1.28; P = .14) (Table 2). In a joint model, maximum rCBVCER (hazard ratio, 1.46; P = .028) was significantly associated with OS, and rCBVNER (hazard ratio, 1.50; P = .087) was marginally associated with OS (likelihood ratio test, P = .024). The joint model with mean rCBVCER (hazard ratio, 1.16; P = .37) and rCBVNER (hazard ratio, 1.50; P = .092) was marginally associated with OS (likelihood ratio test, P = .106) (Fig E1 [online]). Interestingly, rCBVNER maintained a hazard ratio of similar magnitude to the single parameter model (hazard ratio, 1.59), suggesting it provides independent information in the joint prognostic models. The joint models did not show significant association with PFS (P > .1, Fig E1 [online]).
Table 3.
Spearman Correlation Coefficients for the rCBV Measures with P Values from a Test of Nonzero Correlation
Of the VASARI NER features considered, tumors with deep white matter involvement tended to have higher rCBVNER (Fig E2a [online]; t test, P = .0482). Tumors with a poorly defined NER margin tended to have higher rCBVNER relative to that of well-defined tumors (Fig E2b [online]; t test, P = .0147). There was no association between rCBVNER and the other morphologic features (Table 1, P > .05). The prognostic value of the VASARI NER features was considered, and it was found that only having the NER crossing the midline was associated with shorter OS and was marginally associated with shorter PFS (log-rank test, P = .0125 and P = .0661, respectively; Fig E3a, E3b [online]). The other VASARI NER features were not associated (log-rank test, P > .1) with OS or PFS (Table 2).
Information Provided by rCBVNER in Clinical and Molecular Models of Prognosis
As expected, preoperative KPS and extent of resection were associated with OS (log-rank test, P < .05; Table 2). There was no association between GTR and rCBVNER (t test, P = .3713), and none of the gross total resections had tumor crossing the midline. Gross total resection of the contrast-enhancing portion of tumor was associated with a favorable prognosis (OS AUC = 0.62) and correlated with 1-year survival (Fig 2). rCBVNER alone was less sensitive but more specific than GTR (OS AUC = 0.61, n = 30). Consideration of a joint model with rCBVNER and GTR combined these complementary features and improved the prognostic value (OS AUC = 0.69). This difference was marginally significant at P = .084.
Figure 2:

Receiver operating characteristic curves are shown for rCBVNER (dichotomous, likelihood ratio test, P = .0122; AUC = 0.61), extent of resection (GTR or subtotal resection, likelihood ratio test, P = .002; AUC = 0.62), and the joint model (likelihood ratio test, P = .0006; AUC = 0.69) (n = 30). AUC was determined for 1-year survival. Sensitivity and specificity for the single dichotomous variable models can be read at the bend in the receiver operating characteristic curve.
In this study sample, we did not find any significant association with the four Verhaak molecular subclasses of GBM (35) and survival. When looking individually at genomic alterations (phosphatase and tensin homolog alteration [mutation or deletion]), tumor protein p53 alteration (mutation or deletion), PDGRFA alteration (mutation or amplification), and EGFR alteration (mutation or amplification), having alterations in any one of these sites was not associated with OS or PFS (Table 2). Combining EGFR with rCBVNER, we found a significant association with OS (log-rank test, P = .0306; AUC = 0.62), with worst survival in the high-rCBVNER wild-type EGFR group (Fig E4a [online]). There was marginal association with PFS in the joint model of EGFR and rCBVNER (log-rank test, P = .0692; AUC = 0.61), and Cox regression showed that the difference was dominated by the rCBVNER measure (Fig E4b [online]). Joint models with rCBVNER and the other genetic alterations were not significant (Fig E4c, E4d [online]).
Contribution of rCBVNER in Preoperative Multivariable Models of Survival
Random survival forests were used to rank preoperatively obtained factors for importance in prognostic classification. We first considered models with only the three rCBV measures (dichotomized) and the morphologic features of the NER, as described earlier. For our study, rCBVNER was found to be the most important predictor of OS, with NER crossing the midline and the T1/FLAIR ratio being the other positive predictors, with under 30% relative importance (Fig E5a [online]). Generation of a single tree from this forest by using only these top three predictors (rCBVNER, NER crossing the midline, and T1/FLAIR ratio) caused rCBVNER to be selected as the primary split and T1/FLAIR ratio as a secondary split for those with high rCBVNER (Fig 3a). There was a difference in median survival between the highest and lowest groups in stratifications of 1.15 years (AUC = 0.59). Use of NER crossing the midline as the secondary split also caused the groups to be separated, with a difference in median survival of 1.10 years between the low-rCBVNER group and the high-rCBVNER group with crossing (AUC = 0.57) (Fig 3b). All but one person with NER crossing the midline were also in the mixed or infiltrative T1/FLAIR ratio group, so these divisions were similar. A random survival forest for PFS again showed rCBVNER to be the most important predictor, with the proportion of NER and presence of NER crossing the midline being the other positive predictors, each with less than 20% relative importance as compared with rCBVNER. No improvement of PFS was attained by joint models with rCBVNER and either proportion of NER (AUC = 0.553) or NER crossing the midline (AUC = 0.564) beyond rCBVNER alone (AUC = 0.575) (Fig E3d [online]).
Figure 3a:

Graphs depict survival classification after random survival forest ranking of potential predictors. (a) A representative tree to consider only rCBV and VASARI features caused rCBVNER to be selected first and then the T1/FLAIR ratio to split the high-rCBVNER subset (Kaplan-Meier curves, log-rank test, P = .0165). (b) Allowing NER crossing of the midline to define the split of the high-rCBVNER subset also provides a significant separation of survival curves (Kaplan-Meier curves, log-rank test, P = .0067). (c) A representative tree to consider rCBV, VASARI features, and preoperative clinical parameters caused rCBVNER to be selected first and then KPS to split the low-rCBVNER subset and age to split the high-rCBVNER subset (Kaplan-Meier curves, log-rank test, P = .0003).
Figure 3b:

Graphs depict survival classification after random survival forest ranking of potential predictors. (a) A representative tree to consider only rCBV and VASARI features caused rCBVNER to be selected first and then the T1/FLAIR ratio to split the high-rCBVNER subset (Kaplan-Meier curves, log-rank test, P = .0165). (b) Allowing NER crossing of the midline to define the split of the high-rCBVNER subset also provides a significant separation of survival curves (Kaplan-Meier curves, log-rank test, P = .0067). (c) A representative tree to consider rCBV, VASARI features, and preoperative clinical parameters caused rCBVNER to be selected first and then KPS to split the low-rCBVNER subset and age to split the high-rCBVNER subset (Kaplan-Meier curves, log-rank test, P = .0003).
We next considered variable importance scores for the three rCBV measures (dichotomized), the morphologic features of the NER, and the preoperatively obtained clinical features described earlier. The rCBVNER measure and having a KPS of 100 were the top predictors of OS (Fig E5b [online]). Presence of NER crossing the midline and age tended to hold the third and fourth ranks, with Verhaak class and cohort also being informative, depending on the run of the model. A tree constructed from these six predictors caused rCBVNER to be selected as the primary split, and then the low-rCBVNER group was further divided by KPS status being known or unknown, and the high-rCBVNER group was divided by age of diagnosis (split at 60 years). There was a 1.3-year difference in median survival between the low-rCBVNER with known KPS group (1.79 years) and high-rCBVNER with age of 60 years and older at diagnosis group (0.49 years) (Fig 3c). The trend holds if we split the low-rCBVNER group at KPS of 100 versus KPS of less than 100 or unknown. In this case, the low-rCBVNER with KPS of 100 group had median survival estimated at 4.1 years, but there were only five persons in this group.
Figure 3c:

Graphs depict survival classification after random survival forest ranking of potential predictors. (a) A representative tree to consider only rCBV and VASARI features caused rCBVNER to be selected first and then the T1/FLAIR ratio to split the high-rCBVNER subset (Kaplan-Meier curves, log-rank test, P = .0165). (b) Allowing NER crossing of the midline to define the split of the high-rCBVNER subset also provides a significant separation of survival curves (Kaplan-Meier curves, log-rank test, P = .0067). (c) A representative tree to consider rCBV, VASARI features, and preoperative clinical parameters caused rCBVNER to be selected first and then KPS to split the low-rCBVNER subset and age to split the high-rCBVNER subset (Kaplan-Meier curves, log-rank test, P = .0003).
By using the random survival forest model, rCBVNER was found to be the most important predictor of PFS, followed by KPS and year of diagnosis. NER crossing the midline, Verhaak subclassifiers, and deep white matter involvement were also important predictors of PFS, depending on the run of the model. By using these six predictors to construct a representative tree, rCBVNER was selected as the primary split, and then the low-rCBVNER group was further divided by KPS, as with OS, but the high-rCBVNER group was divided by year of diagnosis being split at 2003 (AUC = 0.57). There was a 6-month difference in median PFS between the low-rCBVNER with known KPS group (0.77 years) and the high-rCBVNER with diagnosis prior to 2003 group (0.25 years) (Fig E6 [online]).
Discussion
In our previous work (19), we specifically looked at the defined molecular subclasses of GBM (28,29), focusing on the hemodynamic assessment of the enhancing component of GBM. We found increased maximum rCBVCER to be associated with increased risk of death, as we also did here (log-rank test, P = .011). In the current study, we focused on the role of the NER of GBMs and showed that there are imaging phenotypic features related specifically to the NER, most notably NER crossing the midline and rCBVNER, which provide important prognostic information. These are complementary to clinical and genomic features and can improve models of patient prognosis. rCBVNER is unique (Table 2) and independent (Fig E1 [online]) with respect to the rCBVCER measures.
The hemodynamic parameter rCBVNER is an important prognostic imaging biomarker that provides information independent of the morphologic features of the NER. Joint models that include rCBVNER and morphologic, clinical, and even genomic markers appear to improve the ability to predict OS and PFS, as compared with assessing each parameter individually. Most notable is that rCBVNER increases the predictive ability of the treatment parameter extent of resection to an AUC of 0.69, compared with 0.62 for GTR alone. By considering only preoperative predictors, rCBVNER was found to be the top or second most important predictor of both OS and PFS according to our random survival forest models. Preoperative KPS and presence of NER crossing the midline were also found to be important predictors for both OS and PFS.
Most of the literature on imaging assessment of NER in tumors has focused on differentiating gliomas from metastatic tumors (8–10,35), since gliomas infiltrate surrounding tissues beyond the CER, unlike metastases (9,10). A comprehensive imaging-genomic analysis of human GBM by using quantitative MR imaging volumetrics and large-scale genetic and microRNA expression profiles demonstrated the potential for molecular subtyping based on FLAIR (or NER) signal intensity abnormality (36). In a study of high-grade gliomas, Pope et al analyzed 15 imaging variables obtained from contrast-enhanced MR images and showed that the presence of non–contrast-enhancing tumor was one of the three variables associated with survival (37). However, none of these investigators assessed the correlation of NER imaging features exclusively with patient survival, and, in particular, none combined the morphologic and hemodynamic imaging features with clinical parameters and genomic features to create a more refined prognostic model, as was done in the current study. Most of the prior investigations involving extent of tumor resection also concentrated on the role of the CER in the prediction of survival.
Because conventional GBM treatment plans concentrate on the successful debulking of the tumor and radiation treatment and response of the CER, our new results that show the importance of the NER could have important therapeutic implications in the future. A growing body of evidence suggests that extent of tumor resection plays a key prognostic role in patients with GBM (13–15). Complete resection, defined as the absence of CER tumor at MR imaging, is the ideal surgical result associated with better outcome and patient survival. Given the infiltrative nature of these tumors, limitations of resection in or near eloquent brain regions, and difficulty in achieving tumor-free surgical margins, curative surgery is rarely achievable in GBMs. The degree of tumor invasion is variable, and postmortem studies have shown that 20% and 27% of GBMs have infiltrating cells less than 1 cm from the edge of gross tumor; 20% have invasion more than 3 cm from the gross tumor, and 8% show disseminated spread (1–3).
Fluorescence-guided surgery with 5-aminolevulinic acid is a method to intraoperatively mark infiltrative tumor extending beyond CER, and this technique has been helpful in improving the extent of resection in GBM (38,39). It has been shown with selective tissue sampling that fluorescent signal intensity can extend beyond the CER (40). A recent study has in fact shown that patients with GBM who have undergone complete resection of CER and have no residual fluorescent tissue had longer OS than patients with residual fluorescent tissue (16). This underscores the fact that addressing the NER in addition to the CER has a role in improving patient survival.
Typically, once the CER of a tumor has been removed, recurrence mostly develops at the site of primary CER or in the remaining NER, particularly in high-grade gliomas. Our results suggest that routine surveillance of the NER is paramount to prediction of recurrent disease. Noninvasive evaluation of the NER imaging biomarkers, especially physiologic biomarkers, may aid treatment decisions on aggressive resection beyond CER margins, when feasible, or postoperative adjuvant radiation to target the remaining NER.
Although we had 45 samples, some features were not well represented, and, thus, comparisons of their prognostic ability were limited. We additionally found that preoperative KPS was not recorded for more than half of the cases. However, we feel that absence of these data is not random and may be a proxy for enrollment in a clinical trial. Additionally, these findings are preliminary on the basis of this single study and must be validated in a larger clinical population, where postsurgical treatment can also be included directly.
In summary, assessment of the imaging phenotype of NER in GBM provides important prognostic information that could be complementary to clinical and genomic markers. In particular, the perfusion parameter rCBVNER is a unique prognostic marker that could help refine existing conventional prognostic models in patients with GBM. This additional prognostic information could affect how this group of highly aggressive tumors is treated in the future.
Advances in Knowledge
■ Morphologic and physiologic imaging features from the nonenhancing region (NER) of a glioblastoma (GBM) provide important prognostic information; patients with NER crossing the midline and high relative cerebral blood volume of NER (rCBVNER) showed poor survival.
■ rCBVNER of a GBM is not strongly correlated with the maximum relative cerebral blood volume of the enhancing component (ρ = 0.19, P = .20), and in joint models of survival it retains an increased risk of death (hazard ratio ≥ 1.5 on a standardized scale, P = .08), making it a unique and independent prognostic biomarker.
■ Patients with high rCBVNER and wild-type epidermal growth factor receptor mutation also showed poor survival.
Implications for Patient Care
■ In vivo imaging biomarkers and especially perfusion parameters derived from the NER could provide noninvasive and unique prognostic information about tumor aggressiveness and biology that is not accessible through conventional histologic grading or with clinical or genomic biomarkers.
■ Clinical focus on the NER of GBM could potentially change how patients are treated and may especially provide an impetus to treat beyond surgical resection of only the contrast-enhancing lesion component, which is the current standard of care, to provide a better chance of tumor control and treatment response.
■ NER of GBMs has important imaging phenotypic features that are complementary to clinical and genomic features and can improve models of patient prognosis.
SUPPLEMENTAL FIGURES
Acknowledgments
Acknowledgments
We thank Susan MacPhee-Gray and Leo Wolansky, MD, for their help with manuscript editing and reformatting, and Jayant Narang, MD, for his help with data processing.
Received August 16, 2013; revision requested September 18; revision received December 20; accepted January 10, 2014; final version accepted January 20.
Current address: Department of Radiology, New York University School of Medicine, 660 1st Ave, New York, NY 10016
Current address: MD Anderson Cancer Center, Houston, Tex
Funding: This research was supported by the National Institutes of Health (grant HHSN261200800001E).
Disclosures of Conflicts of Interest: L.M.P. No relevant conflicts of interest to disclose. R.J. Financial activities related to the present article: none to disclose. Financial activities not related to the present article: author received payment from Medscape Education for development of educational presentations. Other relationships: none to disclose. D.G. No relevant conflicts of interest to disclose. L.S. No relevant conflicts of interest to disclose. S.N.H. No relevant conflicts of interest to disclose. C.A.H. No relevant conflicts of interest to disclose. M.W. Financial activities related to the present article: none to disclose. Financial activities not related to the present article: author received grants from GE Healthcare and Philips Healthcare. Other relationships: none to disclose. A.R. No relevant conflicts of interest to disclose. R.R.C. No relevant conflicts of interest to disclose. J.K. Financial activities related to the present article: none to disclose. Financial activities not related to the present article: author owns stock in Myriad Genetics. Other relationships: none to disclose. J.F. No relevant conflicts of interest to disclose. C.C.J. No relevant conflicts of interest to disclose. T.M. No relevant conflicts of interest to disclose. A.F. No relevant conflicts of interest to disclose.
Abbreviations
- AUC
- area under the receiver operating characteristic curve
- CER
- contrast material–enhancing region
- EGFR
- endothelial growth factor receptor
- FLAIR
- fluid-attenuated inversion-recovery
- GBM
- glioblastoma
- GTR
- gross total resection
- KPS
- Karnofsky performance score
- NER
- nonenhancing region
- OS
- overall survival
- PFS
- progression-free survival
- rCBV
- relative cerebral blood volume
- rCBVCER
- rCBV of CER
- rCBVNER
- rCBV of NER
- TCGA
- The Cancer Genome Atlas
- VASARI
- Visually Accessible Rembrandt Images
References
- 1.Scherer HJ. The forms of growth in gliomas and their practical significance. Brain 1940;63(1):1–35. [Google Scholar]
- 2.Burger PC, Heinz ER, Shibata T, Kleihues P. Topographic anatomy and CT correlations in the untreated glioblastoma multiforme. J Neurosurg 1988;68(5):698–704. [DOI] [PubMed] [Google Scholar]
- 3.Parsa AT, Wachhorst S, Lamborn KR, et al. Prognostic significance of intracranial dissemination of glioblastoma multiforme in adults. J Neurosurg 2005;102(4):622–628. [DOI] [PubMed] [Google Scholar]
- 4.Wen PY, Macdonald DR, Reardon DA, et al. Updated response assessment criteria for high-grade gliomas: response assessment in neuro-oncology working group. J Clin Oncol 2010;28(11):1963–1972. [DOI] [PubMed] [Google Scholar]
- 5.Chamberlain MC. Radiographic patterns of relapse in glioblastoma. J Neurooncol 2011;101(2):319–323. [DOI] [PubMed] [Google Scholar]
- 6.Dobelbower MC, Burnett Iii OL, Nordal RA, et al. Patterns of failure for glioblastoma multiforme following concurrent radiation and temozolomide. J Med Imaging Radiat Oncol 2011;55(1):77–81. [DOI] [PubMed] [Google Scholar]
- 7.McDonald MW, Shu HK, Curran WJ, Jr, Crocker IR. Pattern of failure after limited margin radiotherapy and temozolomide for glioblastoma. Int J Radiat Oncol Biol Phys 2011;79(1):130–136. [DOI] [PubMed] [Google Scholar]
- 8.Cha S, Knopp EA, Johnson G, Wetzel SG, Litt AW, Zagzag D. Intracranial mass lesions: dynamic contrast-enhanced susceptibility-weighted echo-planar perfusion MR imaging. Radiology 2002;223(1):11–29. [DOI] [PubMed] [Google Scholar]
- 9.Law M, Cha S, Knopp EA, Johnson G, Arnett J, Litt AW. High-grade gliomas and solitary metastases: differentiation by using perfusion and proton spectroscopic MR imaging. Radiology 2002;222(3):715–721. [DOI] [PubMed] [Google Scholar]
- 10.Chiang IC, Kuo YT, Lu CY, et al. Distinction between high-grade gliomas and solitary metastases using peritumoral 3-T magnetic resonance spectroscopy, diffusion, and perfusion imagings. Neuroradiology 2004;46(8):619–627. [DOI] [PubMed] [Google Scholar]
- 11.Lu S, Ahn D, Johnson G, Law M, Zagzag D, Grossman RI. Diffusion-tensor MR imaging of intracranial neoplasia and associated peritumoral edema: introduction of the tumor infiltration index. Radiology 2004;232(1):221–228. [DOI] [PubMed] [Google Scholar]
- 12.Price SJ, Gillard JH. Imaging biomarkers of brain tumour margin and tumour invasion. Br J Radiol 2011;84(Spec No 2):S159–S167. [DOI] [PMC free article] [PubMed] [Google Scholar]
- 13.Lacroix M, Abi-Said D, Fourney DR, et al. A multivariate analysis of 416 patients with glioblastoma multiforme: prognosis, extent of resection, and survival. J Neurosurg 2001;95(2):190–198. [DOI] [PubMed] [Google Scholar]
- 14.Sanai N, Berger MS. Glioma extent of resection and its impact on patient outcome. Neurosurgery 2008;62(4):753–764; discussion 264–266. [DOI] [PubMed] [Google Scholar]
- 15.Sanai N, Polley MY, McDermott MW, Parsa AT, Berger MS. An extent of resection threshold for newly diagnosed glioblastomas. J Neurosurg 2011;115(1):3–8. [DOI] [PubMed] [Google Scholar]
- 16.Aldave G, Tejada S, Pay E, et al. Prognostic value of residual fluorescent tissue in glioblastoma patients after gross total resection in 5-aminolevulinic acid-guided surgery. Neurosurgery 2013;72(6):925–920; discussion 920–921. [DOI] [PubMed] [Google Scholar]
- 17.Cancer Imaging Program via the Cancer Imaging Archive (TCIA) Web site . http://cancerimagingarchive.net/. Published November 22, 2013. Accessed February 26, 2014.
- 18.Cancer Genome Atlas Research Network . Comprehensive genomic characterization defines human glioblastoma genes and core pathways. Nature 2008;455(7216):1061–1068. [Published correction appears in Nature 2013;494(7438):506.] [DOI] [PMC free article] [PubMed] [Google Scholar]
- 19.Jain R, Poisson L, Narang J, et al. Genomic mapping and survival prediction in glioblastoma: molecular subclassification strengthened by hemodynamic imaging biomarkers. Radiology 2013;267(1):212–220. [DOI] [PMC free article] [PubMed] [Google Scholar]
- 20.Gutman DA, Cooper LA, Hwang SN, et al. MR imaging predictors of molecular profile and survival: multi-institutional study of the TCGA glioblastoma data set. Radiology 2013;267(2):560–569. [DOI] [PMC free article] [PubMed] [Google Scholar]
- 21.Cancer Biomedical Informatics Grid . Clearcanvas with the AIM plugin. National Cancer Institute Web site. https://gforge.nci.nih.gov. Accessed December 28, 2011.
- 22.New AS, Hazlett EA, Newmark RE, et al. Laboratory induced aggression: a positron emission tomography study of aggressive individuals with borderline personality disorder. Biol Psychiatry 2009;66(12):1107–1114. [DOI] [PMC free article] [PubMed] [Google Scholar]
- 23.Channin DS, Mongkolwat P, Kleper V, Rubin DL. The Annotation and Image Mark-up project. Radiology 2009;253(3):590–592. [DOI] [PubMed] [Google Scholar]
- 24.Channin DS, Mongkolwat P, Kleper V, Sepukar K, Rubin DL. The caBIG annotation and image Markup project. J Digit Imaging 2010;23(2):217–225. [DOI] [PMC free article] [PubMed] [Google Scholar]
- 25.Rubin DL, Mongkolwat P, Channin DS. A semantic image annotation model to enable integrative translational research. Summit on Translat Bioinforma 2009;2009:106–110. [PMC free article] [PubMed] [Google Scholar]
- 26.Vasari MRI. Visual Feature Guide. The Cancer Imaging Archive (TCIA) Web site. https://wiki.cancerimagingarchive.net/display/Public/VASARI+Research+Project. Published April 7, 2010. Accessed June 11, 2013.
- 27.Boxerman JL, Schmainda KM, Weisskoff RM. Relative cerebral blood volume maps corrected for contrast agent extravasation significantly correlate with glioma tumor grade, whereas uncorrected maps do not. AJNR Am J Neuroradiol 2006;27(4):859–867. [PMC free article] [PubMed] [Google Scholar]
- 28.Huse JT, Phillips HS, Brennan CW. Molecular subclassification of diffuse gliomas: seeing order in the chaos. Glia 2011;59(8):1190–1199. [DOI] [PubMed] [Google Scholar]
- 29.Verhaak RG, Hoadley KA, Purdom E, et al. Integrated genomic analysis identifies clinically relevant subtypes of glioblastoma characterized by abnormalities in PDGFRA, IDH1, EGFR, and NF1. Cancer Cell 2010;17(1):98–110. [DOI] [PMC free article] [PubMed] [Google Scholar]
- 30.Ishwaran H, Kogalur UB. Random survival forests for R. R News 2007;7:25–31. [Google Scholar]
- 31.Ishwaran H, Kogalur UB, Blackstone EH, Lauer MS. Random survival forests. Ann Appl Stat 2008;2(3):841–860. [Google Scholar]
- 32.Ishwaran H, Kogalur UB. RandomSurvivalForest: Random Survival Forests. R package version 3.6.3. http://cran.r-project.org/. Published 2010. Accessed February 26, 2014.
- 33.Heagerty PJ, Lumley T, Pepe MS. Time-dependent ROC curves for censored survival data and a diagnostic marker. Biometrics 2000;56(2):337–344. [DOI] [PubMed] [Google Scholar]
- 34.Heagerty PJ, Zheng Y. Survival model predictive accuracy and ROC curves. Biometrics 2005;61(1):92–105. [DOI] [PubMed] [Google Scholar]
- 35.Wang S, Kim S, Chawla S, et al. Differentiation between glioblastomas, solitary brain metastases, and primary cerebral lymphomas using diffusion tensor and dynamic susceptibility contrast-enhanced MR imaging. AJNR Am J Neuroradiol 2011;32(3):507–514. [DOI] [PMC free article] [PubMed] [Google Scholar]
- 36.Zinn PO, Mahajan B, Sathyan P, et al. Radiogenomic mapping of edema/cellular invasion MRI-phenotypes in glioblastoma multiforme. PLoS ONE 2011;6(10):e25451. [DOI] [PMC free article] [PubMed] [Google Scholar]
- 37.Pope WB, Sayre J, Perlina A, Villablanca JP, Mischel PS, Cloughesy TF. MR imaging correlates of survival in patients with high-grade gliomas. AJNR Am J Neuroradiol 2005;26(10):2466–2474. [PMC free article] [PubMed] [Google Scholar]
- 38.Schucht P, Beck J, Abu-Isa J, et al. Gross total resection rates in contemporary glioblastoma surgery: results of an institutional protocol combining 5-aminolevulinic acid intraoperative fluorescence imaging and brain mapping. Neurosurgery 2012;71(5):927–935; discussion 935–936. [DOI] [PubMed] [Google Scholar]
- 39.Stummer W, Pichlmeier U, Meinel T, et al. Fluorescence-guided surgery with 5-aminolevulinic acid for resection of malignant glioma: a randomised controlled multicentre phase III trial. Lancet Oncol 2006;7(5):392–401. [DOI] [PubMed] [Google Scholar]
- 40.Idoate MA, Díez Valle R, Echeveste J, Tejada S. Pathological characterization of the glioblastoma border as shown during surgery using 5-aminolevulinic acid-induced fluorescence. Neuropathology 2011;31(6):575–582. [DOI] [PubMed] [Google Scholar]
Associated Data
This section collects any data citations, data availability statements, or supplementary materials included in this article.