Abstract
Microbial metabolites such as short chain fatty acids (SCFAs) are highly produced in the intestine and potentially regulate the immune system. We studied the function of SCFAs in regulation of T cell differentiation into effector and regulatory T cells. We report that SCFAs can directly promote T cell differentiation into T cells producing IL-17, IFN-γ, and/or IL-10 depending on cytokine milieu. This effect of SCFAs on T cells is independent of GPR41- or GPR43 but dependent on direct histone deacetylase (HDAC) inhibitor activity. Inhibition of HDACs in T cells by SCFAs increased the acetylation of p70 S6 kinase and phosphorylation rS6, regulating the mTOR pathway required for generation of Th17, Th1, and IL-10+ T cells. Acetate (C2) administration enhanced the induction of Th1 and Th17 cells during C. rodentium infection but decreased anti-CD3-induced inflammation in an IL-10-dependent manner. Our results indicate that SCFAs promote T cell differentiation into both effector and regulatory T cells to promote either immunity or immune tolerance depending on immunological milieu.
Introduction
Gut commensal bacteria shape the gastrointestinal immune system and have profound effects on the adaptive immune system.1, 2 Commensal bacteria produce a number of metabolites that regulate physiology, nutrition, and immunity in the host.3, 4 Short chain fatty acids (SCFAs), including acetate (C2), propionate (C3), and butyrate (C4), are highly produced from dietary fibers and other undigested carbohydrates in the colon.5 SCFAs are absorbed into colonic epithelial cells through simple diffusion or active transportation via solute transporters. C4 mostly remains in and is utilized by the epithelial cells, whereas C2 and C3 are readily transported to other cells and organs.6, 7 SCFAs affect various aspects of gut physiology, barrier function, and metabolism.8 SCFAs regulate immune responses through their effects on a number of cell types including colonocytes, neutrophils, and T cells.9-11
Effector T cells, such as Th1 and Th17 cells, fight pathogens and can cause tissue inflammation.12-15 Regulatory T cells, such as IL-10+ T cells and FoxP3+ T cells, counter-balance the activities of effector immune cells. Importantly, the generation of both effector and regulatory T cells is profoundly influenced by gut microbiota.16-18 While SCFAs are linked to the expansion of colonic FoxP3+ T cells,10 the impact of SCFAs on regulation of effector T cells and non-FoxP3+ regulatory T cells is unclear. In this study, we investigated the roles of SCFAs in regulation of T cell differentiation into effector and IL-10+ regulatory T cells with the research focus on C2 and C3. Also investigated were the roles of cell surface SCFA receptors (GPR41 and GPR43) and intracellular signaling events mediating the SCFA effect. We found that SCFAs such as C2, C3, and C4 can selectively support the development of Th1 and Th17 effector cells and IL-10+ regulatory T cells depending on cytokine milieu and immunological context. We also provide insights into the intracellular signaling events regulated by SCFAs in T cells.
Results
C2 and C3 promote naïve T cell differentiation into Th1 or Th17 effector T cells depending on cytokine milieu
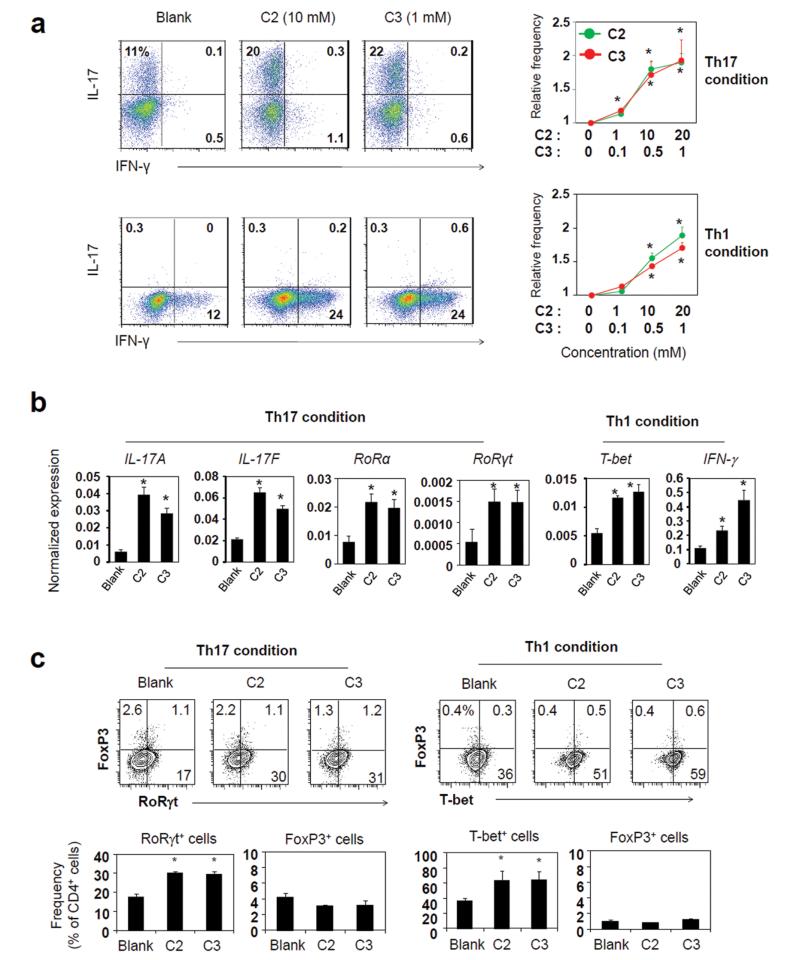
It is a question of interest if SCFAs can regulate the generation of effector T cells. To determine this, we differentiated naïve CD4+ T cells with C2 or C3 in vitro. C2 increased naïve T cell differentiation into Th17 cells in a dose-dependent manner (Fig. 1a). C3 had the same positive effect on Th17 cell generation. Induction of Th1 cells in the presence of IL-12 was also increased by C2 or C3 (Fig. 1a). Both C2 and C3 induced the transcription of the genes for IL-17A, IL-17F, RORα, RORγt, T-bet, and IFN-γ, which are characteristically associated with Th17 cells or Th1 cells (Figure 1b). The optimal concentrations for this effect were 5–20 (C2) and 0.5–1 (C3) mM. The T cells induced in the presence of C2 or C3 in a Th1 polarization condition had increased expression of T-bet protein, but did not express FoxP3 (Figure 1c). Similarly, the T cells induced in a Th17 polarization condition did not express FoxP3 in the standard anti-CD3 (5 mg/ml) activation condition. However, we observed that FoxP3 expression together with RORγt was significantly enhanced by C2 or C3 in a low anti-CD3 (1 μg/ml) activation condition (Fig. S1).
Fig. 1.
SCFAs promote the generation of Th17 and Th1 effector cells. (a)) Effects of C2 and C3 on naïve CD4+ T cell differentiation into Th17 and Th1 cells were determined. Naive CD4+ T cells, depleted of Treg (CD25+) and memory T (CD44+ CD69+) cells, were activated with anti-CD3/CD28 in a Th17 (IL-1β, IL-6, IL-21, IL-23, TGFβ1, anti-IL-4, and anti-IFN-γ) or Th1 (IL-12, IL-2, and anti-IL-4) condition for 5-6 days. C2 (0, 1, 10, and 20 mM) or C3 (0, 0.1, 0.5, and 1 mM) was added as indicated. (b) Expression patterns of T helper signature genes for Th1 and Th17 cells, generated in the presence of SCFAs, were determined by qRT-PCR. (c) Expression of FoxP3 by T-bet+ or RORγt+ T cells, generated in Th1 or Th17 condition in the presence of SCFAs. Cells were prepared in a Th17 or Th1 condition with C2 (10 mM) or C3 (1 mM). *Significant differences from blank groups (no treatment with C2 or C3) (P≤0.05).
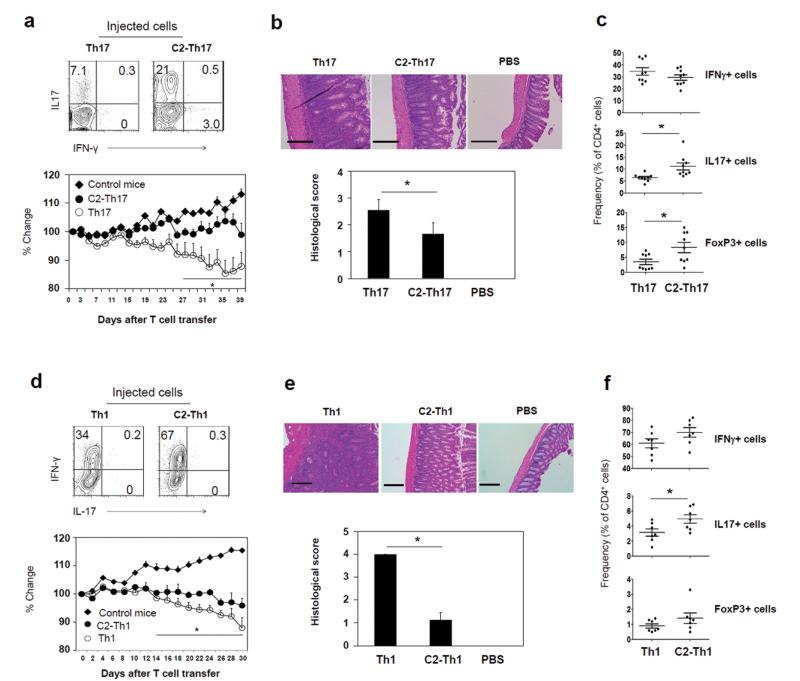
The function of SCFAs in inducing Th17 cells and Th1 cells is intriguing. We examined the colitogenic activity of the T cells, cultured in the presence of C2 in a Th17 polarization condition (C2-Th17 cells), in inducing tissue inflammation. We administered the cultured T cells into Rag1(−/−) mice. Unexpectedly, these T cells were not able to induce colitis as effectively as control T cells (Fig. 2a and b). Compared to control T cells, C2-treated T cells were less effective in decreasing body weight (Fig. 2a) and induced relatively mild inflammation in the colon despite the increased frequency of Th17 cells in the colon (Fig. 2b and c). The mild inflammation is in line with the increased frequency of FoxP3+ T cells in the colon of the mice injected with C2-treated T cells (Fig. 2c). Similar to the T cells cultured in a Th17 cell condition, C2-treated T cells prepared in a Th1 condition were less inflammatory despite increased Th1 and Th17 cells in the colon of the host mice (Fig. 2d, e and f). These results indicate that C2-treated T cells, while enhanced in expression of effector cytokines, are not highly inflammatory or would not become highly inflammatory cells in vivo.
Fig. 2.
The colitogenic activity of C2-treated T cells in Rag1(−/−) mice. (a) Cytokine profiles of cultured T cells in the presence or absence of C2 in a Th17 cell condition. Also shown is the weight change of Rag1(−/−) mice following injection of the cultured T cells. (b) Histological changes in the distal colon of Th17-transferred Rag1(−/−) mice were examined (×100 original magnification; scale bar = 200 μm), and histological scores indicating tissue inflammation are shown. (c) Frequencies of Th1, Th17, and FoxP3+ T cells in the colon of Th17-transferred Rag1(−/−) mice were determined by flow cytometry. Similarly, effector T cells induced in the absence or presence of C2 in a Th1 condition were assessed for their effects on (d) body weight change, (e) histological changes, and (f) frequencies of Th subsets. Representative or pooled data from 2-3 experiments are shown (n=5 for a; 10 for b; 9 for c; 6-7 for d; 4 for e; 6-7 for f). *Significant differences from the control group or between indicated groups (P≤0.05).
C2 and C3 induce IL-10-producing T cells admixed with effector T cells
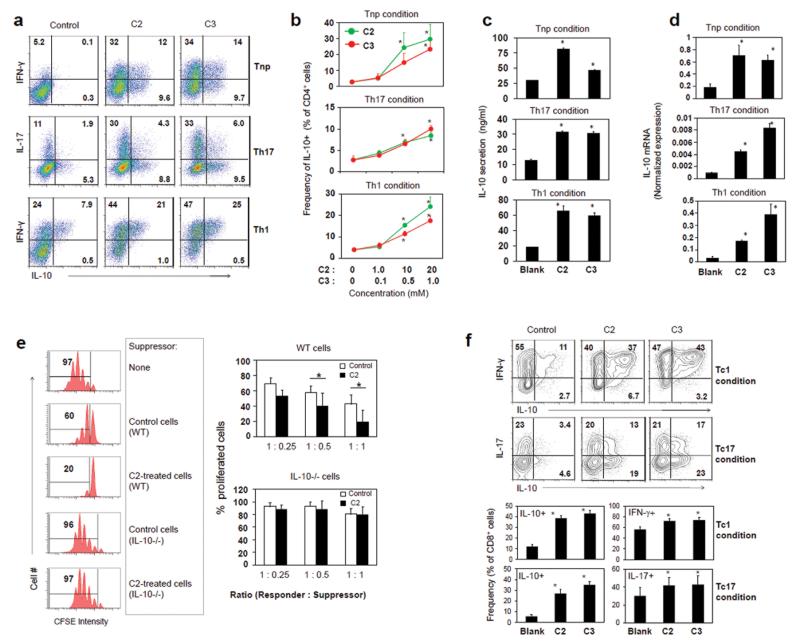
SCFAs can promote IL-10 expression in leukocytes and T cells,10, 19 and this may explain the relatively low inflammatory activity of C2-treated effector T cells. We examined the possibility that effector T cells admixed with IL-10-producing T cells are made in response to SCFAs. Expression of IL-10 in both intracellular and secreted forms was induced by C2 or C3 in all T cell polarization conditions (Tnp, Th17, and Th1) examined in this study (Fig. 3a-d). Many T cells co-expressed IL-10 and IFN-γ (Fig. 3a). IL-10 induction by SCFAs was also confirmed at the mRNA level (Fig. 3d). Most of these IL-10-producers induced in Tnp, Th1, or Th17 condition did not express FoxP3 (Fig. S2). Even the FoxP3+ T cells and IL-10+ T cells induced in a Th17 polarization condition with a low level of anti-CD3 (1 μg/ml) were distinct populations.
Fig. 3.
SCFAs induce IL-10-producing CD4+ or CD8+ T cells admixed with effector T cells. (a) The cytokine phenotype of CD4+ T cells cultured in Tnp, Th17, or Th1 condition with indicated SCFA was determined by flow cytometry. (b) Dose-dependent effects of C2 and C3 on the induction of IL-10+ CD4+ T cells. Conditioned media were examined for secreted IL-10 (c) and IL-10 mRNA (d). (e) The suppressive activity of control and C2-treated T cells on the proliferation of responder T cells was examined. Suppressor T cells were co-cultured with responder cells (CFSE-labeled CD4+CD25− T cells) in the presence of anti-CD3 and irradiated T-cell-depleted splenocytes as antigen presenting cells for 3 days before flow cytometric analysis. C2-treated suppressor T cells were prepared from the culture of naïve CD4+ T cells, isolated from WT or IL-10(−/−) mice, for 5-6 days in the presence of C2 (10 mM) in a Th1 cell-polarization condition. (f) SCFAs also induce expression of IL-10 in CD8+ T cells. Total CD8+ T cells were activated with anti-CD3/28 in a Tc1 (IL-2, IL-12, and anti-IL-4) or Tc17 (TGFβ1, IL-6, IL-1β, IL-23, IL-21, TNFα, anti-IL4, and anti-IFN-γ) polarization condition for 5-6 days. If not indicated, the concentrations of SCFAs were 10 mM (C2) or 1 mM (C3) for all experiments. Representative or pooled (b-f) data obtained from 3-4 experiments are shown. *Significant differences from blank groups or between indicated groups (P≤0.05).
Because of the high IL-10 expression by C2-treated T cells, we assessed their regulatory activity on responder T cells. C2-treated T cells were highly efficient in suppressing the proliferation of responder T cells (Fig. 3e). They were significantly more suppressive than control T cells. However, the C2-treated T cells prepared from IL-10 (−/−) mice were unable to suppress responder T cells (Fig. 3e), indicating the importance of IL-10 in the regulatory function of C2-treated T cells.
So far, we examined the SCFA effect on CD4+ T cells. A question of interest is if SCFAs impact other T cells such as CD8+ T cells. We found that SCFAs highly induced the expression of IL-10, IFN-γ, and IL-17 in CD8+ T cells in both Tc1- and Tc17-cell conditions (Fig. 3f).
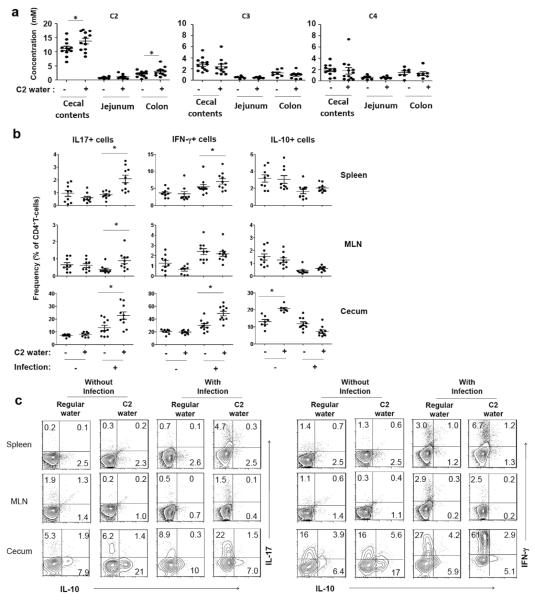
We fed mice with C2 in drinking water and found that this C2 feeding significantly increased C2 concentration in cecal contents and colon tissues (Fig. 4a). However, the C2 feeding did not alter C3 or C4 in cecal contents or intestinal tissues. C2 administration did not change the frequencies and numbers of Th17 and Th1 cells in a normal condition without infection. The positive impact of C2 feeding on clearance of C. rodentium has been determined,11 but the impact on induction of effector T cells during anti-C. rodentium infection has been unclear. We infected the C2-fed mice with C. rodentium to assess changes in effector T cells during an active immune response. While the C2 administration did not change the Th1 and Th17 cells in the absence of infection, it significantly changed the frequencies of Th1 and Th17 cells in the cecum during the infection (Fig. 4b, 4c and S3). These results indicate that SCFAs effectively promote effector T cells during an active immune response but not in the steady state.
Fig. 4.
Impact of infection on the SCFA effect on effector versus IL-10+ T cells. (a) The concentrations of SCFAs in cecal contents and intestine tissues of C2-fed mice were determined by LC-MS. (b and c) Some of the C2-fed mice were infected with C. rodentium. Changes in Th17, Th1, and IL-10+ T cells in indicated tissues 14 days after oral infection with C. rodentium were examined by flow cytometry. Pooled data (b; n=7-9) and representative dot plots (c) are shown. *Significant differences (P≤0.05).
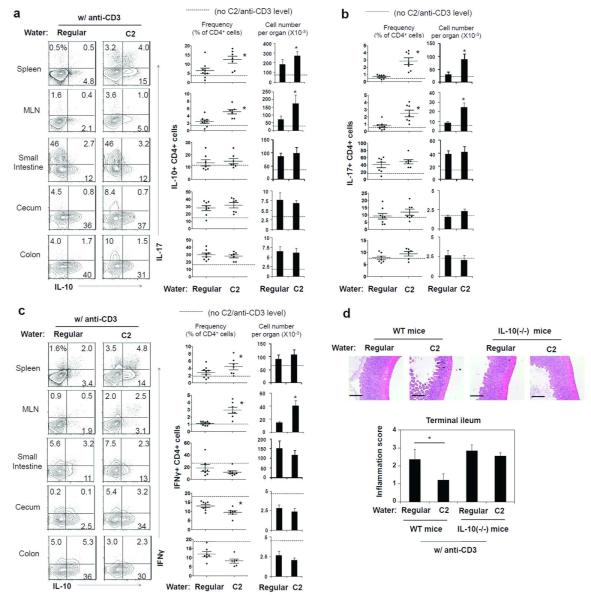
In contrast to Th1 and Th17 cells, IL-10+ CD4+ T cells were increased in frequency in the cecum but not the lymphoid tissues of C2-fed mice in the steady state (Fig. 4b and c). Interestingly, the infection with C. rodentium unexpectedly decreased IL-10+ T cells in the cecum. These results indicate that the SCFA effect on IL-10+ T cells can be modulated by an ongoing immune response.
Anti-CD3 injection (i.p.) induces inflammation in the intestine and also increases IL-10+ T cells.20, 21 We utilized this method to assess the booster effect of C2 on the anti-CD3-induced T cell differentiation and tissue inflammation. C2 administration increased the frequency of IL-10+ T cells and effector T cells (Th1 and Th17) in systemic sites such as spleen and MLN (Fig. 5a-c). The frequency and number of IL-10+ T cells in the colon was already high (~two times of the control mice) after anti-CD3 administration (i.p.) and was not further increased in C2-fed mice (Fig. 5a). Also, increased were Th17 cells and Th1 cells in the spleen and MLN but not the intestine (Fig. 5b and c). Anti-CD3 administration (i.p.) induced tissue hypertrophy and inflammation mainly in the terminal ileum. This inflammation in the ileum was noticeably decreased with C2 administration in drinking water (Fig. 5d). However, C2 was not significantly protective in anti-CD3-injected IL-10(−/−) mice, indicating a key role for IL-10 in mediating the suppressive C2 effect (Fig. 5d).
Fig. 5.
C2 feeding suppressed anti-CD3 induced inflammation in the intestine. (a-c) Mice were fed with C2 for 6-8 weeks, and anti-CD3 antibody (clone 145-2C11) was injected i.p. to stimulate the production of IL-10+ T cells (n=6-9/group). Mice were sacrificed 52 h after the injection of anti-CD3, and the frequencies and numbers of IL-10+ (a), Th17 (b), and Th1 (c) cells were examined by flow cytometry (6-9/group). (d) The inflammatory response in the terminal ileum of the mice fed with C2 and injected with anti-CD3 was examined. Tissue sections were stained with hematoxylin and eosin (×100 original magnification; scale bar= 200 μm). Pooled histological scores of the ileum of control and C2-fed mice (n=6-9/group) obtained from two experiments are shown. *Significant differences from the control group (regular water) or between indicated groups (P≤0.05).
The SCFA effect on T cells is independent of GPR41 or GPR43
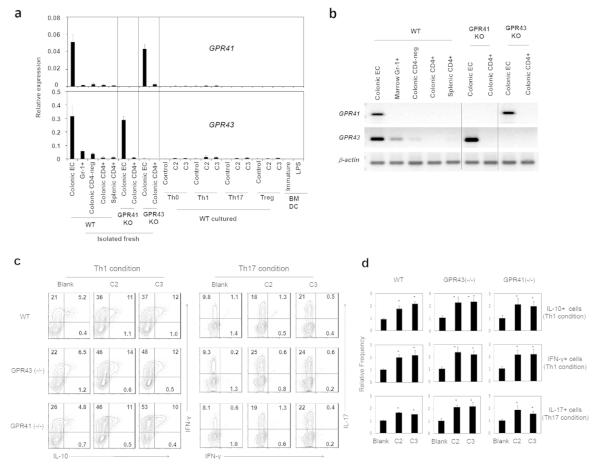
SCFAs activate G-protein-coupled receptors such as GPR41 and GPR43.22 It is a question of interest if GPR41 and GPR43 are required for the SCFA effect on T cells. Compared to colonic epithelial cells (which express GPR41 and GPR43) and GR-1+ cells (which express GPR43), the CD4+ T cells isolated from the colon and spleen did not express these genes at significant levels (Fig. 6a and b). Moreover, cultured CD4+ T cells (with or without SCFAs) and marrow-derived dendritic cells don’t express the receptors at significant levels (Fig. 6a).
Fig. 6.
T cells poorly express GPR41 and GPR43, and GPR41−/− or GPR43−/− T cells normally respond to C2 or C3. (a and b) Cultured CD4+ T cells, CD326+ colonic epithelial cells, colonic lamina propria CD4+ or CD4− (colonic CD4-neg) cells, bone marrow Gr-1+ cells, and in vitro differentiated BM-DCs were compared for expression of GRP41 and GPR43 mRNA with qRT-PCR (A) and conventional PCR (B). (c and d) In vitro differentiation of GPR41−/− or GPR43−/− CD4+ T cells in response to C2 or C3. Naive CD4+ T cells were cultured in Th1 or Th17 cell condition for 5-6 days with C2 (10 mM) or C3 (1 mM). Frequencies of indicated T cell subsets were determined by flow cytometry. Representative (c) and pooled (d) data obtained from 3 experiments are shown. *Significant differences (P≤0.05) from control groups.
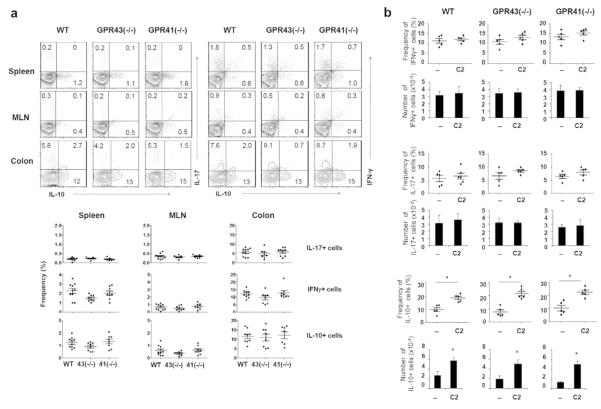
Utilizing the T cells isolated from the mice deficient in GPR41 or GPR43, we examined the function of these receptors in mediating the SCFA effect in vitro. The effect of SCFAs on inducing the expression of IL-10, IFN-γ, and/or IL-17 was intact in GPR41- or GPR43-deficient CD4+ T cells (Fig. 6c and d). We examined also the frequencies of IL-10+ T cells and effector T cells in various organs of GPR41- and GPR43-deficient mice (Fig. 7a). No significant difference among the mice in the frequencies of Th17, Th1, and IL-10+ T cells was observed. Moreover, the increase of IL-10+ T cells in response to C2 administration was not abolished in the GPR41- and GPR43-deficient mice (Fig. 7b). Thus, GPR41 and GPR43 are dispensable for the SCFA effect on T cell differentiation.
Fig. 7.
Normal production of effector and IL-10+ T cells in mice deficient in GPR41 or GPR43 with or without C2 feeding. (a) Mice were sacrificed at 6-9 weeks of age. Indicated T cell subsets in the spleen, MLN, and various compartments of the intestine were examined by flow cytometry. (b) Mice were fed with regular or C2 water from 3 weeks of age for 6-8 weeks. IFN-γ+, IL-17+, and IL-10+ CD4+ T cells in the colon were examined. Pooled data (n=7-10 for a; 5 for b) are shown. *Significant differences (P≤0.05) from control groups.
SCFAs inhibit HDACs in a GPR41/GPR43-independent manner and regulate p70 S6 kinase-rS6 in T cells
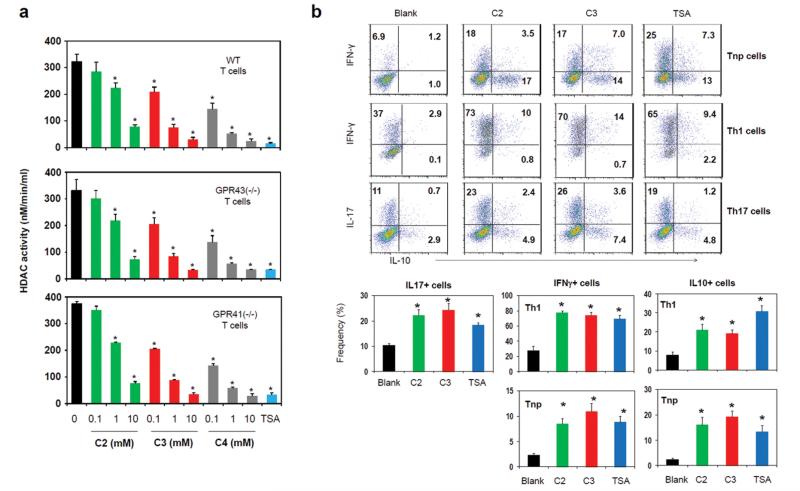
SCFAs can inhibit histone deacetylases (HDAC).23, 24 It has been recently reported that HDAC activity could be regulated in a GPR43-dependent manner.10 The concept that SCFA receptors are really involved in the inhibition of HDACs by SCFAs is questionable because SCFAs can bypass the surface receptors and enter cells to exert their inhibitory activity.25 Employing a cell-based HDAC assay where SCFAs have to enter T cells to inhibit HDACs, we assessed the need for GPR41 or GPR43 in inhibition of HDACs in T cells. As expected, activated CD4+ T cells had high HDAC activity (Fig. 8a), and TSA (a class HDAC I and II inhibitor) was effective in suppressing the HDAC activity in T cells. The HDAC activity in T cells was suppressed by C2, C3, and C4 in a dose-dependent manner. Interestingly, the HDAC inhibitor activity of SCFAs was not diminished in T cells deficient in GPR41 or GPR43 (Fig. 8a). We, next, tested if HDAC inhibition by TSA can affect T cell differentiation in a manner similar to C2 or C3. HDAC inhibition by TSA increased the expression of IL-10, IFN-γ and IL-17 in T cells (Fig. 8b). This indicates that the HDAC inhibition activity is sufficient to mediate the SCFA effect on T cells.
Fig. 8.
SCFAs suppress HDACs in a GPR41 or GPR43-independent manner. (a) In-cell HDAC inhibitor activity. T cells were activated for 48 h, pre-incubated with SCFAs or TSA for 2 h, and then assayed for HDAC activity. (b) Comparison of TSA and SCFAs in regulation of T cell differentiation into effector and IL-10+ T cells. Naïve CD4+ T cells were cultured for 5 days in the presence of indicated SCFAs or TSA. Pooled data from three independent experiments are shown. *Significant differences (P≤0.05) from control groups.
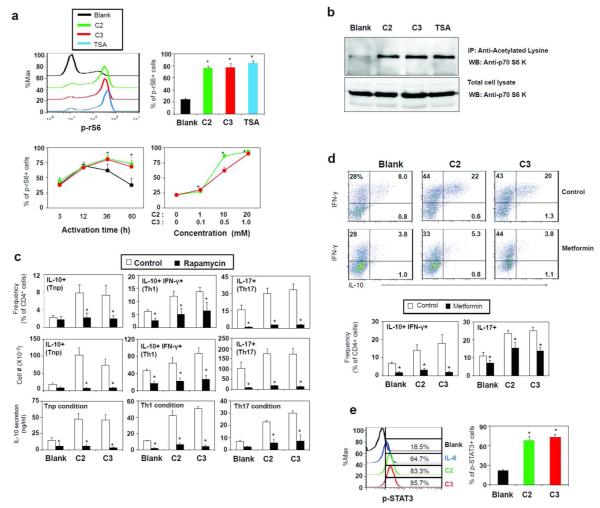
The mTOR pathway is a key integrator of nutrient, energy, and metabolic status and controls T cell differentiation.26-28 We examined if SCFAs or HDAC inhibition can alter the activity of the mTOR pathway to affect T cell differentiation and cytokine phenotype. Both SCFAs (C2 and C3) and TSA greatly enhanced the phosphorylation of the ribosomal protein S6 (rS6), a major target of the mTOR pathway (Fig. 9a). Phosphorylation of rS6 due to T cell activation normally peaks at 12 h and goes down by 60 h, but it was highly sustained with C2 or C3 (Fig. 9a). These results led us to examine p70 S6 kinase (S6K), which phosphorylates rS6. Acetylation of S6K at lysine 516 is induced by co-activator p300/CBP and HDAC inhibitors,29, 30 and this could provide a potential regulatory point for the mTOR pathway. C2, C3 and TSA, all induced the acetylation of S6K in T cells (Fig. 9b).
Fig. 9.
SCFAs enhance mTOR activity. (a) Activation of the mTOR pathway based on rS6 phosphorylation in CD4+ T cells. T cells were activated with anti-CD3/CD28 and IL-2 in the presence or absence of C2 or C3 and examined by flow cytometry. (b) Acetylation of S6K in activated T cells in the presence of C2, C3 or TSA. The antibodies used for immunoprecipitation (IP) and western blotting (WB) were anti-acetylated-lysine and anti-S6K respectively. (c) The effect of rapamycin on SCFA-dependent generation of Th cell subsets was assessed. Naïve CD4+ T cells were cultured in a Tnp, Th1, or Th17 polarization condition for 5-6 days in the presence of C2 (10 mM), C3 (1 mM), and/or rapamycin (25 nM), and the cytokine phenotype of cultured T cells was examined by flow cytometry and ELISA (for IL-10). (d) AMPK activation suppressed the SCFA effect on T cell differentiation. Naïve CD4+ T cells were cultured with SCFAs and/or metformin in indicated polarization conditions for 5-6 days, and frequencies of indicated T cell subsets were examined. The dot plots were from the data obtained in a Th1 condition. (e) Activation of STAT3 by C2 or C3 was examined. CD4+ T cells were activated for 3 days with anti-CD3/28 and then examined for phosphorylation of STAT3. Representative and pooled data obtained from at least three experiments are shown. *Significant differences from blank or control groups (P≤0.05).
Because of the implication of the mTOR-S6K pathway in the SCFA effect on T cells, we assessed the effect of rapamycin (an mTOR inhibitor) on SCFA-induced IL-10 expression. We found that rapamycin was effective in suppressing the C2 or C3-induced cellular expression and secretion of IL-10 in T cells (Fig. 9c). The SCFA-dependent increase of IL-10+, Th1, and Th17 cells was also suppressed by rapamycin. Furthermore, metformin, an AMPK activator, which suppresses the mTOR pathway,31 effectively abolished the SCFA effect on T cells (Fig. 9d). In a manner similar to IL-6, SCFAs activated STAT3 (Fig. 9e), which is typically activated downstream of mTOR and involved in expression of IL-10 and IL-17.32 Extracellular signal-regulated kinase (ERK) is implicated in expression of IL-10 by Th1 cells and is activated by the signals from GPR41 or GPR43 in epithelial cells.11, 33 SCFAs, however, had no detectable effect on ERK activation in T cells (Fig. S4). Overall, these results indicate that SCFAs inhibit HDACs and regulate the mTOR-S6K pathway required for T cell differentiation into effector and regulatory T cells.
C4 also promotes rS6 phosphorylation and T cell production of IFN-γ, IL-17 and/or IL-10
So far, we examined the function of C2 and C3. We studied if C4 has a similar activity as C2 and C3 in regulating T cells. C4 increased the phosphorylation of rS6 in most T cells at 0.5 mM, an effective concentration lower than that of C2 or C3 (Fig. 10a). Moreover, C4 promoted the differentiation of naïve CD4+ T cells into IL-10 producers in all T cell polarization conditions tested (Tnp, Th1, and Th17) (Fig. 10b). C4 also enhanced the induction of IFN-γ and IL-17 in Th1 and Th17 polarization conditions respectively. Thus, C4 is highly similar to C2 and C3 in regulating T cell differentiation.
Fig. 10.
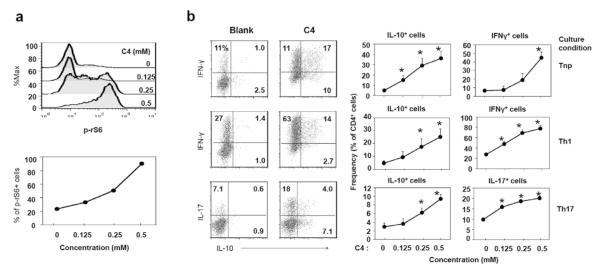
Effects of C4 on rS6 phosphorylation (A) and T cell differentiation (B). Naive CD4+ T cells, depleted of Treg (CD25+) and memory T (CD44+ CD69+) cells, were activated with anti-CD3/CD28 for 3 days for rS6 phosphorylation and for 5-6 days in a Tnp, Th17, or Th1 condition for T cell differentiation at indicated concentrations of C4. Representative and pooled data obtained from at least three experiments are shown. *Significant differences from blank or control groups (P≤0.05).
Discussion
Our results indicate that SCFAs can directly affect T cell differentiation. SCFAs enhance T cell differentiation into effector T cells, such as Th1 and Th17 cells, admixed with anti-inflammatory IL-10+ regulatory T cells. This function of SCFAs is mediated by their GPR41 or GPR43-independent HDAC inhibitor activity and subsequent enhancement of mTOR-S6K activity required for T cell differentiation and cytokine expression.
SCFAs activate cell surface receptors such as GPR41 and GPR43 but can be readily absorbed into any cell types.34, 35 This property allows SCFAs to bypass the cell-surface SCFA receptors to regulate even the cells that do not highly express GPR41 or GPR43. It has been debated whether T cells express functional GPR43.9-11 Our results indicate that T cells do not express GPR41 and GPR43 at functional levels as reported previously.9, 11, 19 This is supported by our data that HDAC inhibition and regulation of T cell differentiation by SCFAs normally occur even in T cells deficient in GPR41 and GPR43. This is consistent with the fact that ERKs, typically activated downstream of GPR41 and GPR43,11 are not activated in T cells by SCFAs. This questions the data from a recent report that SCFAs directly suppress HDACs in a GPR43-dependent manner.10
Once entered into T cells undergoing activation, SCFAs effectively suppress HDACs as demonstrated in this study. Acetylation of proteins including histones, transcription factors and various signaling molecules by HDACs can alter the functions of modified proteins.36-38 A pathway, important for T cell differentiation and affected by HDAC inhibition demonstrated in this study, is the mTOR-S6K pathway. The mTOR pathway promotes the expression of key effector and regulatory cytokines such as IL-10, IFN-γ and IL-17.27, 39-41 In this regard, the sustained high mTOR-S6K activity in T cells cultured with SCFAs reveals a regulatory point for SCFAs in regulation of T cell differentiation. Consistently, metformin, an anti-diabetic drug that activates AMPK and negatively regulates the mTOR pathway, was effective in suppressing the SCFA effect on T cells. Along with the mTOR pathway, STAT3 activation was enhanced as well by SCFAs, which is involved in expression of the cytokines (IL-10, IFN-γ and IL-17) in T cells.
Our results indicate that the C2 function in regulation of T cells is modulated by cytokine milieu and immunological context. We observed that IL-10+ T cells were increased by SCFAs in the steady condition in vivo, whereas effector T cells were increased by C2 only during active immune responses. Moreover, IL-10 expression was promoted in all T cell polarization conditions tested in this study, whereas the expression of IL-17 and IFN-γ was promoted specifically in respective polarization conditions. IL-10 production by effector T cells is an important negative feedback mechanism to rein in the inflammatory activities of effector T cells.42, 43 This selective enhancement of effector versus IL-10+ T cells would be beneficial to the host in promoting immunity with the built-in negative feedback function of IL-10. An interesting observation made in this study in this regard was that induction of FoxP3+ T cells by SCFAs can occur in a low TCR activation condition. Taken together, SCFAs can induce both effector and regulatory T cells including IL-10+ T cells and FoxP3+ T cells in appropriate conditions.
It is plausible that SCFAs affect non-T cells to indirectly affect T cells in vivo. Such indirect effects are mediated by non-T cells such as epithelial cells for example11 and may account for the increased number of FoxP3+ T cells in the colon by SCFAs.10 C4 can work through GPR109A on macrophages and dendritic cells to indirectly induce IL-10+ T cells and FoxP3+ T cells.44 A mixture of human Clostridia strains can produce SCFAs and promote the induction of FoxP3+ T cells in colon.45, 46 In this regard, C4 can suppress HDACs to induce FoxP3 expression.46, 47 Moreover, SCFAs can affect other organs such as lungs and regulate allergic hypersensitivity.48 More studies are required to precisely determine the functions of SCFAs in regulation of the immune system and inflammatory diseases.
Our study provides an example how the host immune system harnesses commensal bacterial metabolites for promotion of specialized effector and regulatory T cells. The results identified SCFAs as key gut metabolites important for T cell differentiation into effector and regulatory cells in the body depending on SCFA levels and immunological context. The results have many practical ramifications in regulation of tissue inflammation and immunity.
Methods
Mice
All experiments with animals in this study were approved by the Purdue Animal Care and Use Committee (PACUC). Rag1(−/−) (B6.129s7-Rag1 tm1Mom/J) mice and IL-10 (−/−) mice were originally from the Jackson laboratory. C57BL/6 mice were originally from Harlan (Indianapolis, IN) and CD45.1 C57BL/6 mice were originally from the Jackson Laboratory. GPR43 (−/−) mice were originally from Deltagen (San Mateo, CA), and GPR41(−/−) mice were obtained from Dr. M. Yanagisawa (UT Southwestern Medical Center at Dallas). All mice were produced at the Purdue Life Science Animal Facility and fed with a regular rodent diet (Purina 5053).
Cell isolation
CD4+ T cells were isolated from the spleen and lymph nodes, using the CD4+ T cell isolation kit (Miltenyi). Cells expressing CD8 (clone 53-6.7), CD19 (clone 6D5), CD25 (clone 3C7), CD44 (clone IM7), and CD69 (clone H1.2F3) were further depleted with indicated PE-conjugated antibodies and anti-PE Miltenyi beads to isolate naïve CD4+ T cells. CD8+ cells were isolated by the CD8+ T cell isolation kit (Miltenyi), and cells expressing CD4, CD19, CD25, CD44, and CD69 were further depleted as described for naïve CD4+ T cells. Colonic epithelial cells were positively isolated from EDTA-extracted epithelial cells with biotin conjugated anti-CD326 (clone Ep-CAM) and anti-biotin Miltenyi beads. Colonic T cells were enriched from colonic lamina propria cells by depleting non-T cells with biotin conjugated anti-CD11c (clone N418), CD19 (clone 6D5), CD326 (clone Ep-CAM), and Gr-1 (clone RB6-8C5) antibodies. CD4+ cells were positively selected with PE-conjugated anti-CD4 and anti-PE Miltenyi beads. Marrow Gr-1+ cells were positively selected from bone marrow cells with biotin-labeled anti-GR-1antibody (clone RB6-8C5) and anti-biotin Miltenyi beads. In general, the purity of the isolated cells was greater than 95%. The antibodies were from either BioLegend or eBioscience.
T cell differentiation in vitro
To induce effector T cells and Tregs in vitro, naïve CD4+ or CD8+ T cells (1×10⁵/well) were isolated from wild type, GPR41 (−/−), and GPR43(−/−) mice and activated with plate-coated anti-CD3 (5 μg/ml) and soluble anti-CD28 (2 μg/ml) in 96-well plates for 5-6 days in the presence or absence of Sodium Acetate (C2), Sodium Propionate (C3), or Sodium Butyrate (C4) at indicated concentrations. In some experiments where low TCR activation is required, the anti-CD3 was used at 1 μg/ml. RPMI 1640 medium (10% FBS) containing rapamycin (25 nM, Enzo), metformin (1 mM), or Trichostatin (TSA, 10 nM, Enzo) were used for the T cell culture. For Th17/Tc17 cells, hTGF-β1 (5 ng/ml), mIL-6 (20 ng/ml), mIL-1β (10 ng/ml), mIL-23 (10 ng/ml), mIL-21(10 ng/ml), mTNF-α (20 ng/ml), anti-mIL-4 (11B11, 10 Qg/ml), and anti-mIFN-γ (XMG1.2, 10 Qg/ml) were used. For Th1/Tc1 cells, hIL-2 (100 U/ml), mIL-12 (10 ng/ml), and anti–mIL4 (10 Tg/ml) were used. For the non-polarized condition (Tnp), hIL-2 (100 U/ml) was used.
Flow cytometry
For intracellular staining of IL-10, IL-17 and IFN-γ, cells were stained first for surface antigens with antibodies (e.g. RM4-5 for CD4 or 53-6.7 for CD8) and then activated in RPMI 1640 (10% FBS) with PMA (50 ng/ml), ionomycin (1 μM), and monensin (2 mM; Sigma-Aldrich) for 4 h. Cells were then fixed, permeabilized, and stained with antibodies to mIL-10 (JES5-16E3), mIL-17A (TC11-18H10.1) or IFN-γ (XMG1.2). Cells were stained with an antibody to mouse FoxP3 (FJK-16s), T-bet (eBio4B10), or RORγt (AFKJS-9) according to the manufacturer’s protocol (eBioscience). For co-staining of IL-10 and FoxP3, the cells prestained with anti-CD4 (RM4-5) were activated with PMA (50 ng/ml), ionomycin (1 μM), and Brefeldin A (25 μg/ml) for 4 h. Activated cells were fixed, permeabilized, and stained with antibodies to IL-10 and FoxP3.
For assessment of mTOR activation or STAT3 activation, mouse CD4+ cells were activated for up to 60 hours in complete RPMI-1640 medium with an immobilized antibody to CD3 (5 μg/ml) and soluble antibody to CD28 (2 μg/ml) in the presence of C2 (0, 1, 10, or 20 mM), C3 (0, 0.1, 0.5, or 1 mM) or C4 (0, 0.125, 0.25, or 0.5 mM). Antibodies to phosphorylated rS6 (Ser235/236; D57.2.2E), phosphorylated STAT3 (Y705; D3A7), phosphorylated MAPK (Erk1/2) (Thr202/Tyr204; 137F5) were used for flow cytometry (all from Cell Signaling Technology, Danvers, MA).
Assessment of in vitro suppressive activity
Cultured T cells, prepared as described above in a Th1 condition in the presence (C2-treated cells) or absence (control cells) of C2, were examined for their in vitro suppression activity on freshly isolated CD4+ CD25− T cells. Freshly isolated CD4+ CD25− T cells (responders, 5 × 10⁴/well) were isolated from the spleen of CD45.1 congenic mice, and indicated cultured T cells (suppressors) were co-cultured in U-bottomed 96-well plates for 3 days at the indicated ratios in the presence of anti-CD3 (2.5 μg/ml) and 105 irradiated T-cell depleted splenocytes as antigen presenting cells (APCs). Dilution of carboxyfluorescein diacetate succinimidyl ester (CFSE) was assessed by flow cytometry.
T cell transfer into Rag1(−/−) mice
The control and C2-treated T cells (prepared in a Th17 or Th1 condition) were separately injected i.p. into Rag1-deficient (B6.129s7-Rag1 tm1Mom/J) mice (1 million cells/mouse). The mice were monitored daily for weight change and activity. All mice were sacrificed once some mice experienced 20% weight loss or were moribund. Intestine and other tissues were examined for the frequencies of Th1, Th17, and FoxP3+ T cells by flow cytometry. Intestinal tissues were embedded in paraffin, cut into 6 μm-thick sections, and stained with hematoxylin and eosin. Tissue inflammatory scores were assessed based on the degree of leukocyte infiltration and mucosal hyperplasia on a scale of 0–4. The histological images were obtained with a widefield Leica microscope equipped with a color camera at 100× magnification (scale bar: 200 μm).
In vivo administration of C2 and assessment of effector and regulatory T cell subsets
WT C57BL/6, GPR43(−/−), and GPR41(−/−) mice were kept on drinking water containing C2 (200 mM, pH 7.5) from 3 weeks of age for 6-8 weeks. Drinking water was replaced once a week. Mice were examined for the frequencies of indicated T cell subsets in various organs by flow cytometry. C2-fed WT or IL-10(−/−) mice were injected with anti-CD3 (15 μg/mouse, clone 145-2C11) at two time points (0 and 48 h) and were sacrificed at 52 h after the first injection of anti-CD3. Alternatively, mice were infected with C. rodentium (DBS100, 1010 CFU/mouse) via oral gavage as described previously.49 Mice were sacrificed 2 weeks post-infection, and various tissues were examined for frequencies of T cell subsets with flow cytometry and tissue inflammation based on the degree of leukocyte infiltration and mucosal hyperplasia, and loss of villi on a scale of 0–5.
Assessment of HDAC inhibitor activity and S6K acetylation in T cells
HDAC Cell-Based Activity Assay Kit (Cayman Chemical) was used to measure HDAC activity in activated T cells. Naïve CD4+ T cells, isolated from WT or indicated KO mice, were pre-activated with anti-CD3 and CD28 for 2 days. The activated T cells were incubated with C2, C3, or TSA for 2 hours and processed to measure the HDAC inhibitor activity of the reagents according to the manufacturer’s protocol.
CD4+ T cells were activated with anti-CD3/CD28 and hIL-2 (100 U/ml) in the presence or absence of C2 (10 mM), C3 (1 mM), or TSA (10 nM) for 3 days. Cultured cells (1 × 10⁷ cells) were lysed, pre-cleared by Protein A agarose beads, and incubated with acetylated-lysine antibody (9441, Cell Signaling Technology) overnight at 4°C. Antigen-antibody complexes were precipitated with Protein A agarose beads. Immunoprecipitates or total cell lysate (40 μg of protein/well) were separated with SDS-polyacrylamide gels and then transferred onto nitrocellulose membranes (Bio-Rad). After blocking 1 h in a nonfat dried milk, membranes were incubated with mAb to p70 S6 Kinase (49D7, biotinylated, Cell Signaling Technology) overnight at 4°C. The membranes were developed with HRP-streptavidin (Biolegend) and the ECL detection system (GE Healthcare) using a G:BOX (Syngene).
Measurement of SCFAs in intestinal tissues and cecal contents
Intestine tissues or cecal contents (100 mg) were homogenized in 900 μl of water and 1.4 mm ceramic beads using a Precellys®24 homogenizer. The homogenates were labeled with regular aniline (12C6), and external SCFA standard solution (10 mg/ml of C2, C3, and C4) was labeled with aniline-13C6 using N-(3-Dimethylaminopropyl)-N’-ethylcarbodiimide hydrochloride (EDC, 2 mg/sample). Crotonic acid (final 0.1 mg/ml) was used as an internal standard. The labeling mixture was incubated for 2 h, and triethylamine (TEA) was added to stop the labeling reaction. Samples and standard reaction solution were mixed (1:1) and analyzed with an Agilent 6460 Triple Quad LC/MS System (Agilent Technologies). SCFAs were separated with a CN column (4.6×150 mm) at gas temperature of 325 °C, gas flow rate of 8 L/min, nebulizer pressure of 45 psi, sheath gas temperature of 250 °C, sheath gas flow rate of 7 L/min, capillary voltage of +3500V, and nozzle voltage of +1000V. SCFA concentrations in samples were determined based on peak areas of the internal standard and external standards.
Quantitative real-time PCR analysis and ELISA
Total RNA was extracted with TRIzol® (Invitrogen), and cDNA synthesis was performed with SuperScript® II Reverse Transcriptase (Invitrogen). Quantitative real-time PCR (qRT-PCR) was performed with Maxima® SYBR Green/ROX qPCR Master Mix (2X) (Fermentas). The primers used were: IL-10 (CCA.GCT.GGA.CAA.CAT.ACT.GCT and CAT.CAT.GTA.TGC.TTC.TAT.GCA.G); IL-17A (GAC.TCT.CCA.CCG.CAA.TG and CGG.GTC.TCT.GTT.TAG.GCT); IL-17F (CCA.TGG.GAT.TAC.AAC.ATC.ACT.C and TTG.TAT.GCA.GCG.TTG.TCA.G); RoRγt (AGC.CAC.TGC.ATT.CCC.AGT.TTC.T and TGA.AAG.CCG.CTT.GGC.AAA.CT); RoRα (GTG.GCT.TCA.GGA.AAA.GGT and GCG.CGA.CAT.TTA.CCC.AT); IFN-γ (AGA.CAA.TCA.GGC.CAT.CAG.CA and CGA.ATC.AGC.AGC.GAC.TCC.TTT); T-bet (ATG.CCG.CTG.AAT.TGG.AAG.GT and ACC.TCG.CAG.AAA.GCC.ATG.AAG.T). Gene expression levels were normalized by β-actin levels. ELISA of secreted IL-10 was performed with anti-mIL-10 antibody (JES5-2A5) and a biotinylated anti-mIL-10 antibody (JES5-16ES).
Statistical analysis
Student’s paired t test (2-tailed) was used to determine the significance of differences between two groups. Mouse weight change data was analyzed with a repeated measures analysis of variance (ANOVA, SAS, version 9.2, SAS Institute Inc. Cary, NC.). P values < or = 0.05 were considered significant.
Supplementary Material
Fig. S1. Expression of FoxP3 by (a) T-bet+ or (b) ROγt+ T cells in a low anti-CD3 (1 μg/ml) activation condition. Cells were cultured for 5 days in a Th1 or Th17 condition with C2 (10 mM) or C3 (1 mM). Representative or pooled data from 3 experiments are shown. *Significant differences from blank groups (no treatment) (P≤0.05).
Fig. S2. Few IL-10+ T cells induced by SCFAs express FoxP3. (a) Cells were activated with anti-CD3 (5 μg/ml) for 5 days in a (a) Tnp, (b) Th1, or (c) Th17 polarization condition with C2 (10 mM) or C3 (1 mM). Cells were activated with anti-CD3 (5 μg/ml unless indicated otherwise) and anti-CD28 for 5 days. Representative and pooled data from 3 experiments are shown. *Significant differences from blank groups (no treatment) (P≤0.05).
Fig. S3. C2 increased IL-10-producing T cells in the steady condition but effector T cells in an infection condition. Mice were fed with C2 for 6-8 weeks, and some mice were infected with C. rodentium. Changes in Th17, Th1, and IL-10+ T cells in indicated tissues 14 days after oral infection with C. rodentium were examined by flow cytometry. Numbers of indicated CD4+ T cell subsets in each organ are shown. *Significant differences (P≤0.05; n=7-9).
Fig. S4. ERK activation in T cells was not affected by SCFAs. Naïve CD4+ T cells were activated for 1 or 3 hours with anti-CD3 (coated) and CD28 (soluble) in the presence of C2 or C3. Pooled data obtained from 3 experiments are shown in the graphs.
Acknowledgments
We thank J Lee, B Ulrich and A Kaur (Purdue University) for their helpful inputs.
Footnotes
Disclosure: This study was supported, in part, from grants from National Multiple Sclerosis Society, NIH (R01AI074745, R01DK076616, 1S10RR02829, and R01AI080769), and Crohn’s and Colitis Foundation of America to CHK. JHP performed experiments, analyzed data, and prepared most of the figures with experimental contributions from MHK, SGK, AHJ, BC, and JP. CK designed the study, analyzed data, and drafted the manuscript with JHP.
None of the authors have a financial interest related to this work.
References
- 1.Lee YK, Mazmanian SK. Has the microbiota played a critical role in the evolution of the adaptive immune system? Science. 2010;330(6012):1768–1773. doi: 10.1126/science.1195568. [DOI] [PMC free article] [PubMed] [Google Scholar]
- 2.Kamada N, Nunez G. Role of the gut microbiota in the development and function of lymphoid cells. J Immunol. 2013;190(4):1389–1395. doi: 10.4049/jimmunol.1203100. [DOI] [PMC free article] [PubMed] [Google Scholar]
- 3.Keeney KM, Finlay BB. Enteric pathogen exploitation of the microbiota-generated nutrient environment of the gut. Curr Opin Microbiol. 2011;14(1):92–98. doi: 10.1016/j.mib.2010.12.012. [DOI] [PMC free article] [PubMed] [Google Scholar]
- 4.Flint HJ, Scott KP, Louis P, Duncan SH. The role of the gut microbiota in nutrition and health. Nat Rev Gastroenterol Hepatol. 2012;9(10):577–589. doi: 10.1038/nrgastro.2012.156. [DOI] [PubMed] [Google Scholar]
- 5.Macfarlane S, Macfarlane GT. Regulation of short-chain fatty acid production. The Proceedings of the Nutrition Society. 2003;62(1):67–72. doi: 10.1079/PNS2002207. [DOI] [PubMed] [Google Scholar]
- 6.Kamp F, Hamilton JA. How fatty acids of different chain length enter and leave cells by free diffusion. Prostaglandins, leukotrienes, and essential fatty acids. 2006;75(3):149–159. doi: 10.1016/j.plefa.2006.05.003. [DOI] [PubMed] [Google Scholar]
- 7.Cummings JH, Pomare EW, Branch WJ, Naylor CP, Macfarlane GT. Short chain fatty acids in human large intestine, portal, hepatic and venous blood. Gut. 1987;28(10):1221–1227. doi: 10.1136/gut.28.10.1221. [DOI] [PMC free article] [PubMed] [Google Scholar]
- 8.Ziegler TR, Evans ME, Fernandez-Estivariz C, Jones DP. Trophic and cytoprotective nutrition for intestinal adaptation, mucosal repair, and barrier function. Annu Rev Nutr. 2003;23:229–261. doi: 10.1146/annurev.nutr.23.011702.073036. [DOI] [PubMed] [Google Scholar]
- 9.Maslowski KM, Vieira AT, Ng A, Kranich J, Sierro F, Yu D, et al. Regulation of inflammatory responses by gut microbiota and chemoattractant receptor GPR43. Nature. 2009;461(7268):1282–1286. doi: 10.1038/nature08530. [DOI] [PMC free article] [PubMed] [Google Scholar]
- 10.Smith PM, Howitt MR, Panikov N, Michaud M, Gallini CA, Bohlooly YM, et al. The Microbial Metabolites, Short-Chain Fatty Acids, Regulate Colonic Treg Cell Homeostasis. Science. 2013 doi: 10.1126/science.1241165. [DOI] [PMC free article] [PubMed] [Google Scholar]
- 11.Kim MH, Kang SG, Park JH, Yanagisawa M, Kim CH. Short-chain fatty acids activate GPR41 and GPR43 on intestinal epithelial cells to promote inflammatory responses in mice. Gastroenterology. 2013;145(2):396–406. e391–310. doi: 10.1053/j.gastro.2013.04.056. [DOI] [PubMed] [Google Scholar]
- 12.Zuniga LA, Jain R, Haines C, Cua DJ. Th17 cell development: from the cradle to the grave. Immunological reviews. 2013;252(1):78–88. doi: 10.1111/imr.12036. [DOI] [PubMed] [Google Scholar]
- 13.McAleer JP, Kolls JK. Mechanisms controlling Th17 cytokine expression and host defense. Journal of leukocyte biology. 2011;90(2):263–270. doi: 10.1189/jlb.0211099. [DOI] [PMC free article] [PubMed] [Google Scholar]
- 14.Symons A, Budelsky AL, Towne JE. Are Th17 cells in the gut pathogenic or protective? Mucosal immunology. 2012;5(1):4–6. doi: 10.1038/mi.2011.51. [DOI] [PubMed] [Google Scholar]
- 15.Khader SA, Gaffen SL, Kolls JK. Th17 cells at the crossroads of innate and adaptive immunity against infectious diseases at the mucosa. Mucosal immunology. 2009;2(5):403–411. doi: 10.1038/mi.2009.100. [DOI] [PMC free article] [PubMed] [Google Scholar]
- 16.Atarashi K, Honda K. Microbiota in autoimmunity and tolerance. Curr Opin Immunol. 2011;23(6):761–768. doi: 10.1016/j.coi.2011.11.002. [DOI] [PubMed] [Google Scholar]
- 17.Ivanov II, Littman DR. Segmented filamentous bacteria take the stage. Mucosal immunology. 2010;3(3) doi: 10.1038/mi.2010.3. [DOI] [PMC free article] [PubMed] [Google Scholar]
- 18.Sartor RB. Key questions to guide a better understanding of host-commensal microbiota interactions in intestinal inflammation. Mucosal immunology. 2011;4(2):127–132. doi: 10.1038/mi.2010.87. [DOI] [PubMed] [Google Scholar]
- 19.Vinolo MA, Ferguson GJ, Kulkarni S, Damoulakis G, Anderson K, Bohlooly YM, et al. SCFAs induce mouse neutrophil chemotaxis through the GPR43 receptor. PLoS One. 2011;6(6):e21205. doi: 10.1371/journal.pone.0021205. [DOI] [PMC free article] [PubMed] [Google Scholar]
- 20.Kamanaka M, Kim ST, Wan YY, Sutterwala FS, Lara-Tejero M, Galan JE, et al. Expression of interleukin-10 in intestinal lymphocytes detected by an interleukin-10 reporter knockin tiger mouse. Immunity. 2006;25(6):941–952. doi: 10.1016/j.immuni.2006.09.013. [DOI] [PubMed] [Google Scholar]
- 21.Merger M, Viney JL, Borojevic R, Steele-Norwood D, Zhou P, Clark DA, et al. Defining the roles of perforin, Fas/FasL, and tumour necrosis factor alpha in T cell induced mucosal damage in the mouse intestine. Gut. 2002;51(2):155–163. doi: 10.1136/gut.51.2.155. [DOI] [PMC free article] [PubMed] [Google Scholar]
- 22.Tazoe H, Otomo Y, Kaji I, Tanaka R, Karaki SI, Kuwahara A. Roles of short-chain fatty acids receptors, GPR41 and GPR43 on colonic functions. J Physiol Pharmacol. 2008;59(Suppl 2):251–262. [PubMed] [Google Scholar]
- 23.Kiefer J, Beyer-Sehlmeyer G, Pool-Zobel BL. Mixtures of SCFA, composed according to physiologically available concentrations in the gut lumen, modulate histone acetylation in human HT29 colon cancer cells. Br J Nutr. 2006;96(5):803–810. doi: 10.1017/bjn20061948. [DOI] [PubMed] [Google Scholar]
- 24.Hinnebusch BF, Meng S, Wu JT, Archer SY, Hodin RA. The effects of short-chain fatty acids on human colon cancer cell phenotype are associated with histone hyperacetylation. J Nutr. 2002;132(5):1012–1017. doi: 10.1093/jn/132.5.1012. [DOI] [PubMed] [Google Scholar]
- 25.Aoyama M, Kotani J, Usami M. Butyrate and propionate induced activated or non-activated neutrophil apoptosis via HDAC inhibitor activity but without activating GPR-41/GPR-43 pathways. Nutrition. 2010;26(6):653–661. doi: 10.1016/j.nut.2009.07.006. [DOI] [PubMed] [Google Scholar]
- 26.Delgoffe GM, Kole TP, Zheng Y, Zarek PE, Matthews KL, Xiao B, et al. The mTOR kinase differentially regulates effector and regulatory T cell lineage commitment. Immunity. 2009;30(6):832–844. doi: 10.1016/j.immuni.2009.04.014. [DOI] [PMC free article] [PubMed] [Google Scholar]
- 27.Lee K, Gudapati P, Dragovic S, Spencer C, Joyce S, Killeen N, et al. Mammalian target of rapamycin protein complex 2 regulates differentiation of Th1 and Th2 cell subsets via distinct signaling pathways. Immunity. 2010;32(6):743–753. doi: 10.1016/j.immuni.2010.06.002. [DOI] [PMC free article] [PubMed] [Google Scholar]
- 28.Ochanuna Z, Geiger-Maor A, Dembinsky-Vaknin A, Karussis D, Tykocinski ML, Rachmilewitz J. Inhibition of effector function but not T cell activation and increase in FoxP3 expression in T cells differentiated in the presence of PP14. PLoS One. 2010;5(9):e12–68. doi: 10.1371/journal.pone.0012868. [DOI] [PMC free article] [PubMed] [Google Scholar]
- 29.Fenton TR, Gwalter J, Cramer R, Gout IT. S6K1 is acetylated at lysine 516 in response to growth factor stimulation. Biochemical and biophysical research communications. 2010;398(3):400–405. doi: 10.1016/j.bbrc.2010.06.081. [DOI] [PubMed] [Google Scholar]
- 30.Fenton TR, Gwalter J, Ericsson J, Gout IT. Histone acetyltransferases interact with and acetylate p70 ribosomal S6 kinases in vitro and in vivo. The international journal of biochemistry & cell biology. 2010;42(2):359–366. doi: 10.1016/j.biocel.2009.11.022. [DOI] [PubMed] [Google Scholar]
- 31.Bolster DR, Crozier SJ, Kimball SR, Jefferson LS. AMP-activated protein kinase suppresses protein synthesis in rat skeletal muscle through down-regulated mammalian target of rapamycin (mTOR) signaling. The Journal of biological chemistry. 2002;277(27):23977–23980. doi: 10.1074/jbc.C200171200. [DOI] [PubMed] [Google Scholar]
- 32.Wei L, Laurence A, O’Shea JJ. New insights into the roles of Stat5a/b and Stat3 in T cell development and differentiation. Seminars in cell & developmental biology. 2008;19(4):394–400. doi: 10.1016/j.semcdb.2008.07.011. [DOI] [PMC free article] [PubMed] [Google Scholar]
- 33.Saraiva M, Christensen JR, Veldhoen M, Murphy TL, Murphy KM, O’Garra A. Interleukin-10 production by Th1 cells requires interleukin-12-induced STAT4 transcription factor and ERK MAP kinase activation by high antigen dose. Immunity. 2009;31(2):209–219. doi: 10.1016/j.immuni.2009.05.012. [DOI] [PMC free article] [PubMed] [Google Scholar]
- 34.Hadjiagapiou C, Schmidt L, Dudeja PK, Layden TJ, Ramaswamy K. Mechanism(s) of butyrate transport in Caco-2 cells: role of monocarboxylate transporter 1. American journal of physiology Gastrointestinal and liver physiology. 2000;279(4):G775–780. doi: 10.1152/ajpgi.2000.279.4.G775. [DOI] [PubMed] [Google Scholar]
- 35.Binder HJ. Role of colonic short-chain fatty acid transport in diarrhea. Annual review of physiology. 2010;72:297–313. doi: 10.1146/annurev-physiol-021909-135817. [DOI] [PubMed] [Google Scholar]
- 36.Beier UH, Akimova T, Liu Y, Wang L, Hancock WW. Histone/protein deacetylases control Foxp3 expression and the heat shock response of T-regulatory cells. Curr Opin Immunol. 2011;23(5):670–678. doi: 10.1016/j.coi.2011.07.002. [DOI] [PMC free article] [PubMed] [Google Scholar]
- 37.Haberland M, Montgomery RL, Olson EN. The many roles of histone deacetylases in development and physiology: implications for disease and therapy. Nature reviews Genetics. 2009;10(1):32–42. doi: 10.1038/nrg2485. [DOI] [PMC free article] [PubMed] [Google Scholar]
- 38.Bhavsar P, Ahmad T, Adcock IM. The role of histone deacetylases in asthma and allergic diseases. The Journal of allergy and clinical immunology. 2008;121(3):580–584. doi: 10.1016/j.jaci.2007.12.1156. [DOI] [PubMed] [Google Scholar]
- 39.Delgoffe GM, Pollizzi KN, Waickman AT, Heikamp E, Meyers DJ, Horton MR, et al. The kinase mTOR regulates the differentiation of helper T cells through the selective activation of signaling by mTORC1 and mTORC2. Nature immunology. 2011;12(4):295–303. doi: 10.1038/ni.2005. [DOI] [PMC free article] [PubMed] [Google Scholar]
- 40.Haxhinasto S, Mathis D, Benoist C. The AKT-mTOR axis regulates de novo differentiation of CD4+Foxp3+ cells. J Exp Med. 2008;205(3):565–574. doi: 10.1084/jem.20071477. [DOI] [PMC free article] [PubMed] [Google Scholar]
- 41.Zeiser R, Leveson-Gower DB, Zambricki EA, Kambham N, Beilhack A, Loh J, et al. Differential impact of mammalian target of rapamycin inhibition on CD4+CD25+Foxp3+ regulatory T cells compared with conventional CD4+ T cells. Blood. 2008;111(1):453–462. doi: 10.1182/blood-2007-06-094482. [DOI] [PMC free article] [PubMed] [Google Scholar]
- 42.Huss DJ, Winger RC, Peng H, Yang Y, Racke MK, Lovett-Racke AE. TGF-beta enhances effector Th1 cell activation but promotes self-regulation via IL-10. J Immunol. 2010;184(10):5628–5636. doi: 10.4049/jimmunol.1000288. [DOI] [PMC free article] [PubMed] [Google Scholar]
- 43.Jankovic D, Kugler DG, Sher A. IL-10 production by CD4+ effector T cells: a mechanism for self-regulation. Mucosal immunology. 2010;3(3):239–246. doi: 10.1038/mi.2010.8. [DOI] [PMC free article] [PubMed] [Google Scholar]
- 44.Singh N, Gurav A, Sivaprakasam S, Brady E, Padia R, Shi H, et al. Activation of Gpr109a, receptor for niacin and the commensal metabolite butyrate, suppresses colonic inflammation and carcinogenesis. Immunity. 2014;40(1):128–139. doi: 10.1016/j.immuni.2013.12.007. [DOI] [PMC free article] [PubMed] [Google Scholar]
- 45.Atarashi K, Tanoue T, Oshima K, Suda W, Nagano Y, Nishikawa H, et al. Treg induction by a rationally selected mixture of Clostridia strains from the human microbiota. Nature. 2013;500(7461):232–236. doi: 10.1038/nature12331. [DOI] [PubMed] [Google Scholar]
- 46.Furusawa Y, Obata Y, Fukuda S, Endo TA, Nakato G, Takahashi D, et al. Commensal microbe-derived butyrate induces the differentiation of colonic regulatory T cells. Nature. 2013;504(7480):446–450. doi: 10.1038/nature12721. [DOI] [PubMed] [Google Scholar]
- 47.Arpaia N, Campbell C, Fan X, Dikiy S, van der Veeken J, deRoos P, et al. Metabolites produced by commensal bacteria promote peripheral regulatory T-cell generation. Nature. 2013;504(7480):451–455. doi: 10.1038/nature12726. [DOI] [PMC free article] [PubMed] [Google Scholar]
- 48.Trompette A, Gollwitzer ES, Yadava K, Sichelstiel AK, Sprenger N, Ngom-Bru C, et al. Gut microbiota metabolism of dietary fiber influences allergic airway disease and hematopoiesis. Nature medicine. 2014;20(2):159–166. doi: 10.1038/nm.3444. [DOI] [PubMed] [Google Scholar]
- 49.Symonds EL, Riedel CU, O’Mahony D, Lapthorne S, O’Mahony L, Shanahan F. Involvement of T helper type 17 and regulatory T cell activity in Citrobacter rodentium invasion and inflammatory damage. Clin Exp Immunol. 2009;157(1):148–154. doi: 10.1111/j.1365-2249.2009.03934.x. [DOI] [PMC free article] [PubMed] [Google Scholar]
Associated Data
This section collects any data citations, data availability statements, or supplementary materials included in this article.
Supplementary Materials
Fig. S1. Expression of FoxP3 by (a) T-bet+ or (b) ROγt+ T cells in a low anti-CD3 (1 μg/ml) activation condition. Cells were cultured for 5 days in a Th1 or Th17 condition with C2 (10 mM) or C3 (1 mM). Representative or pooled data from 3 experiments are shown. *Significant differences from blank groups (no treatment) (P≤0.05).
Fig. S2. Few IL-10+ T cells induced by SCFAs express FoxP3. (a) Cells were activated with anti-CD3 (5 μg/ml) for 5 days in a (a) Tnp, (b) Th1, or (c) Th17 polarization condition with C2 (10 mM) or C3 (1 mM). Cells were activated with anti-CD3 (5 μg/ml unless indicated otherwise) and anti-CD28 for 5 days. Representative and pooled data from 3 experiments are shown. *Significant differences from blank groups (no treatment) (P≤0.05).
Fig. S3. C2 increased IL-10-producing T cells in the steady condition but effector T cells in an infection condition. Mice were fed with C2 for 6-8 weeks, and some mice were infected with C. rodentium. Changes in Th17, Th1, and IL-10+ T cells in indicated tissues 14 days after oral infection with C. rodentium were examined by flow cytometry. Numbers of indicated CD4+ T cell subsets in each organ are shown. *Significant differences (P≤0.05; n=7-9).
Fig. S4. ERK activation in T cells was not affected by SCFAs. Naïve CD4+ T cells were activated for 1 or 3 hours with anti-CD3 (coated) and CD28 (soluble) in the presence of C2 or C3. Pooled data obtained from 3 experiments are shown in the graphs.


