Abstract
Objective:
Alcohol use disorders have both high social and economic costs and are among the leading causes of preventable death in the United States. Understanding the factors that contribute to escalation of alcohol intake is important in developing effective treatments for this problem. This study further characterizes the effects of limited intermittent exposure to high levels of alcohol on the preference for alcohol consumption over other incentives.
Method:
Fourteen male, Sprague-Dawley rats were trained to consume ethanol in a gelatin vehicle. They were then given free access to both ethanol gelatin and plain gelatin during daily choice periods interspersed with nonchoice periods (only plain gelatin access). After baseline ethanol preference was established, half of the rats were given eight injections of 3 g/kg ethanol during nonchoice periods (spread out over about 2 months), and the other half received saline injections. Ethanol preference was measured during subsequent choice periods.
Results:
Intermittent ethanol injections increased ethanol preference from 21% (SEM = 2.3%) of their total gelatin consumption during the first choice period to 46.8% (SEM = 3.4%) during the third choice period. The saline-treated rats had no significant change in ethanol preference. In addition, the ethanol-treated rats exhibited higher ethanol intake than saline-treated rats when ethanol gelatin was the only choice available.
Conclusions:
The results indicate that intermittent exposure to sedative doses of ethanol leads to an increased ethanol preference in rats. This suggests that occasional high-dose alcohol exposure could be an important contributor to the development of enhanced ethanol intake, which may affect the incidence of chronic alcoholism.
The medical community recognizes that daily consumption of about one alcoholic beverage per day decreases cardiovascular risk and total mortality, whereas higher intake is much riskier (Booyse & Parks, 2001; Di Castelnuovo et al., 2006). Thus, the factors that lead to an increase in ethanol intake from healthy levels to risky levels need to be determined, and the mechanism by which intake is increased should be characterized.
High-dose ethanol exposure is one factor that increases the risk of elevated drinking in humans (Robin et al., 1998; Wechsler et al., 2000). In rats, high-dose ethanol exposure increases both ethanol self-administration and ethanol preference (Camarini & Hodge, 2004; Crabbe et al., 2012; Griffin et al., 2009; O'Dell et al., 2004; Rimondini et al., 2002, 2003; Timberlake et al., 2009), even when evidence of tolerance is absent (Alaux-Cantin et al., 2013; Cox et al., 2013; Stuber et al., 2008). We have established that rats reliably consume enough ethanol in a gelatin vehicle within an hour to result in brain ethanol levels of 8–10 mM (Li et al., 2010; Peris et al., 2006; Rowland et al., 2005), which is remarkably similar to that achieved after one to two alcoholic beverages over the same period in humans (Brick 2006). When exposed to intermittent high-dose ethanol (designed to mimic the occasional, twice monthly, heavy episodic drinking that is common in some human populations), rats work harder for ethanol-containing gelatin (Li et al., 2010). There was no effect of this high-dose ethanol treatment on motivation for plain gelatin self-administration, indicating that alterations in appetite, cognition, or motor effects are not involved. Ethanol tolerance, both pharmacokinetic (increased ethanol metabolism) and pharmacodynamic (decreased sensitivity of receptors to ethanol), could explain increased ethanol consumption; however, there was no evidence of tolerance to the sedative effects of the high-dose ethanol exposures over time.
There are a number of other possible explanations for the increased motivation for ethanol seen in this model, including changes in taste or caloric preference or increased reward value of ethanol. The present experiment examines the effect of intermittent sedating doses of ethanol in adult male rats choosing to consume ethanol-containing gelatin or nonalcoholic gelatin. The benefits of using this model allow for assessing the preference of two more calorically similar substances compared with the usual ethanol versus water preference that is normally used. Further characterization of the persistent effects of occasional high-dose ethanol exposure has direct relevance to the development of alcohol use disorders in humans.
Method
Animals and housing
The study used 14 male Sprague-Dawley rats (3 months old, Mweight [SEM] = 220 g [18] at the start of this experiment). Body weight was recorded weekly and before all ethanol injections. All rats were singly housed in a vivarium with a 12 light:12 dark cycle (lights off at 1800) and an ambient temperature maintained at 23 °C (SD = 2). Bottled water and 8604 Teklad Rodent Diet (Harlan Laboratories, Indianapolis, IN) were available ad libitum in the home cage at all times, including during experiment sessions. Rat use was approved by the Institutional Animal Care and Use Committee and was consistent with the Guide for the Care and Use of Laboratory Animals (Committee for the Update of the Guide for the Care and Use of Laboratory Animals, 2011).
Free choice model
Rats were acclimated to 10% ethanol-containing gelatin as described previously (Peris et al., 2006) until rats had only 1 hour of access per day (at 0930 + 1 hour) for a total of 15 days. Ethanol gelatin was made using 10% ethanol, 10% Polycose, and 2.5% gelatin in tap water.
After acclimation, rats were presented with two jars, one containing 10% ethanol gelatin and the other containing plain (ethanol-free) gelatin, for 1 hour daily over 7 days. Jar positions were switched on a daily basis in a random pattern to avoid conditioning to placement. This 7-day choice period was followed by 10 days where only plain gelatin was given to rats for 1 hour every day (nonchoice period). The weight of each jar was measured on an electronic balance before and after each session, and the amount of gelatin consumed was recorded. This procedure was repeated for six cycles of 7 days of choice periods, directly followed by 10 days of plain gelatin nonchoice periods. At the end of this procedure, all rats received 10 daily 1-hour periods of ethanol gelatin–only access.
High-dose ethanol exposure
Rats were divided into two groups of seven rats each, equated for body weight, ethanol preference, and total ethanol consumption during Choice Period 2. Rats in Group E were injected with 3 g/kg ethanol intraperitoneally (20% in saline) on Days 4 and 6 of Nonchoice Periods 2–5 (a total of eight injections over a period of about 2 months). An intraperitoneal saline injection of the same volume was given to rats in Group S on corresponding days. All injections were given at least 3 hours after the nonchoice period that day. Injections were given in divided doses of no more than 3 ml each over the course of 10 minutes. In the event that loss of righting reflex (LORR) did not occur within 10 minutes after the last aliquot of the 3 g/kg dose, an additional 0.5 g/kg injection was given. Booster injections occurred less than 5% of the time and in each case resulted in LORR. Rats were observed continuously until the righting reflex was regained, which was defined as three consecutive rightings within 60 seconds. The duration of LORR was recorded for each ethanol exposure.
Data analysis
The amount of ethanol and plain gelatin consumption was corrected for body weight for each rat. The preference ratios for ethanol gelatin were calculated by averaging the ethanol consumption over a choice period for each animal and dividing this by the sum of the average plain gelatin and ethanol gelatin consumption during the choice periods. The final preference ratios were expressed as percentages. All data are reported as mean (SEM).
Consumption data during the choice periods were analyzed with SPSS Version 17 (SPSS Inc., Chicago, IL) using four-way repeated-measures analysis of variance (ANOVA) with a between-group variable (Group S or Group E) and within-group variables of gelatin type (ethanol or plain), choice period (1–6), and days (nested within each choice session). Consumption data during nonchoice periods were analyzed using three-way ANOVA with a between-group variable (Group S vs. Group E) and within-group variables of choice periods and days (within each choice period). Preference ratios were analyzed with three-way ANOVA including a between-group variable and a within-group variable of choice periods. The a priori level of alpha was p < .05 for statistical significance. Significant interactions between variables were analyzed using post hoc comparisons within each group using repeated-measures ANOVA to determine which group showed significant changes across choice periods.
Results
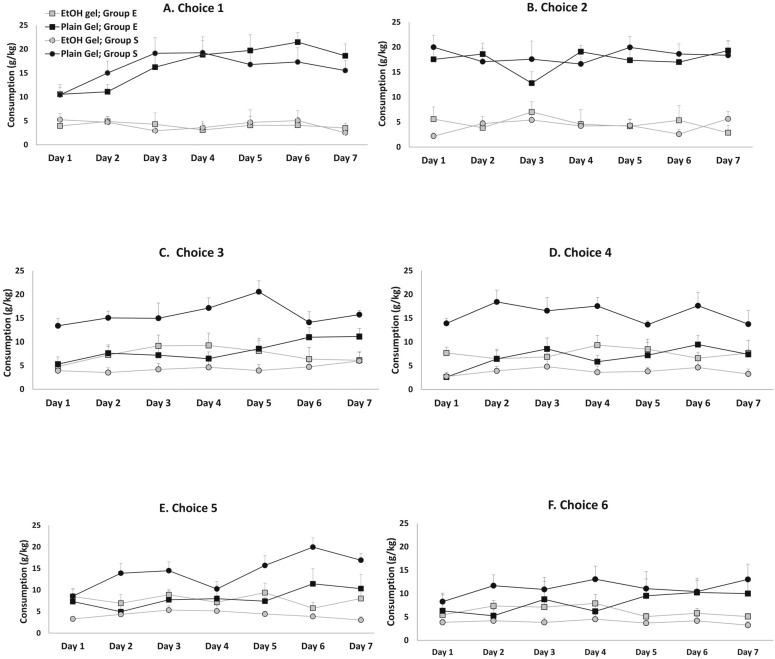
The baseline gelatin consumption is shown in Figures 1A and 1B for each day of the first and second choice periods. Once consumption stabilized (by Day 3 of Choice Period 1), the plain gelatin consumption was 17.7 g (2.1) gelatin/kg body weight, and the average ethanol gelatin consumption was 3.61 g (1.3) gelatin/kg body weight for both groups. This corresponds to a dose of 0.36 g ethanol/kg body weight. There was no difference in consumption between groups during either Choice Periods 1 or 2 [Group × Choice × Gelatin Type interaction; F(1, 12) = 0.5, n.s.].
Figure 1.
Ethanol (EtOH) and plain gelatin consumption of Group S and Group E on each day of the six choice periods. Ethanol gelatin consumption increased and plain gelatin consumption decreased in Group E beginning with the third choice period (Panel C). Consumption of both types of gelatin remained relatively stable in Group S.
The duration of the LORR (M [SEM]) did not differ after any of the high-dose ethanol injections (196 [25], 255 [33], 212 [32], 208 [25], 264 [22], 225 [24], 265 [30], and 238 [14] minutes for Injections 1–8, respectively), indicating that rats did not become tolerant to the sedative effects of 3 g/kg ethanol. Although some rats required a booster dose of ethanol to lose the righting reflex (less than 5% of the time), this did not occur significantly more often during later ethanol injections versus earlier ethanol injections. In fact, the additional dose of ethanol required to achieve LORR decreased on average from 0.2 g/kg (0.06) during the first four ethanol injections to 0.06 g/kg (0.03) during the last four ethanol injections. In addition, mean body weight did not differ for the two groups during any time of the 4-month long experiment (final body weight for Group S = 383 g [20] and for Group E = 379 g [19]).
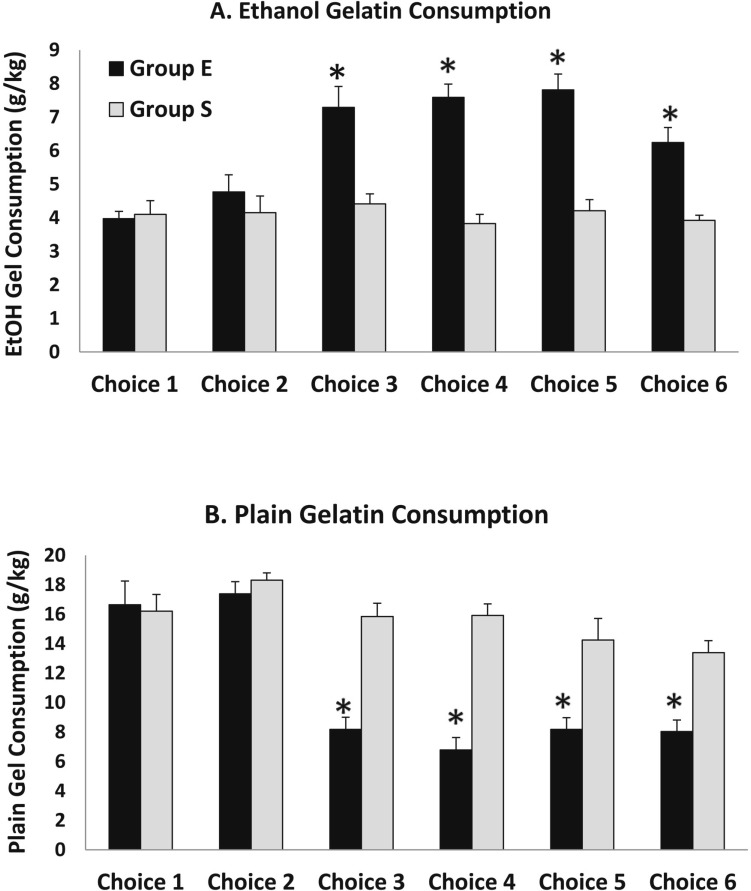
The first set of high-dose ethanol injections was given between Choice Periods 2 and 3. The ethanol gelatin consumption during Choice Periods 3–6 was markedly increased in Group E compared with Group S, whereas plain gelatin consumption decreased in Group E during Choice Periods 3–6 relative to Group S (Figure 1). These differences were apparent on all days within these sessions. Because the ANOVA revealed no significant interaction or main effects including days, the data are presented collapsed across days within each choice period (Figure 2). In this figure, it is apparent that although both ethanol gelatin and plain gelatin consumption remained stable in Group S across choice periods, ethanol gelatin consumption increased while plain gelatin consumption decreased across choice periods in Group E. These observations are supported by a significant Group × Choice × Gelatin Type interaction, F(5, 60) = 5.5, p < .001. This interaction was attributable to a significant Choice × Gelatin Type interaction, F(5, 30) = 12.0, p < .001, in Group E and no Choice × Gelatin Type interaction, F(5, 30)= 1.7, n.s., in Group S.
Figure 2.
Average ethanol and plain gelatin consumption for each choice period collapsed across days. Panel A: Ethanol gelatin consumption increased significantly in Group E beginning with the third choice period but remained stable in Group S. Panel B: Plain gelatin consumption decreased in Group E beginning with the third choice period but remained stable in group S. *p < .05 compared with Group S.
The alteration caused by the high-dose ethanol treatment appeared to occur mainly after the first set of high-dose ethanol injections (i.e., between Choice Periods 2 and 3). Additional high-dose ethanol injections did not further affect ethanol or plain gelatin consumption in either group during Choice Period 4 (Figure 1D), Choice Period 5 (Figure 1E), or Choice Period 6 (Figure 1F), which is supported by a significant Group × Choice × Gelatin Type interaction, F(1, 12) = 10.8, p < .01, observed between Choice Periods 2 and 3 without additional interactions between the other choice periods.
Overall, total gelatin consumption (including ethanol and plain gelatin) was significantly less for Group E during Choice Periods 3–6 (14.5 [1.1] g total gelatin) compared with Choice Periods 1 and 2 (21.3 [1.9] g total gelatin) or compared with Group S (20.6 [2.1] g total gelatin). However, when total calorie consumption is calculated (based on 1.109 calories/g ethanol gelatin and 0.376 calories/g plain gelatin), there is no difference in calories consumed between groups during any session (Group S: 10.7 [1.1], 11.5 [1.3], 10.9 [0.9], 10.5 [1.0], 10.3 [1.4], 9.8 [0.8]; Group E: 10.5 [1.1], 11.5 [1.0], 10.9 [1.2], 10.9 [1.0], 11.6 [1.2], 9.6 [1.0], for Choice Periods 1–6, respectively).
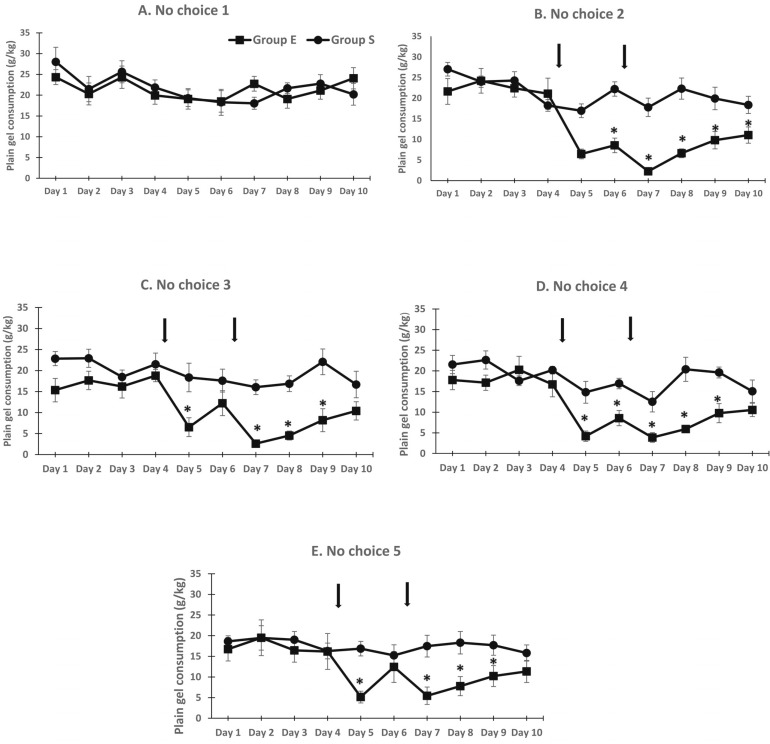
During the nonchoice sessions (plain gelatin access only), there was no difference in gelatin consumption between groups initially (Figure 3A). However, plain gelatin consumption was decreased in Group E during the second through fifth nonchoice periods, primarily on the days after the ethanol injections (Figures 3B–3E). These observations were supported by a significant Group × Choice × Day interaction, F(4, 432) = 4.8, p < .001. Follow-up ANOVAs indicated no difference between groups during the first nonchoice period but significant Group × Day interactions during subsequent nonchoice periods. In general, plain gelatin consumption was not different during the first 4 days of the nonchoice periods but was significantly decreased on Days 5–9. Plain gelatin consumption was generally not different between groups on Day 10 (Figure 3).
Figure 3.
Plain gelatin consumption decreased significantly after rats were injected with 3 g/kg ethanol (Group E) but returned to control levels by the end of the nonchoice period. Daily plain gelatin consumption during nonchoice periods remained stable in Group S. *p < .05 compared with Group S.
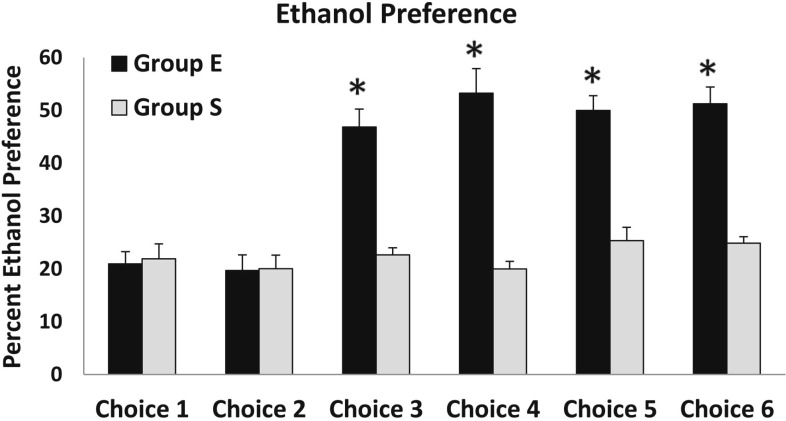
When the ratio of ethanol gelatin versus plain gelatin consumed was calculated, the ethanol preference was 21% (2.3) for Group E and 22% (2.9) for Group S during Choice Period 1 and 19.7% (3) in Group E and 20% (2.6) in Group S during Choice Period 2 (Figure 4). The average ethanol preference in Group E increased from 21% (2.3) during Choice Period 1 to 46.8% (3.4) during Choice Period 3 and did not fall below this level for any of the subsequent choice periods (Figure 4). The increased ethanol preference observed in Group E was supported by a significant Group × Choice interaction, F(5, 60) = 6.9, p < .001. The main effect of choice was significant, F(5, 30) = 10.1, p < .001, in Group E but was not significant, F(5, 30) = 0.8, n.s., in Group S. There was a significant Choice × Group interaction, F(1, 12) = 9.7, p < .01, observed between Choice Periods 2 and 3 but not between Choice Periods 1 and 2, 3 and 4, 4 and 5, or 5 and 6. There was a significant effect of days overall, but this effect was not observed within either Groups S or E when analyzed separately.
Figure 4.
Ethanol preference was more than doubled in Group E during Choice Periods 3–6 compared with their ethanol preference during Choice Periods 1 and 2 and also compared with ethanol preference in Group S. *p < .05 compared with Group S.
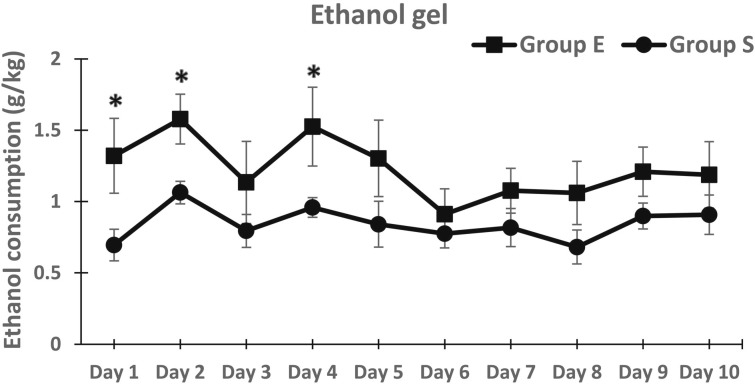
When all rats were subjected to 10 consecutive days of 1-hour access to ethanol gelatin only (after the last choice period), there was a higher level of consumption in Group E, particularly during the first few days of ethanol-only access (Figure 5). ANOVA revealed a significant Group × Days interaction, F(1, 108) = 3.9, p < .05), but no main effect of Groups. Follow-up analyses indicated significantly higher ethanol consumption in Group E on Days 1, 2, and 4 only.
Figure 5.
Ethanol intake during daily 1-hour access to ethanol gelatin only was significantly increased in Group E compared with Group S. *p < .05 compared with Group S.
Discussion
Rats intermittently exposed to high doses of ethanol doubled their ethanol preference over the course of the experiment. Starting with Choice Period 3, ethanol preference in Group E increased significantly, from 21% (2.3) during Choice Period 1 to 46.8% (3.4) during Choice Period 3, whereas preference for ethanol gelatin in Group S remained constant around 20% over all six choice periods. The increase in ethanol preference was due to both an increase in ethanol gelatin consumption as well as a decrease in consumption of plain gelatin. Ethanol consumption almost doubled in Group E over the course of the experiment, increasing from a baseline of about 0.4 g ethanol/kg body weight to about 0.75 g ethanol/kg body weight. Based on our previous studies of brain ethanol concentration during ethanol gelatin consumption (Peris et al., 2006), this increase of ethanol consumption represents a change from nonintoxicating doses of ethanol (projected brain ethanol levels of about 3 mM) to a mildly intoxicating level of ethanol consumption (8 mM, or about 36 mg%).
On the other hand, plain gelatin consumption was decreased by high-dose ethanol injections by more than half, decreasing from about 17 g plain gelatin/kg body weight to about 7 g/kg body weight. This decrease in plain gelatin consumption also contributed to the increase in ethanol preference seen in Group E. Overall total gelatin consumption (both ethanol and plain gelatin) was decreased by about a third in Group E (about 21 g total gelatin/kg body weight compared with about 15 g total gelatin/kg body weight), whereas total calorie intake was not different between groups at any time. It is unclear why plain gelatin consumption was decreased by the high-dose ethanol injections since the rats certainly had the stomach capacity to consume more plain gelatin even with the increase in ethanol gelatin consumption. There are a number of possible explanations for the decrease in plain gelatin consumption seen in Group E. First, the increase in ethanol gelatin consumption might have resulted in ethanol-induced sedation, which could decrease total gelatin consumption. Second, the fact that the high-dose ethanol injections occurred during nonchoice periods (when only plain gelatin was available) might have resulted in a learned taste aversion to the plain gelatin. However, the injections were given well after the nonchoice test sessions (at least 3 hours after gelatin exposure) and only on 2 of the 10 days that plain gelatin was available. In addition, if a taste aversion had developed to the plain gelatin, it is unclear why plain gelatin consumption during the nonchoice period would have returned to normal levels by the end of that period. Last, the most compelling reason for the decrease in plain gelatin consumption is the need for the animals to maintain a stable level of caloric intake over time. The caloric value of the ethanol gelatin is more than twice that of the plain gelatin. Even though the total amount of gelatin (both ethanol and plain) was decreased in Group E, total calorie consumption remained unchanged over the experiment, and, similarly, body weight did not change. Thus, it is possible that the decrease in plain gelatin consumption was in response to the greater number of calories that were being consumed in the form of ethanol gelatin.
High-dose ethanol injections also increased ethanol consumption in subsequent ethanol-only test sessions. Thus, not only do the intermittent high-dose ethanol exposures increase ethanol preference, they also increase the amount of ethanol rats will consume under nonchoice conditions. These results are similar to our previous findings that high-dose ethanol injections can increase motivation for ethanol reinforcement under operant conditions (Li et al., 2010). Both the increase in motivation for ethanol responding and the increase in ethanol preference caused by intermittent high-dose ethanol exposure indicate that the reward value of ethanol had increased.
The reward value of ethanol appears to be regulated by activation of dopamine cell firing in the ventral tegmental area (VTA), which projects to the nucleus accumbens (NAc) (Appel et al., 2006; Doyon et al., 2003, 2005; Robinson et al., 2009). Manipulating the firing rate of dopamine neurons either directly (Bass et al. 2013) or indirectly via changes in γ-aminobutyric acid (GABA) neuronal activity in the VTA (Anstee et al., 2013; Mitchell et al., 2014) can alter ethanol intake. In addition, increases in glutamate, taurine, and glycine release in the NAc occur during operant responding for ethanol gelatin more so when rats have been exposed to high-dose ethanol treatment (Li et al., 2010). It is possible that intermittent high-dose ethanol causes long-lasting alterations in neuronal activity in the VTA and NAc, which alters the reward value of ethanol and thus ethanol preference.
Although there was no indication of the development of tolerance to the sedative effects of 3 g/kg ethanol, the series of high-dose ethanol injections may have resulted in tolerance to other behaviors. For example, rats generally find the taste of ethanol aversive, and this aversion may be diminished after high-dose ethanol exposure. Thus, taste sensitivity to ethanol may be altered by this treatment and should be assessed in future experiments.
The high-dose ethanol injections were used to simulate binge-drinking behavior in humans; however, this model is limited in a number of ways. The high-dose ethanol exposure is not voluntary in our model and therefore does not completely mirror the behavior of humans experiencing binge-drinking episodes. In addition, the use of a sweetened gelatin vehicle most closely simulates early alcohol consumption behaviors rather than chronic alcoholism. The gelatin vehicle contains reinforcing properties itself but decreased caloric density. The increase in preference for ethanol gelatin in Group E, coupled with the stable consumption of ethanol in Group S, strongly suggests that the rats consume ethanol gelatin for the reinforcing properties of alcohol. Future studies should aim to clarify the physiological and neurochemical processes by which repeatedly high levels of intoxication lead to increased preference for ethanol.
Acknowledgments
The authors thank the following persons for technical support: Daniela Wallenfang, Justin Bryan, Daria Accaputo, Sophe Eckels, and Steffe Rohlbuller.
Footnotes
This research was supported by National Institute on Alcohol Abuse and Alcoholism Public Health Service Grant AA 014708.
References
- Alaux-Cantin S, Warnault V, Legastelois R, Botia B, Pierrefiche O, Vilpoux C, Naassila M. Alcohol intoxications during adolescence increase motivation for alcohol in adult rats and induce neuroadaptations in the nucleus accumbens. Neuropharmacology. 2013;67:521–531. doi: 10.1016/j.neuropharm.2012.12.007. [DOI] [PubMed] [Google Scholar]
- Anstee QM, Knapp S, Maguire EP, Hosie AM, Thomas P, Mortensen M, Thomas HC. Mutations in the Gabrb1 gene promote alcohol consumption through increased tonic inhibition. Nature Communications. 2013;4:2816. doi: 10.1038/ncomms3816. [DOI] [PMC free article] [PubMed] [Google Scholar]
- Appel SB, Wise L, McDaid J, Koyama S, McElvain MA, Brodie MS. The effects of long chain-length n-alcohols on the firing frequency of dopaminergic neurons of the ventral tegmental area. Journal of Pharmacology and Experimental Therapeutics. 2006;318:1137–1145. doi: 10.1124/jpet.106.105148. [DOI] [PubMed] [Google Scholar]
- Bass CE, Grinevich VP, Gioia D, Day-Brown JD, Bonin KD, Stuber GD, Budygin EA. Optogenetic stimulation of VTA dopamine neurons reveals that tonic but not phasic patterns of dopamine transmission reduce ethanol self-administration. Frontiers in Behavioral Neuroscience. 2013;7:173. doi: 10.3389/fnbeh.2013.00173. [DOI] [PMC free article] [PubMed] [Google Scholar]
- Booyse FM, Parks DA. Moderate wine and alcohol consumption: Beneficial effects on cardiovascular disease. Thrombosis and Haemostasis. 2001;86:517–528. p. 3p. [PubMed] [Google Scholar]
- Brick J. Standardization of alcohol calculations in research. Alcoholism: Clinical and Experimental Research. 2006;30:1276–1287. doi: 10.1111/j.1530-0277.2006.00155.x. [DOI] [PubMed] [Google Scholar]
- Camarini R, Hodge CW. Ethanol preexposure increases ethanol self-administration in C57BL/6J and DBA/2J mice. Pharmacology, Biochemistry, and Behavior. 2004;79:623–632. doi: 10.1016/j.pbb.2004.09.012. [DOI] [PubMed] [Google Scholar]
- Committee for the Update of the Guide for the Care and Use of Laboratory Animals. Guide for the care and use of laboratory animals. 8th ed. Washington, DC: National Academies Press; 2011. Retrieved from http://grants.nih.gov/grants/olaw/Guide-for-the-care-and-use-of-laboratory-animals.pdf. [PubMed] [Google Scholar]
- Cox BR, Olney JJ, Lowery-Gionta EG, Sprow GM, Rinker JA, Navarro M, Thiele TE. Repeated cycles of binge-like ethanol (EtOH)-drinking in male C57BL/6J mice augments subsequent voluntary EtOH intake but not other dependence-like phenotypes. Alcoholism: Clinical and Experimental Research. 2013;37:1688–1695. doi: 10.1111/acer.12145. [DOI] [PMC free article] [PubMed] [Google Scholar]
- Crabbe JC, Metten P, Huang LC, Schlumbohm JP, Spence SE, Barkley-Levenson AM, Cameron AJ. Ethanol withdrawal-associated drinking and drinking in the dark: Common and discrete genetic contributions. Addiction Genetics. 2012;1:3–11. doi: 10.2478/addge-2012-0002. [DOI] [PMC free article] [PubMed] [Google Scholar]
- Di Castelnuovo A, Costanzo S, Bagnardi V, Donati MB, Iacoviello L, de Gaetano G. Alcohol dosing and total mortality in men and women: An updated meta-analysis of 34 prospective studies. Archives of Internal Medicine. 2006;166:2437–2445. doi: 10.1001/archinte.166.22.2437. [DOI] [PubMed] [Google Scholar]
- Doyon WM, Anders SK, Ramachandra VS, Czachowski CL, Gonzales RA. Effect of operant self-administration of 10% ethanol plus 10% sucrose on dopamine and ethanol concentrations in the nucleus accumbens. Journal of Neurochemistry. 2005;93:1469–1481. doi: 10.1111/j.1471-4159.2005.03137.x. [DOI] [PubMed] [Google Scholar]
- Doyon WM, York JL, Diaz LM, Samson HH, Czachowski CL, Gonzales RA. Dopamine activity in the nucleus accumbens during consummatory phases of oral ethanol self-administration. Alcoholism: Clinical and Experimental Research. 2003;27:1573–1582. doi: 10.1097/01.ALC.0000089959.66222.B8. [DOI] [PubMed] [Google Scholar]
- Griffin WC, III, Lopez MF, Becker HC. Intensity and duration of chronic ethanol exposure is critical for subsequent escalation of voluntary ethanol drinking in mice. Alcoholism: Clinical and Experimental Research. 2009;33:1893–1900. doi: 10.1111/j.1530-0277.2009.01027.x. [DOI] [PMC free article] [PubMed] [Google Scholar]
- Li Z, Zharikova A, Vaughan CH, Bastian J, Zandy S, Esperon L, Peris J. Intermittent high-dose ethanol exposures increase motivation for operant ethanol self-administration: Possible neurochemical mechanism. Brain Research. 2010;1310:142–153. doi: 10.1016/j.brainres.2009.11.029. [DOI] [PMC free article] [PubMed] [Google Scholar]
- Mitchell JM, Margolis EB, Coker AR, Allen DC, Fields HL. Intra-VTA deltorphin, but not DPDPE, induces place preference in ethanol-drinking rats: Distinct DOR-1 and DOR-2 mechanisms control ethanol consumption and reward. Alcoholism: Clinical and Experimental Research. 2014;38:195–203. doi: 10.1111/acer.12246. [DOI] [PubMed] [Google Scholar]
- O'Dell LE, Roberts AJ, Smith RT, Koob GF. Enhanced alcohol self-administration after intermittent versus continuous alcohol vapor exposure. Alcoholism: Clinical and Experimental Research. 2004;28:1676–1682. doi: 10.1097/01.alc.0000145781.11923.4e. [DOI] [PubMed] [Google Scholar]
- Peris J, Zharikova A, Li Z, Lingis M, MacNeill M, Wu MT, Rowland NE. Brain ethanol levels in rats after voluntary ethanol consumption using a sweetened gelatin vehicle. Pharmacology, Biochemistry, and Behavior. 2006;85:562–568. doi: 10.1016/j.pbb.2006.10.010. [DOI] [PMC free article] [PubMed] [Google Scholar]
- Rimondini R, Arlinde C, Sommer W, Heilig M. Long-lasting increase in voluntary ethanol consumption and transcriptional regulation in the rat brain after intermittent exposure to alcohol. The FASEB Journal. 2002;16:27–35. doi: 10.1096/fj.01-0593com. [DOI] [PubMed] [Google Scholar]
- Rimondini R, Sommer W, Heilig M. A temporal threshold for induction of persistent alcohol preference: Behavioral evidence in a rat model of intermittent intoxication. Journal of Studies on Alcohol. 2003;64:445–449. doi: 10.15288/jsa.2003.64.445. [DOI] [PubMed] [Google Scholar]
- Robin RW, Long JC, Rasmussen JK, Albaugh B, Goldman D. Relationship of binge drinking to alcohol dependence, other psychiatric disorders, and behavioral problems in an American Indian tribe. Alcoholism: Clinical and Experimental Research. 1998;22:518–523. [PubMed] [Google Scholar]
- Robinson DL, Howard EC, McConnell S, Gonzales RA, Wightman RM. Disparity between tonic and phasic ethanol-induced dopamine increases in the nucleus accumbens of rats. Alcoholism: Clinical and Experimental Research. 2009;33:1187–1196. doi: 10.1111/j.1530-0277.2009.00942.x. [DOI] [PMC free article] [PubMed] [Google Scholar]
- Rowland NE, Nasrallah N, Robertson KL. Accurate caloric compensation in rats for electively consumed ethanol-beer or ethanol-polycose mixtures. Pharmacology, Biochemistry, and Behavior. 2005;80:109–114. doi: 10.1016/j.pbb.2004.10.010. [DOI] [PubMed] [Google Scholar]
- Stuber GD, Hopf FW, Hahn J, Cho SL, Guillory A, Bonci A. Voluntary ethanol intake enhances excitatory synaptic strength in the ventral tegmental area. Alcoholism: Clinical and Experimental Research. 2008;32:1714–1720. doi: 10.1111/j.1530-0277.2008.00749.x. [DOI] [PMC free article] [PubMed] [Google Scholar]
- Timberlake W, Leffel JK, Chester JA, Froehlich JC. Effects of forced alcohol drinking on alcohol-water choice in three pairs of rat lines selectively bred for differences in alcohol preference. Alcohol. 2009;43:105–118. doi: 10.1016/j.alcohol.2008.09.007. [DOI] [PMC free article] [PubMed] [Google Scholar]
- Wechsler H, Lee JE, Kuo M, Lee H. College binge drinking in the 1990s: A continuing problem. Results of the Harvard School of Public Health 1999 College Alcohol Study. Journal of American College Health. 2000;48:199–210. doi: 10.1080/07448480009599305. [DOI] [PubMed] [Google Scholar]


