

Abstract
Objective:
A limited literature on racial/ethnic disparities in the treatment of substance use disorders suggests that quality of treatment may differ based on client’s race/ethnicity. This study examined whether (a) disparities exist in the probability of treatment engagement, a performance measure for substance use disorders, and (b) treatment engagement is associated with similar reductions in likelihood of arrest for Whites, Blacks, Latinos, and American Indians.
Method:
Adult clients who began an outpatient treatment episode in 2008 in public sector specialty treatment facilities in Connecticut, New York, Oklahoma, and Washington made up the sample (N = 108,654). Administrative treatment data were linked to criminal justice data. The criminal justice outcome was defined as an arrest within a year after beginning treatment. Engagement is defined as receiving a treatment service within 14 days of beginning a new outpatient treatment episode and at least two additional services within the next 30 days. Two-step Heckman probit models and hierarchical time-to-event models were used in the analyses.
Results:
Black clients in New York and American Indian clients in Washington had significantly lower likelihood of engagement than White clients. As moderators of engagement, race/ethnicity had inconsistent effects across states on the hazard of arrest.
Conclusions:
Racial/ethnic minority groups may benefit from additional treatment support to reduce criminal justice involvement. States should examine whether disparities exist within their treatment system and incorporate disparities reduction in their quality improvement initiatives.
Disparities in health care quality persist among racial and ethnic minority groups (Agency for Healthcare Research and Quality [AHRQ], 2013) and can occur in two ways: differences in the likelihood of receiving the appropriate care and differences across groups in the positive effect of receiving appropriate care. To explore disparities in the treatment of substance use disorders (SUDs), we explored whether disparities in the probability of becoming engaged exist across racial/ethnic groups and whether engagement in treatment is associated equivalently with treatment outcomes for all racial/ethnic groups.
SUD treatment is effective in reducing substance use and its consequences (Hubbard et al., 2003; Prendergast et al., 2002), but some racial/ethnic minority groups are less likely to enter and complete treatment than Whites (AHRQ, 2013; Cook & Alegria, 2011; Jacobson et al., 2007b; Saloner & Cook, 2013).
Performance measures in treatment for substance use disorders
Treatment engagement, a process measure indicating whether clients are receiving timely services in the early stages of treatment, is currently being used by the National Committee for Quality Assurance (NCQA) to assess performance of health plans (NCQA, 2012) and by several states (Garnick et al., 2011). This measure has been endorsed by the National Quality Forum (NQF), an organization dedicated to endorsing national consensus standards for measuring performance (NQF, 2009), and is included in the Centers for Medicare & Medicaid Services incentive program for the meaningful use of electronic health records (MITRE Corporation, 2012).
Engagement is a two-stage process. The first stage, treatment initiation, is the process of receiving treatment within 14 days of a diagnosis. This treatment can be through an inpatient alcohol or other drug admission, outpatient visit, intensive outpatient encounter, or partial hospitalization.
Then, among clients who initiate treatment, engagement is the process of having two or more additional services within 30 days of the initiation service (NCQA, 2012). The suitability of the engagement measure for use in publicly funded specialty treatment has been evaluated by the Washington Circle Public Sector Workgroup, which recommended that performance measures be calculated separately by level of care (Garnick et al., 2009, 2011). We follow this recommendation and focus on engagement in outpatient treatment.
A growing body of literature demonstrates the association between treatment engagement and outcomes. Among adults, engagement in outpatient treatment is associated with improved substance use, employment, and criminal justice outcomes (Dunigan et al., 2014; Garnick et al., 2014; Harris et al., 2010). Among adolescents, those engaging in outpatient treatment had significantly lower likelihoods of reporting substance use at follow-up (Garnick et al., 2012).
Disparities in treatment of substance use disorders
It is also important to understand whether clients from different racial/ethnic backgrounds have different likelihoods for becoming engaged in treatment. There are widely documented racial/ethnic disparities in processes of care for general medical conditions (AHRQ, 2013; Institute of Medicine [IOM], 2002), but less is known about disparities in treatment for SUDs. Among adult clients receiving treatment in Oklahoma’s publicly funded specialty system, Black clients were less likely to meet the treatment initiation criteria compared with White clients (Acevedo et al., 2012). In addition, among adolescents in outpatient treatment programs, Latino clients were significantly less likely to engage in treatment than White clients (Lee et al., 2012).
To assess whether disparities exist, we used the IOM definition. Disparities are differences in the quality of health care that are not based on individual preferences, clinical need, or appropriateness of intervention (IOM, 2002). For example, differences that are attributable to the healthcare, legal, or regulatory system or to socioeconomic status (SES) are disparities and should be considered unfair (Cook et al., 2009).
Criminal justice involvement as outcome
Performance measures are more widely accepted when there is evidence that meeting the criteria is associated with improved outcomes (Horgan & Garnick, 2005). Involvement with the criminal justice system and SUDs are intrinsically linked, making it crucial to study criminal justice outcomes in the context of performance measures for SUD treatment. An estimated 13% of all arrests reported are for drug-related offenses (Bureau of Justice Statistics, n.d.), a third of state and a quarter of federal inmates report they committed their offenses under the influence of drugs, and almost 20% of state and federal prisoners report they were motivated to commit crimes to obtain money for drugs (Mumola & Karberg, 2007). In addition, the criminal justice system is the largest source of referral to specialty treatment (Substance Abuse and Mental Health Services Administration [SAMHSA], 2013b).
It is important to know whether engagement predicts reduced criminal justice involvement equally across all racial and ethnic groups. Although Hispanics and non-Hispanic Blacks make up approximately 30% of the U.S. population, they make up more than 60% of the prison population (Guerino et al., 2012; Humes et al., 2011). The Black arrest rate for drug possession is approximately three times that of Whites (Snyder, 2011), even though the past-month illegal drug use rate for Blacks (11.3%) is only slightly higher than for Whites (9.2%) (SAMHSA, 2013a).
Goals of study
In a previous study using data from publicly funded specialty treatment from four states, engagement in outpatient treatment was associated with improved criminal justice outcomes in all states (Garnick et al., 2014). In addition, beyond the effect of engagement, in several states, clients from some minority groups had higher rates of arrests than White clients. In this article, we used the same data to explore whether race/ethnicity may be moderating the effect of engagement in outpatient treatment on subsequent criminal justice involvement.
The goals of the present study were to (a) explore whether there are racial/ethnic disparities in the probability of treatment engagement and (b) examine whether treatment engagement is associated with similar reductions in likelihood of arrest for Whites, Blacks, Latinos, and American Indians. We hypothesized that disparities would exist in treatment engagement and that engagement might have differential effects on subsequent arrests by clients’ race/ethnicity.
Method
Data sources
This study focused on adult clients receiving publicly funded treatment for SUDs in specialty settings in 2008 in Connecticut, New York, Oklahoma, and Washington. Each state linked treatment data with arrest and incarceration data from their criminal justice agencies (e.g., Department of Corrections, state patrols) and stripped all personally identifying information before sending data to the study’s analytic team. In Washington and Connecticut, the Link King software, which uses probabilistic matching, was used for linking the data (Campbell et al., 2008). In Oklahoma, probabilistic matching was used based on last name, first name, Social Security number, date of birth, gender, and race. In New York, deterministic matching was used that included date of birth, gender, and parts of the Social Security number.
The SUD treatment data included admission intake information such as client demographics (e.g., age, gender, race/ethnicity), treatment referral source, and self-reported substance use. With the exception of New York, states provided encounter data that included dates and types of services the client received. The study protocol was reviewed and approved by the Brandeis University Institutional Review Board (IRB) and by state IRBs.
Sample selection
The study sample was made up of adult clients who began a new outpatient SUD treatment episode in 2008. A new outpatient treatment episode is triggered by receipt of outpatient treatment or admission (the index visit) after at least 60 days during which no treatment services are received. To avoid possible correlations from multiple episodes within the same subject, only each client’s first episode in 2008 was used.
We excluded clients who did not have an admission record within 30 days of the index date, had missing data in any of the variables of interest, were incarcerated for 30 days or more within 45 days after their index dates, or were the only client with a new treatment episode in 2008 at their facility. In the analysis predicting time to arrest, we further excluded clients who died within the year after discharge and those who were arrested before they had a full opportunity to engage. After all exclusions, the final analytic sample consisted of the following number of clients in each state: Connecticut = 5,666; New York = 86,476; Oklahoma = 8,105; Washington = 8,407 for the analysis predicting treatment engagement, and Connecticut = 5,191; New York = 85,210; Oklahoma = 7,777; Washington = 7,797 for the analysis predicting arrests. The proportion of exclusions varied by state (Connecticut = 29%, New York = 3%, Oklahoma = 39%, Washington = 11%) (see Garnick et al., 2014, for details on exclusions). Some variation within states by race/ethnicity also existed (e.g., a higher proportion of Blacks were excluded in Washington; in Oklahoma, a higher proportion of Whites were excluded).
Variables
Outcome variables
(A) TREATMENT ENGAGEMENT: For all states but New York, we used the Washington Circle public sector specifications for initiation and engagement in outpatient treatment (Garnick et al., 2009). A client who receives at least one service within 14 days after the index outpatient service is considered to have initiated treatment. Treatment engagement is then defined as receiving at least two additional services within 30 days after the initiation visit. New York does not have encounter data. However, facilities report at discharge the total number of treatment visits provided to each client during the treatment episode, and clients are considered to be engaged if they had at least four treatment visits and either had a length of stay longer than 30 days or had another treatment admission within 30 days of the first admission.
(B) TIME TO AN ARREST: For the analysis of the association of engagement with arrest, the outcome is defined as time to any arrest measured as the number of days between Time 0 and the client’s first arrest. Because of the risk of bias attributable to the time during which exposure (i.e., engagement) could not yet have occurred (Suissa, 2008), we defined Time 0 as 45 days after the index date, the latest date by which their engagement status can be determined. We removed from the sample all clients arrested before their own Time 0, as they would not have had the opportunity to have engaged, and including them would have biased the sample toward rejecting the null hypotheses of no association between engagement and arrest. We censored the client’s time-to-event at 365 days when no arrest was found before that time.
Race/ethnicity.
Each state collects data on race and ethnicity separately, although they differ in level of detail. Hispanic/Latino ethnicity was assessed using either a dichotomous variable or with more detailed Latino subgroups. The race categories included at a minimum the following five groups: White, American Indian/Alaskan Native, Asian, Black/African American, and Native Hawaiian/Pacific Islander. Some states had an option for other, some allowed for two or more races to be selected, and Washington included a broader range of subgroups (e.g., Aleut, Vietnamese). For this study, the IOM (2009) method for rolling up granular ethnicities into major racial categories was used to create the following race/ethnicity categories: Latino (of Hispanic/Latino origin, regardless of race), non-Hispanic White, non-Hispanic Black, non-Hispanic American Indian, and other (all other groups, those selecting more than one race, and American Indians in Connecticut and New York, where they made up <1% of the sample).
Covariates
Covariates consist of client and facility variables. Unless noted, client characteristics are based on client self-report as collected at admission.
Client demographics.
Demographic variables included gender, age, education, homelessness, marital status, employment status, residence in a rural area, and prior-year arrest/incarceration. Marital status and employment status variables were excluded in Connecticut because of missing data. To determine whether clients lived in rural areas, we linked each client’s zip code of residence to its Rural Urban Commuting Area Code (WWAMI Rural Health Research Center, 2007). Clients were determined to have prior-year (365 days before their index) arrest or incarceration based on data from state criminal justice agencies.
Substance use and treatment referral.
Two covariates were created to reflect the client’s substance use: a set of indicators for whether they reported using specific substances within the month before treatment admission and the earliest age at first use of substances within the groups. We also included referral source with categories for self/family, community agency or group (e.g., child protective services), SUD service (e.g., another SUD treatment program), other health professional (e.g., medical provider), criminal justice system, and other (e.g., employer). Referral source was excluded in Connecticut because of missing data.
Client characteristics aggregated at the facility level.
For the models predicting time to arrest, we included three variables that aggregate client characteristics to the facility level: the proportion of outpatient adult clients admitted in 2008 who met the engagement criteria, the proportion of clients who had an arrest or incarceration in the year before the index, and the proportion of clients whose admission records indicated use of drugs other than alcohol and marijuana. These variables were included as covariates in the analysis of race/ethnicity as moderator in the relationship of treatment engagement and arrest because of the importance of considering facility performance rates (Finney et al., 2011) and client case-mix in studies of the relationship between performance measures and outcomes. Proportions were calculated before client exclusions.
Time to initiation.
To examine how rapid initiation itself may affect engagement and disparities in engagement, for Connecticut, Oklahoma, and Washington, the time (in days) from the index visit to treatment initiation was included in the model predicting engagement along with interactions with the race/ethnicity indicators.
Analysis
All analyses were conducted separately by state. To get some initial perspective on our samples of clients, we first examined their characteristics, treatment initiation, engagement, and arrest rates by race/ethnicity. Arrests rates were also broken down for client groups defined by both engagement status and race/ethnicity.
Analysis of racial/ethnic disparities in outpatient treatment engagement
To examine racial/ethnic disparities in treatment engagement, accounting for initiation status and time to initiation, we used the two-stage Heckprob routine (StataCorp, 2009), a form of Heckman procedure, which models two linked dichotomous outcomes. We used this model because treatment engagement is conditional on treatment initiation, but there is selection bias in considering individuals who have already initiated as compared with the broader population of people who begin a new outpatient treatment episode. In our study, these models were Stage 1: a probit equation predicting treatment initiation, and Stage 2: a probit equation associating race/ethnicity with engagement after adjusting for other covariates.
For both specifications, variables in the first stage model included clients’ race/ethnicity with all individual client covariates except the SES-related variables (employment status, education, and homelessness status). Variables in the second stage model, predicting engagement, also included the variable indicating the number of days from the index visit to the initiation visit as well as interaction terms of that variable with race/ethnicity. The interaction was included to test whether a shorter time to initiation benefitted all groups similarly in terms of the likelihood of engaging in treatment. As a sensitivity analysis, we added the SES variables to examine whether SES was a mediating factor for racial/ethnic disparities observed with respect to engagement.
Analysis of race/ethnicity as moderator of the relationship between treatment engagement and subsequent arrests
We used hierarchical time-to-event analysis to test whether the relationship between outpatient engagement and arrests differed by racial/ethnic group with clustering of clients within facility controlled for, which might lead to correlation of their outcomes (Therneau & Grambsch, 2000). The outcome variable in our time-to-event models was time to arrest, measured in days. In these models, our key independent variables were engagement, race/ethnicity, and the interaction of race/ethnicity and engagement. To adjust for other factors that might affect outcome, the models included both client-level and facility-level covariates created from aggregate client data, as described earlier. Survival analyses express the effects of covariates in terms of hazard ratios (HRs), which reflect the modeled difference in likelihood of outcome because of the covariate.
Results
Sample description
Summary characteristics of the analytic sample provided in Table 1 demonstrate large variation in the racial/ethnic make-up of clients by state. Oklahoma and Washington had the highest percentage of clients who were American Indian (14.0% and 12.0%, respectively), New York had the highest proportion of Black clients (28.9%), and Connecticut and New York had the largest proportion of Latino clients (21.7% and 19.2%).
Table 1.
Client characteristics at beginning of new episode of outpatient treatment by state (%)
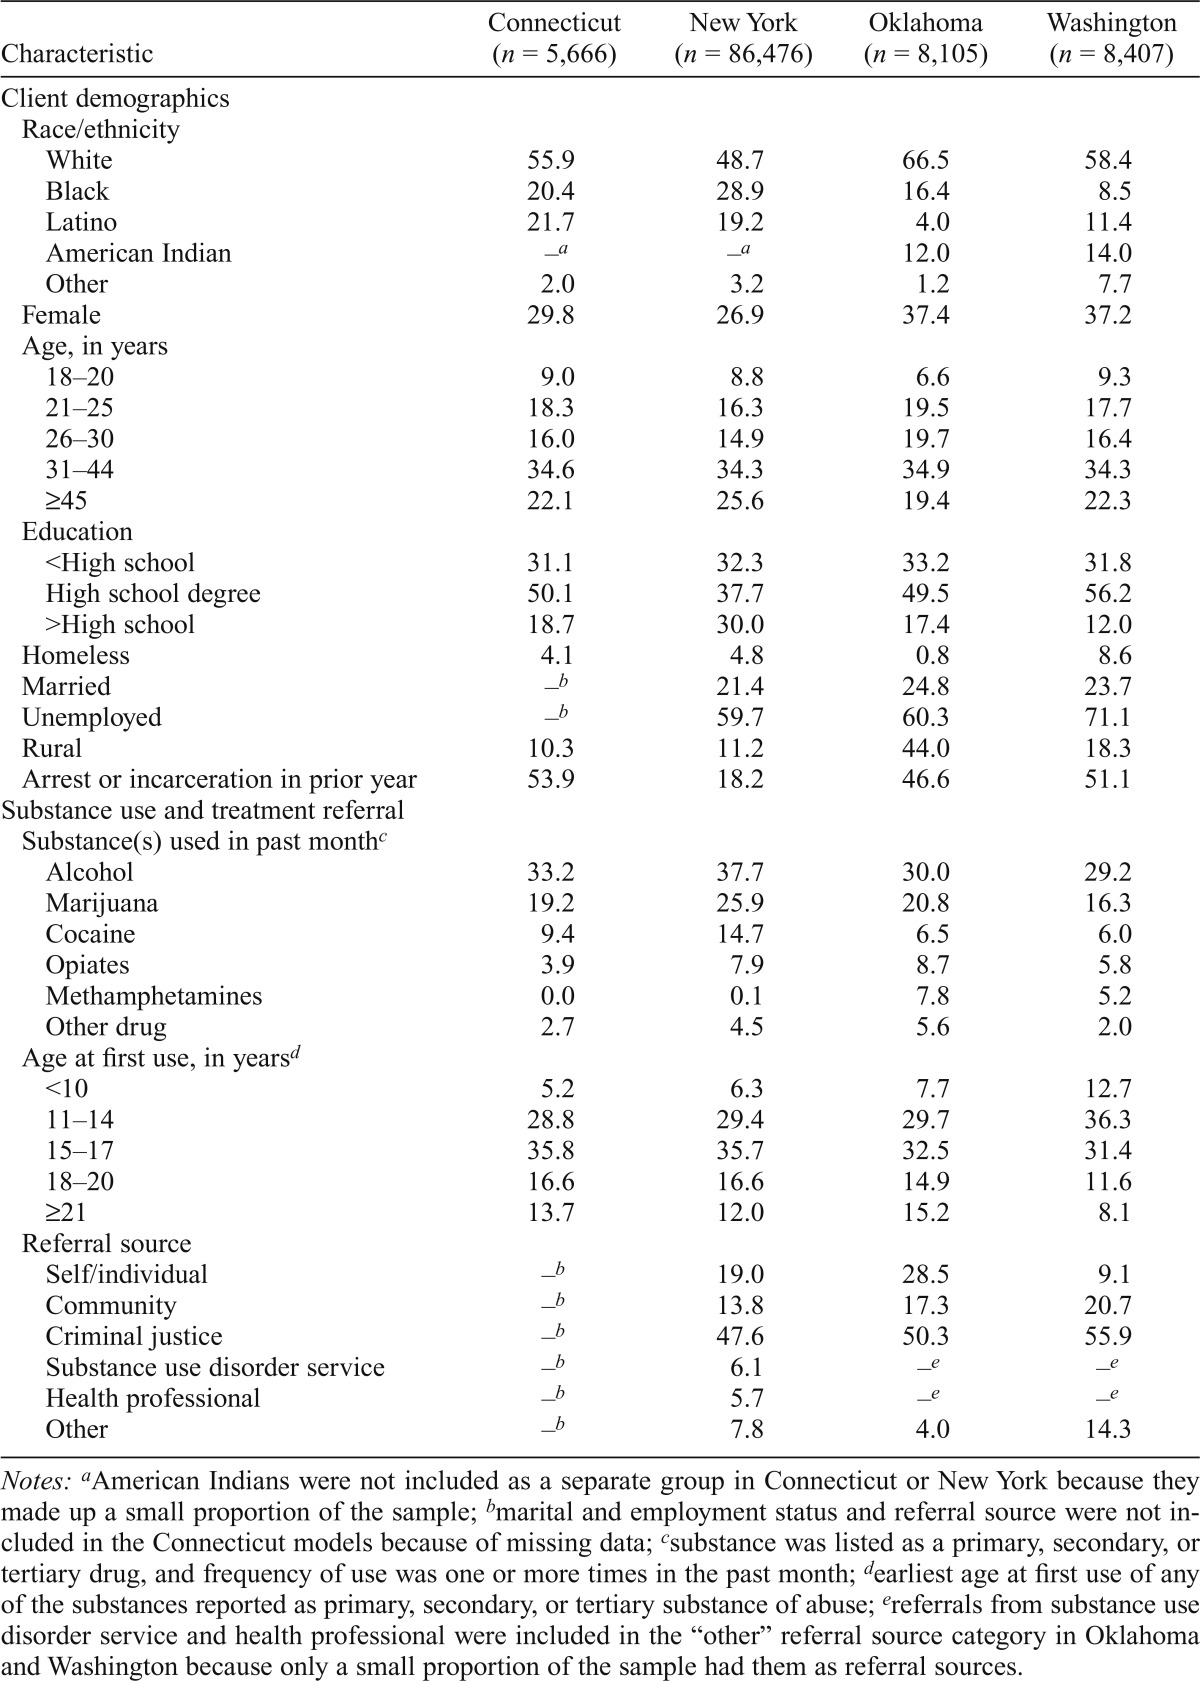
| Characteristic | Connecticut (n = 5,666) | New York (n = 86,476) | Oklahoma (n = 8,105) | Washington (n = 8,407) |
| Client demographics | ||||
| Race/ethnicity | ||||
| White | 55.9 | 48.7 | 66.5 | 58.4 |
| Black | 20.4 | 28.9 | 16.4 | 8.5 |
| Latino | 21.7 | 19.2 | 4.0 | 11.4 |
| American Indian | –a | –a | 12.0 | 14.0 |
| Other | 2.0 | 3.2 | 1.2 | 7.7 |
| Female | 29.8 | 26.9 | 37.4 | 37.2 |
| Age, in years | ||||
| 18–20 | 9.0 | 8.8 | 6.6 | 9.3 |
| 21–25 | 18.3 | 16.3 | 19.5 | 17.7 |
| 26–30 | 16.0 | 14.9 | 19.7 | 16.4 |
| 31–44 | 34.6 | 34.3 | 34.9 | 34.3 |
| ≥45 | 22.1 | 25.6 | 19.4 | 22.3 |
| Education | ||||
| <High school | 31.1 | 32.3 | 33.2 | 31.8 |
| High school degree | 50.1 | 37.7 | 49.5 | 56.2 |
| >High school | 18.7 | 30.0 | 17.4 | 12.0 |
| Homeless | 4.1 | 4.8 | 0.8 | 8.6 |
| Married | –b | 21.4 | 24.8 | 23.7 |
| Unemployed | –b | 59.7 | 60.3 | 71.1 |
| Rural | 10.3 | 11.2 | 44.0 | 18.3 |
| Arrest or incarceration in prior year | 53.9 | 18.2 | 46.6 | 51.1 |
| Substance use and treatment referral | ||||
| Substance(s) used in past monthc | ||||
| Alcohol | 33.2 | 37.7 | 30.0 | 29.2 |
| Marijuana | 19.2 | 25.9 | 20.8 | 16.3 |
| Cocaine | 9.4 | 14.7 | 6.5 | 6.0 |
| Opiates | 3.9 | 7.9 | 8.7 | 5.8 |
| Methamphetamines | 0.0 | 0.1 | 7.8 | 5.2 |
| Other drug | 2.7 | 4.5 | 5.6 | 2.0 |
| Age at first use, in yearsd | ||||
| <10 | 5.2 | 6.3 | 7.7 | 12.7 |
| 11–14 | 28.8 | 29.4 | 29.7 | 36.3 |
| 15–17 | 35.8 | 35.7 | 32.5 | 31.4 |
| 18–20 | 16.6 | 16.6 | 14.9 | 11.6 |
| ≥21 | 13.7 | 12.0 | 15.2 | 8.1 |
| Referral source | ||||
| Self/individual | –b | 19.0 | 28.5 | 9.1 |
| Community | –b | 13.8 | 17.3 | 20.7 |
| Criminal justice | –b | 47.6 | 50.3 | 55.9 |
| Substance use disorder service | –b | 6.1 | –e | –e |
| Health professional | –b | 5.7 | –e | –e |
| Other | –b | 7.8 | 4.0 | 14.3 |
Notes:
American Indians were not included as a separate group in Connecticut or New York because they made up a small proportion of the sample;
marital and employment status and referral source were not included in the Connecticut models because of missing data;
substance was listed as a primary, secondary, or tertiary drug, and frequency of use was one or more times in the past month;
earliest age at first use of any of the substances reported as primary, secondary, or tertiary substance of abuse;
referrals from substance use disorder service and health professional were included in the “other” referral source category in Oklahoma and Washington because only a small proportion of the sample had them as referral sources.
The four states demonstrated other differences in client characteristics, including types of drugs used, proportion of clients who were homeless or unemployed, and proportion of clients living in rural areas. Approximately half of the outpatient clients in Connecticut, Oklahoma, and Washington had had an arrest or incarceration in the year before beginning their outpatient treatment episode; in New York, the percentage was lower (18.2%).
Performance measures and arrest rates by race/ethnicity
Table 2 shows unadjusted performance measure rates and arrest rates by race/ethnicity for each state. Black and American Indian clients had significantly lower initiation rates than Whites in Washington, and Latinos had significantly higher rates than White clients in Washington and New York. Blacks also had significantly lower engagement rates than Whites in Connecticut, New York, and Washington, and Latinos had significantly higher engagement rates in New York and Washington. In Washington, engagement rates were significantly lower for American Indians than for Whites, whereas in Oklahoma, engagement among American Indian clients was higher than among White clients.
Table 2.
Client arrest and engagement rates by client’s race/ethnicity and state
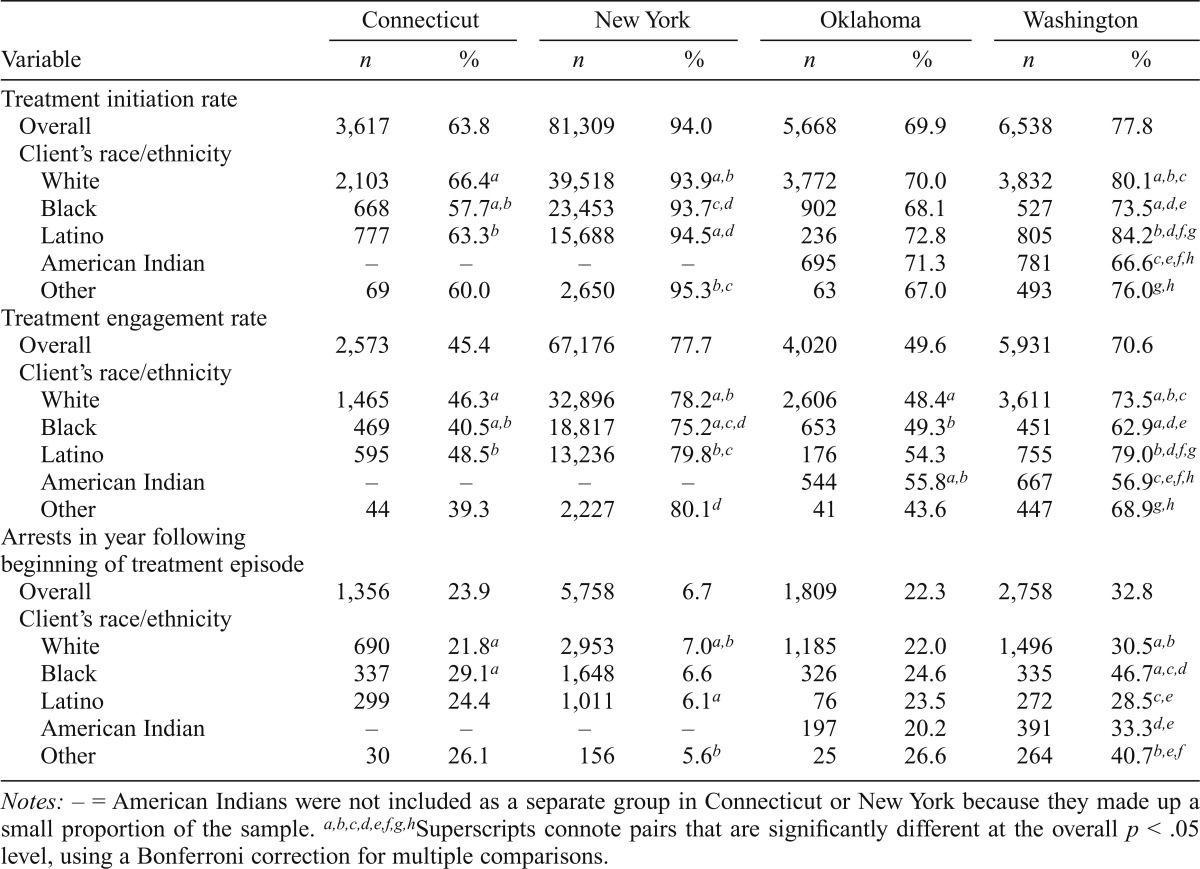
| Connecticut |
New York |
Oklahoma |
Washington |
|||||
| Variable | n | % | n | % | n | % | n | % |
| Treatment initiation rate | ||||||||
| Overall | 3,617 | 63.8 | 81,309 | 94.0 | 5,668 | 69.9 | 6,538 | 77.8 |
| Client’s race/ethnicity | ||||||||
| White | 2,103 | 66.4a | 39,518 | 93.9a,b | 3,772 | 70.0 | 3,832 | 80.1a,b,c |
| Black | 668 | 57.7a,b | 23,453 | 93.7c,d | 902 | 68.1 | 527 | 73.5a,d,e |
| Latino | 777 | 63.3b | 15,688 | 94 5a,d | 236 | 72.8 | 805 | 84.2b,d,f,g |
| American Indian | – | – | – | – | 695 | 71.3 | 781 | 66.6c,e,f,h |
| Other | 69 | 60.0 | 2,650 | 95.3b,c | 63 | 67.0 | 493 | 76.0g,h |
| Treatment engagement rate | ||||||||
| Overall | 2,573 | 45.4 | 67,176 | 77.7 | 4,020 | 49.6 | 5,931 | 70.6 |
| Client’s race/ethnicity | ||||||||
| White | 1,465 | 46.3a | 32,896 | 78.2a,b | 2,606 | 48.4a | 3,611 | 73.5a,b,c |
| Black | 469 | 40.5a,b | 18,817 | 75.2a,c,d | 653 | 49.3b | 451 | 62.9a,d,e |
| Latino | 595 | 48.5b | 13,236 | 79.8b,c | 176 | 54.3 | 755 | 79.0b,d,f,g |
| American Indian | – | – | – | – | 544 | 55.8a,b | 667 | 56.9c,e,f,h |
| Other | 44 | 39.3 | 2,227 | 80.1d | 41 | 43.6 | 447 | 68.9g,h |
| Arrests in year following | ||||||||
| beginning of treatment episode | ||||||||
| Overall | 1,356 | 23.9 | 5,758 | 6.7 | 1,809 | 22.3 | 2,758 | 32.8 |
| Client’s race/ethnicity | ||||||||
| White | 690 | 21.8a | 2,953 | 7.0a,b | 1,185 | 22.0 | 1,496 | 30.5a,b |
| Black | 337 | 29.1a | 1,648 | 6.6 | 326 | 24.6 | 335 | 46.7a,c,d |
| Latino | 299 | 24.4 | 1,011 | 6.1a | 76 | 23.5 | 272 | 28.5c,e |
| American Indian | _ | _ | _ | _ | 197 | 20.2 | 391 | 33.3d,e |
| Other | 30 | 26.1 | 156 | 5.6b | 25 | 26.6 | 264 | 40.7b,e,f |
Notes: – = American Indians were not included as a separate group in Connecticut or New York because they made up a small proportion of the sample.
Superscripts connote pairs that are significantly different at the overall p < .05 level, using a Bonferroni correction for multiple comparisons.
In all states but Oklahoma, significant racial/ethnic differences also existed in the proportion of clients who were arrested in the year following the beginning of an outpatient treatment episode. In Connecticut and Washington, Black clients had significantly higher arrest rates than White clients. In New York, however, a higher proportion of White clients was arrested after beginning a new treatment episode compared with Latino clients. Table 3 shows arrest rates within each state based on engagement status and race/ethnicity. In New York, for each racial/ethnic group, clients who engaged had lower arrest rates than clients who did not. In Oklahoma, however, only among Whites and Blacks did clients who engaged have significantly lower arrest rates compared with clients who did not. There were no significant differences in arrest rates by treatment engagement status for Latino or American Indian clients or for clients in the other racial/ethnic category in Oklahoma. In Washington, arrest rates were significantly lower for White and Latino clients who engaged in treatment compared with those who did not; for Black and American Indian clients and those in the other racial/ethnic group category, however, being engaged was not associated with lower arrest rates. In Connecticut, there were no significant differences in arrest rates by engagement status for any of the racial/ethnic groups.
Table 3.
Client arrest rates in year following a new episode of outpatient treatment by race/ethnicity and engagement status
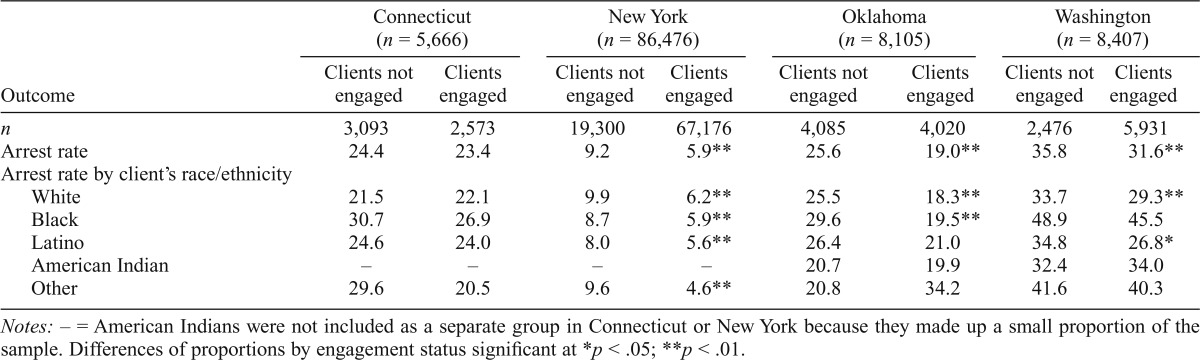
| Outcome | Connecticut (n = 5,666) |
New York (n = 86,476) |
Oklahoma (n = 8,105) |
Washington (n = 8,407) |
||||
| Clients not engaged | Clients engaged | Clients not engaged | Clients engaged | Clients not engaged | Clients engaged | Clients not engaged | Clients engaged | |
| n | 3,093 | 2,573 | 19,300 | 67,176 | 4,085 | 4,020 | 2,476 | 5,931 |
| Arrest rate | 24.4 | 23.4 | 9.2 | 5.9** | 25.6 | 19.0** | 35.8 | 31.6** |
| Arrest rate by client’s race/ethnicity | ||||||||
| White | 21.5 | 22.1 | 9.9 | 6.2** | 25.5 | 18.3** | 33.7 | 29.3** |
| Black | 30.7 | 26.9 | 8.7 | 5.9** | 29.6 | 19.5** | 48.9 | 45.5 |
| Latino | 24.6 | 24.0 | 8.0 | 5.6** | 26.4 | 21.0 | 34.8 | 26.8* |
| American Indian | – | – | – | – | 20.7 | 19.9 | 32.4 | 34.0 |
| Other | 29.6 | 20.5 | 9.6 | 4.6** | 20.8 | 34.2 | 41.6 | 40.3 |
Notes: – = American Indians were not included as a separate group in Connecticut or New York because they made up a small proportion of the sample. Differences of proportions by engagement status significant at
p < .05;
p < .01.
Racial/ethnic disparities in treatment initiation and engagement
Table 4 shows the effects of our main variables of interest on treatment initiation and engagement. The model predicting treatment initiation indicated that Black clients in Connecticut and American Indian clients in Washington were significantly less likely to initiate treatment than were White clients. Regarding treatment engagement, the model indicated that Black clients in New York and American Indian clients in Washington were significantly less likely to engage compared with White clients. In these models of engagement, we also found that the number of days between the index and the second visit (“initiation”) negatively associated with the likelihood of treatment engagement in all three states where we had data to calculate the value (Connecticut, Oklahoma, and Washington), and there was no evidence that this effect differed by race/ethnicity.
Table 4.
Results of two-stage probit regression predicting treatment initiation and engagement (not including socioeconomic variables)
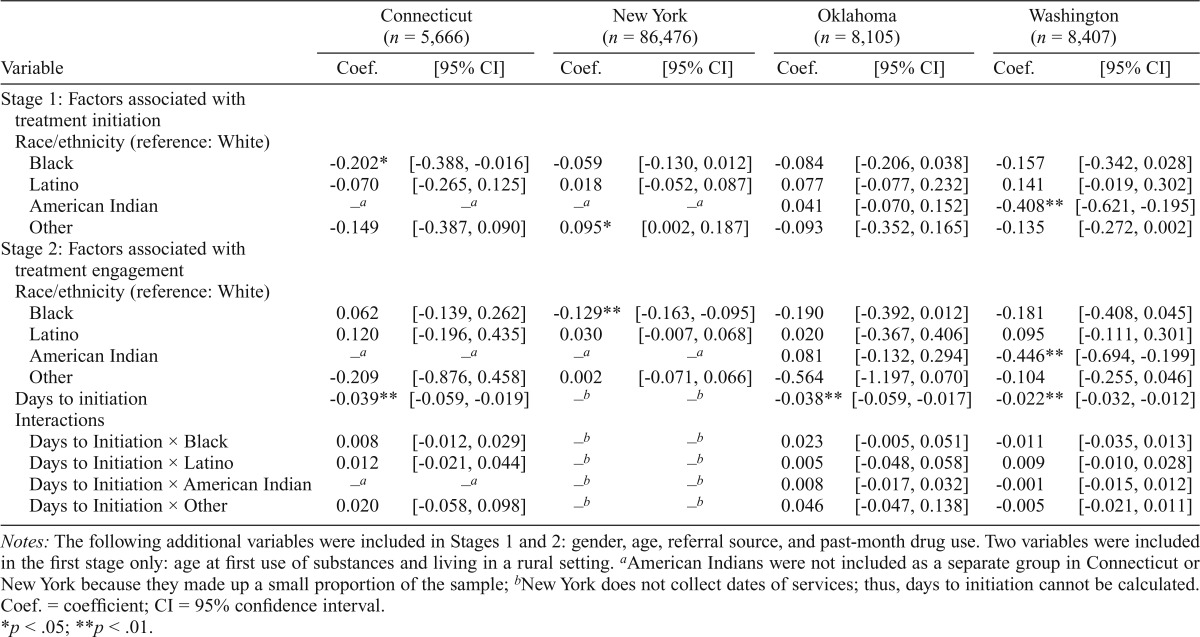
| Variable | Connecticut (n = 5,666) |
New York (n = 86,476) |
Oklahoma (n = 8,105) |
Washington (n = 8,407) |
||||
| Coef. | [95% CI] | Coef. | [95% CI] | Coef. | [95% CI] | Coef. | [95% CI] | |
| Stage 1: Factors associated with treatment initiation | ||||||||
| Race/ethnicity (reference: White) | ||||||||
| Black | -0.202* | [-0.388, -0.016] | -0.059 | [-0.130, 0.012] | -0.084 | [-0.206, 0.038] | -0.157 | [-0.342, 0.028] |
| Latino | -0.070 | [-0.265, 0.125] | 0.018 | [-0.052, 0.087] | 0.077 | [-0.077, 0.232] | 0.141 | [-0.019, 0.302] |
| American Indian | –a | –a | –a | –a | 0.041 | [-0.070, 0.152] | -0.408** | [-0.621, -0.195] |
| Other | -0.149 | [-0.387, 0.090] | 0.095* | [0.002, 0.187] | -0.093 | [-0.352, 0.165] | -0.135 | [-0.272, 0.002] |
| Stage 2: Factors associated with treatment engagement | ||||||||
| Race/ethnicity (reference: White) | ||||||||
| Black | 0.062 | [-0.139, 0.262] | -0.129** | [-0.163, -0.095] | -0.190 | [-0.392, 0.012] | -0.181 | [-0.408, 0.045] |
| Latino | 0.120 | [-0.196, 0.435] | 0.030 | [-0.007, 0.068] | 0.020 | [-0.367, 0.406] | 0.095 | [-0.111, 0.301] |
| American Indian | –a | –a | –a | –a | 0.081 | [-0.132, 0.294] | -0.446** | [-0.694, -0.199] |
| Other | -0.209 | [-0.876, 0.458] | 0.002 | [-0.071, 0.066] | -0.564 | [-1.197, 0.070] | -0.104 | [-0.255, 0.046] |
| Days to initiation | -0.039** | [-0.059, -0.019] | –b | –b | -0.038** | [-0.059, -0.017] | -0.022** | [-0.032, -0.012] |
| Interactions | ||||||||
| Days to Initiation × Black | 0.008 | [-0.012, 0.029] | –b | –b | 0.023 | [-0.005, 0.051] | -0.01 | [-0.035, 0.013] |
| Days to Initiation × Latino | 0.012 | [-0.021, 0.044] | –b | –b | 0.005 | [-0.048, 0.058] | 0.009 | [-0.010, 0.028] |
| Days to Initiation × American Indian | –a | –a | –b | –b | 0.008 | [-0.017, 0.032] | -0.001 | [-0.015, 0.012] |
| Days to Initiation × Other | 0.020 | [-0.058, 0.098] | –b | –b | 0.046 | [-0.047, 0.138] | -0.005 | [-0.021, 0.011] |
Notes: The following additional variables were included in Stages 1 and 2: gender, age, referral source, and past-month drug use. Two variables were included in the first stage only: age at first use of substances and living in a rural setting.
American Indians were not included as a separate group in Connecticut or New York because they made up a small proportion of the sample;
New York does not collect dates of services; thus, days to initiation cannot be calculated. Coef. = coefficient; CI = 95% confidence interval.
p < .05;
p < .01.
Sensitivity analysis
The addition of SES-related variables to the models (i.e., education, employment status [except in Connecticut], and homelessness) mediated the significance of race/ethnicity effects in some cases. In Connecticut, adjusting for SES caused the disparity in likelihood of treatment initiation between Black and White clients to disappear. Adjusting for SES in the New York model caused the difference in likelihood of engagement between Latino and White clients to become significant, with Latinos being more likely to engage than were White clients. The lower likelihood of initiation and engagement by American Indians in Washington remained significant after adjusting for SES, as did the disparity in engagement by Black clients in New York.
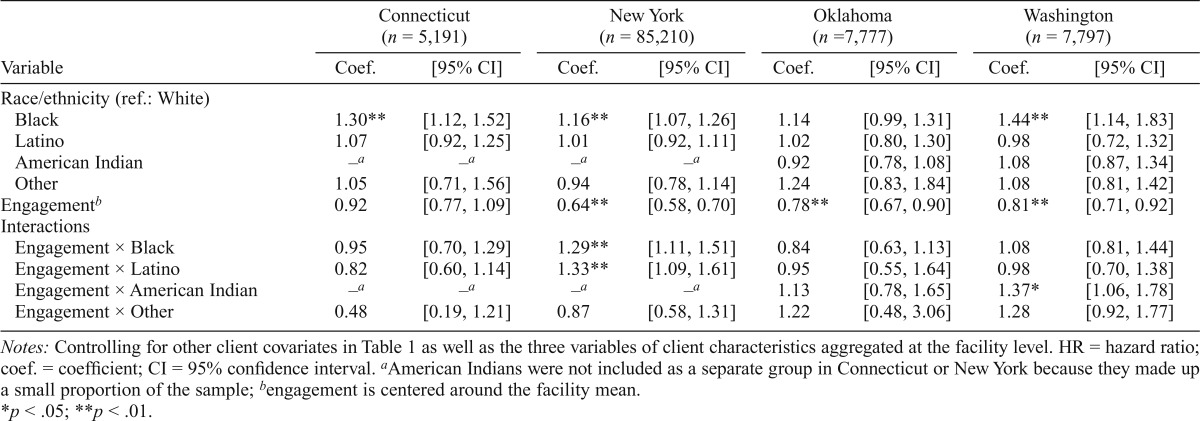
Race/ethnicity as a moderator of relationship of engagement and arrests
Table 5 shows the effects of our main variables of interest, race/ethnicity indicator, engagement status, and their interactions in survival analysis models. With regard to race/ethnicity, Black clients had higher hazards of an arrest than White clients in Connecticut (HR = 1.30, p < .01), New York (HR = 1.16, p < .01), and Washington (HR = 1.44, p < .01), but no significant difference in hazard between Black and White clients was found in Oklahoma. Thus, at any point in time after beginning outpatient treatment in Connecticut, clients who had not yet been arrested had a 30% higher likelihood of arrest if they were Black than if they were White. Similarly, New York clients who were Black had a 16% higher likelihood of arrest, and Washington clients who were Black were at 44% higher risk of arrest than clients who were White.
Table 5.
Survival analysis of an arrest after beginning a new episode of outpatient treatment
| Variable | Connecticut (n = 5,191) |
New York (n = 85,210) |
Oklahoma (n = 7,777) |
Washington (n = 7,797) |
||||
| Coef. | [95% CI] | Coef. | [95% CI] | Coef. | [95% CI] | Coef. | [95% CI] | |
| Race/ethnicity (ref.: White) | ||||||||
| Black | 1.30** | [1.12, 1.52] | 1.16** | [1.07, 1.26] | 1.14 | [0.99, 1.31] | 1.44** | [1.14, 1.83] |
| Latino | 1.07 | [0.92, 1.25] | 1.01 | [0.92, 1.11] | 1.02 | [0.80, 1.30] | 0.98 | [0.72, 1.32] |
| American Indian | .–a | –a | –a | –a | 0.92 | [0.78, 1.08] | 1.08 | [0.87, 1.34] |
| Other | 1.05 | [0.71, 1.56] | 0.94 | [0.78, 1.14] | 1.24 | [0.83, 1.84] | 1.08 | [0.81, 1.42] |
| Engagementb | 0.92 | [0.77, 1.09] | 0.64** | [0.58, 0.70] | 0.78** | [0.67, 0.90] | 0.81** | [0.71, 0.92] |
| Interactions | ||||||||
| Engagement × Black | 0.95 | [0.70, 1.29] | 1.29** | [1.11, 1.51] | 0.84 | [0.63, 1.13] | 1.08 | [0.81, 1.44] |
| Engagement × Latino | 0.82 | [0.60, 1.14] | 1.33** | [1.09, 1.61] | 0.95 | [0.55, 1.64] | 0.98 | [0.70, 1.38] |
| Engagement × American Indian | –a | .–a | –a | .–a | 1.13 | [0.78, 1.65] | 1.37* | [1.06, 1.78] |
| Engagement × Other | 0.48 | [0.19, 1.21] | 0.87 | [0.58, 1.31] | 1.22 | [0.48, 3.06] | 1.28 | [0.92, 1.77] |
Notes: Controlling for other client covariates in Table 1 as well as the three variables of client characteristics aggregated at the facility level. HR = hazard ratio; coef. = coefficient; CI = 95% confidence interval.
American Indians were not included as a separate group in Connecticut or New York because they made up a small proportion of the sample;
engagement is centered around the facility mean.
p < .05;
p <.01.
Engagement was significantly associated with lower hazards of an arrest in New York (HR = 0.64, p < .01), Oklahoma (HR = 0.78, p < .01), and Washington (HR = 0.81, p < .01), but not in Connecticut. At any time after beginning their outpatient treatment episode, in New York, engaged clients who had not yet been arrested had 36% less likelihood of arrest than not-engaged clients; in Oklahoma, similar engaged clients had a 22% lower likelihood of arrest; and in Washington, engaged clients had a 19% lower likelihood of arrest than clients who did not engage.
Because interactions between engagement and race/ethnicity are included in our models, the full effect of engagement among White clients is estimated by these main effects, but estimates of the full effect of engagement on clients in other racial/ethnic groups requires incorporation of interaction terms as well. In New York, the interaction terms for engagement and Black (HR = 1.29, p < .01) and for engagement and Latino (HR = 1.33, p < .01) were both highly significant and substantially counteracted the main effect of engagement. Among Black clients in New York, the net effect of engagement was a nonsignificant 4% reduction; among Latino clients in New York, the net effect was a similar, nonsignificant 14% reduction. In Washington, the interaction term between engagement and American Indian was statistically significant (HR = 1.37, p < .05), and as such completely counteracted the main effect of engagement. For all other racial/ethnic groups in Washington (i.e., Black, Latino, and other) and for all racial/ethnic groups in Connecticut and Oklahoma, the interaction terms between engagement and the race/ethnicity indicators were not statistically significant. Thus, the effects of engagement on these racial/ethnic groups are statistically indistinguishable from the effect for Whites.
Discussion
This study explores two crucial issues for assessing whether there are disparities in the quality of treatment for SUDs: (a) Is there disparity by race/ethnicity in receiving adequate treatment according to the performance measure, and (b) is any effect of receiving a well-established threshold of services similar across racial/ethnic groups?
Racial/ethnic disparities in treatment engagement
Some groups are less likely to receive the widely accepted minimal level of outpatient treatment for SUDs. Our analyses found disparities in likelihood of engagement between Whites and Blacks in New York and between Whites and American Indians in Washington. These findings are consistent with national evidence of disparities in treatment completion (AHRQ, 2013; Saloner & Cook, 2013).
Disparities in treatment engagement may be attributable to differences in clients’ circumstances and/or differences in the characteristics of the facilities where minority clients receive treatment. Prior research shows that Latinos and Blacks are less satisfied with alcohol psychotherapies or with SUD treatment in general (Tonigan, 2003; Wells et al., 2001) and that socioeconomic factors significantly associate with disparities in completion of treatment (Jacobson et al., 2007a; Saloner & Cook, 2013). In the current study, we found that socioeconomic factors reduced the disparities in performance measures focusing in the early stages of treatment in some cases.
Characteristics of the facilities where minority clients receive treatment may also contribute to their disparity in engagement. Some facilities may not adequately address cultural aspects of minority clients, making them less likely to return for treatment services. The cultural sensitivity of outpatient treatment program directors is associated with treatment retention (Guerrero & Andrews, 2011). Minority clients may also access treatment in facilities that have lower outpatient engagement rates overall. It is acknowledged that minority clients tend to receive their medical care in lower performing hospitals (Gaskin et al., 2008; Hasnain-Wynia et al., 2007; Jha et al., 2008), and it is unclear whether the same occurs in specialty SUD treatment and whether minorities in need of treatment have access to high performing facilities. It is also unclear whether higher performing treatment programs are located in communities in which minority clients reside. Future studies should explore how factors at the individual, facility (e.g., staffing, resources), and community (e.g., availability of a high performing facility in the community) levels may affect the receipt of high-quality treatment for SUDs.
Differences in the impact of engagement on criminal justice outcomes by race/ethnicity
In general, engagement reduced the likelihood of arrest; however, our models indicate that New York, in particular, provided strong and consistent evidence of a reduction in the effect of engagement on criminal justice involvement for Black and Latino clients. Clearly, interaction effects of engagement and race/ethnicity vary by state because of factors not available in this study, including law enforcement’s criteria for arrest, but we believe New York’s results were also helped by its much larger sample, at least 10 times larger than any other state. In Washington, engagement predicted lower arrest rates for all groups except American Indians, where it predicted higher arrests.
Racial/ethnic differences in the relationship between engagement and subsequent arrest may, in part, be attributable to factors outside the influence of treatment. Factors that affect arrest rates may differ across racial/ethnic groups. Bias by law enforcement, including differential conditions for arrest, has been well documented (Bureau of Justice Statistics, 2011; DeLisi, 2011; Farrell & McDevitt, 2006; Roh & Robinson, 2009). In particular, Blacks are overrepresented in arrests for drug possession, even though the rates of current drug use are fairly similar for Blacks and Whites (SAMHSA, 2013a; Snyder, 2011). Thus, engagement, which focuses on clinical treatment, may not be as effective in changing arrest rates.
Our results suggest that racial/ethnic minority clients could benefit from additional support to prevent future criminal justice involvement. As an example, programs might make more efforts to provide employment counseling or training to prepare for re-entry to the community. Employment has been shown to prevent recidivism (Uggen, 2000), and unemployment rates are substantially higher among some minority groups. Minority offenders are less likely to expect to be reintegrated into the community than Whites (Benson et al., 2011). If programs serving minority clients had the resources to provide employment training, there could be a multiple effect of both increased employment and reduced arrests among their clients.
One unexpected finding was that engagement was associated with a higher hazard of arrest for American Indians in the state of Washington. Engagement may be a marker for something else for this group that we are not properly controlling for. A deeper examination of the context of treatment among American Indian populations in the state is warranted.
Limitations
There are several data limitations to this study. In cases in which a client did not have an arrest, we cannot be sure that an arrest did not take place, as the client may have been arrested in a different state. The merging of clients’ treatment records with criminal justice outcomes required matching based on various identifiers, and missing fields and errors in the data (e.g., misspelling) may also have compromised the accuracy of the data. Of particular concern was New York’s linkage algorithm, which had to rely on more limited data and probably had lower accuracy. This would lead to fewer matches between the two data sources and underestimation of arrest rates and any significant effects. We do not believe New York results derived from a lower overall postdischarge arrest rate among clients (i.e., 9% compared with 20% in other states) nor from a possibly greater likelihood of mismatching clients with criminal justice information, as these latter two factors would more likely bias results to the null rather than exaggerate them (King & Zeng, 2001).
Another limitation relates to the reliance on broad racial/ethnic categories when there could be a good deal of heterogeneity within such groups. Racial/ethnic subgroups (e.g., Mexicans, Puerto Ricans) can differ significantly in terms of drugs used, treatment utilization patterns, and treatment completion rates (Guerrero et al., 2012; Reynoso-Vallejo et al., 2008; SAMHSA, 2007). It would be beneficial for states to collect and analyze data at a granular level. Such a step would facilitate quality improvement efforts and is recommended by the IOM (2009).
Last, we did not have additional, detailed information on the facilities in which clients were being treated, such as measures on their staff members’ qualifications, their cultural competence, or provision of evidence-based practices, each of which may influence engagement rates. Thus, we could not know if better performing facilities had more qualified staff or tested interventions or had adopted specific culturally informed procedures to facilitate treatment engagement among their minority clients.
Implications
Process measures, including treatment initiation and engagement, have the potential to be valuable tools to monitor the quality of treatment services by the state agencies overseeing substance use treatment services (Garnick et al., 2011). Meeting these measures is generally associated with better criminal justice treatment outcomes, although our findings indicate that in some states, some racial/ethnic groups may need additional treatment support to reduce criminal justice involvement after beginning treatment.
As a routine part of using these performance measures, it is crucial that states examine whether disparities in these measures exist within their treatment systems and if so, explore what may be contributing to such disparities so that they can be addressed. In addition, quality improvement initiatives should make a simultaneous effort to reduce disparities. If the specific needs of minority groups are not addressed, an improvement initiative could well increase the racial/ethnic gap as quality improves for Whites but remains the same for other groups (Weissman et al., 2012).
Acknowledgments
The authors appreciate the contributions to developing analytic data sets from Deborah Henault, Patrick Hynes, and Mary Lansing (Connecticut Department of Correction); Lois Desmarais and Thomas Myers (Connecticut Department of Emergency Services and Public Protection); and David Van Alstyne (New York State Division of Criminal Justice Services). We would also like to acknowledge Alfred Bidorini (formerly at Connecticut Department of Mental Health and Addiction Services), Alice Huber (formerly at the Washington State Division of Behavioral Health and Recovery), Steve Davis (formerly at the Oklahoma Department of Mental Health and Substance Abuse Services), and Robert J. Gallati (formerly at the New York Office of Alcoholism and Substance Abuse Services).
Footnotes
This research was supported by National Institute on Alcohol Abuse and Alcoholism award numbers R01AA017177 and F31AA018246.The content is solely the responsibility of the authors and does not necessarily represent the official views of the National Institutes of Health or of the participating states.
References
- Acevedo A, Garnick DW, Lee MT, Horgan CM, Ritter G, Panas L, Reynolds M. Racial and ethnic differences in substance abuse treatment initiation and engagement. Journal of Ethnicity in Substance Abuse. 2012;11:1–21. doi: 10.1080/15332640.2012.652516. [DOI] [PMC free article] [PubMed] [Google Scholar]
- Agency for Healthcare Research and Quality. 2012 National Healthcare Disparities Report. 2013. Retrieved from http://www.ahrq.gov/research/findings/nhqrdr/nhdr12/index.html. [Google Scholar]
- Benson ML, Alarid LF, Burton VS, Cullen FT. Reintegration or stigmatization? Offenders’ expectations of community re-entry. Journal of Criminal Justice. 2011;39:385–393. [Google Scholar]
- Bureau of Justice Statistics. Contacts between police and the public, 2008. 2011. Retrieved from http://bjs.gov/content/pub/pdf/cpp08.pdf. [Google Scholar]
- Bureau of Justice Statistics. (n.d.) Drugs and crime facts. Retrieved from http://bjs.ojp.usdoj.gov/content/dcf/enforce.cfm. [Google Scholar]
- Campbell KM, Deck D, Krupski A. Record linkage software in the public domain: A comparison of Link Plus, The Link King, and a ‘basic’ deterministic algorithm. Health Informatics Journal. 2008;14:5–15. doi: 10.1177/1460458208088855. [DOI] [PubMed] [Google Scholar]
- Cook B, Alegría M. Racial-ethnic disparities in substance abuse treatment: The role of criminal history and socioeconomic status. Psychiatric Services. 2011;62:1273–1281. doi: 10.1176/appi.ps.62.11.1273. [DOI] [PMC free article] [PubMed] [Google Scholar]
- Cook B, McGuire TG, Zuvekas SH. Measuring trends in racial/ethnic health care disparities. Medical Care Research and Review. 2009;66:23–48. doi: 10.1177/1077558708323607. [DOI] [PMC free article] [PubMed] [Google Scholar]
- DeLisi M. Where is the evidence for racial profiling? Journal of Criminal Justice. 2011;39:461–462. [Google Scholar]
- Dunigan R, Acevedo A, Campbell K, Garnick DW, Horgan CM, Huber A, Ritter GA. Engagement in outpatient substance abuse treatment and employment outcomes. Journal of Behavioral Health Services & Research. 2014;41:20–36. doi: 10.1007/s11414-013-9334-2. [DOI] [PMC free article] [PubMed] [Google Scholar]
- Farrell A, McDevitt J. Rhode Island Traffic Stop Statistics Data Collection Study 2004–2005: Final Report. 2006. Retrieved from http://www.rijustice.ri.gov/documents/sac/Final%20Report%202004-2005.pdf. [Google Scholar]
- Finney JW, Humphreys K, Kivlahan DR, Harris AH. Why health care process performance measures can have different relationships to outcomes for patients and hospitals: Understanding the ecological fallacy. American Journal of Public Health. 2011;101:1635–1642. doi: 10.2105/AJPH.2011.300153. [DOI] [PMC free article] [PubMed] [Google Scholar]
- Garnick DW, Horgan CM, Acevedo A, Lee MT, Panas L, Ritter GA, Wright D. Criminal justice outcomes after engagement in outpatient substance abuse treatment. Journal of Substance Abuse Treatment. 2014;46:295–305. doi: 10.1016/j.jsat.2013.10.005. [DOI] [PMC free article] [PubMed] [Google Scholar]
- Garnick DW, Lee MT, Horgan C, Acevedo A, Botticelli M, Clark S, Tikoo M. Lessons from five states: Public sector use of the Washington Circle performance measures. Journal of Substance Abuse Treatment. 2011;40:241–254. doi: 10.1016/j.jsat.2010.11.008. [DOI] [PMC free article] [PubMed] [Google Scholar]
- Garnick DW, Lee MT, Horgan CM, Acevedo A, & the Washington Circle Public Sector Workgroup Adapting Washington Circle performance measures for public sector substance abuse treatment systems. Journal of Substance Abuse Treatment. 2009;36:265–277. doi: 10.1016/j.jsat.2008.06.008. [DOI] [PMC free article] [PubMed] [Google Scholar]
- Garnick DW, Lee MT, O’Brien PL, Panas L, Ritter GA, Acevedo A, Godley MD. The Washington circle engagement performance measures’ association with adolescent treatment outcomes. Drug and Alcohol Dependence. 2012;124:250–258. doi: 10.1016/j.drugalcdep.2012.01.011. [DOI] [PMC free article] [PubMed] [Google Scholar]
- Gaskin DJ, Spencer CS, Richard P, Anderson GF, Powe NR, LaVeist TA. Do hospitals provide lower-quality care to minorities than to whites? Health Affairs. 2008;27:518–527. doi: 10.1377/hlthaff.27.2.518. [DOI] [PubMed] [Google Scholar]
- Guerino P, Harrison PM, Sabol WJ. Prisoners in 2010. 2012. Retrieved from http://www.bjs.gov/content/pub/pdf/p10.pdf. [Google Scholar]
- Guerrero E, Andrews CM. Cultural competence in outpatient substance abuse treatment: Measurement and relationship to wait time and retention. Drug and Alcohol Dependence. 2011;119:e13–e22. doi: 10.1016/j.drugalcdep.2011.05.020. [DOI] [PMC free article] [PubMed] [Google Scholar]
- Guerrero EG, Cepeda A, Duan L, Kim T. Disparities in completion of substance abuse treatment among Latino subgroups in Los Angeles County, CA. Addictive Behaviors. 2012;37:1162–1166. doi: 10.1016/j.addbeh.2012.05.006. [DOI] [PubMed] [Google Scholar]
- Harris AH, Humphreys K, Bowe T, Tiet Q, Finney JW. Does meeting the HEDIS substance abuse treatment engagement criterion predict patient outcomes? Journal of Behavioral Health Services & Research. 2010;37:25–39. doi: 10.1007/s11414-008-9142-2. [DOI] [PubMed] [Google Scholar]
- Hasnain-Wynia R, Baker DW, Nerenz D, Feinglass J, Beal AC, Landrum MB, Weissman JS. Disparities in health care are driven by where minority patients seek care: Examination of the hospital quality alliance measures. Archives of Internal Medicine. 2007;167:1233–1239. doi: 10.1001/archinte.167.12.1233. [DOI] [PubMed] [Google Scholar]
- Horgan C, Garnick DW. The quality of care for adults with mental and addictive disorders: Issues in performance measurement. 2005. [Background paper for the Institute of Medicine]. Retrieved from http://sihp.brandeis.edu/ibh/pdfs/IOMJan05submitted.pdf. [Google Scholar]
- Hubbard RL, Craddock SG, Anderson J. Overview of 5-year followup outcomes in the drug abuse treatment outcome studies (DATOS) Journal of Substance Abuse Treatment. 2003;25:125–134. doi: 10.1016/s0740-5472(03)00130-2. [DOI] [PubMed] [Google Scholar]
- Humes KR, Jones NA, Ramirez RR. Overview of Race and Hispanic Origin: 2010. 2011. Retrieved from http://www.census.gov/prod/cen2010/briefs/c2010br-02.pdf. [Google Scholar]
- Institute of Medicine. Unequal treatment: Confronting racial and ethnic disparities in health care. Washington, DC: National Academies Press; 2002. [PubMed] [Google Scholar]
- Institute of Medicine. Race, ethnicity, and language data: Standardization for health care quality improvement. Washington, DC: National Academies Press; 2009. [PubMed] [Google Scholar]
- Jacobson JO, Robinson P, Bluthenthal RN. A multilevel decomposition approach to estimate the role of program location and neighborhood disadvantage in racial disparities in alcohol treatment completion. Social Science & Medicine. 2007a;64:462–476. doi: 10.1016/j.socscimed.2006.08.032. [DOI] [PubMed] [Google Scholar]
- Jacobson JO, Robinson PL, Bluthenthal RN. Racial disparities in completion rates from publicly funded alcohol treatment: Economic resources explain more than demographics and addiction severity. Health Services Research. 2007b;42:773–794. doi: 10.1111/j.1475-6773.2006.00612.x. [DOI] [PMC free article] [PubMed] [Google Scholar]
- Jha AK, Orav EJ, Zheng J, Epstein AM. The characteristics and performance of hospitals that care for elderly Hispanic Americans. Health Affairs. 2008;27:528–537. doi: 10.1377/hlthaff.27.2.528. [DOI] [PubMed] [Google Scholar]
- King G, Zeng L. Logistic regression in rare events data. Political Analysis. 2001;9:137–163. [Google Scholar]
- Lee MT, Garnick DW, O’Brien PL, Panas L, Ritter GA, Acevedo A, Godley MD. Adolescent treatment initiation and engagement in an evidence-based practice initiative. Journal of Substance Abuse Treatment. 2012;42:346–355. doi: 10.1016/j.jsat.2011.09.005. [DOI] [PMC free article] [PubMed] [Google Scholar]
- MITRE Corporation. ONC-SAMHSA Behavioral health clinical quality measure initiative: Technical expert panel results for behavioral health domain—Drug use. 2012. Retrieved from http://www.healthit.gov/sites/default/files/drug_use_-_bh_ecqm_tep_white_paper.pdf. [Google Scholar]
- Mumola CJ, Karberg JC. Drug use and dependence, state and federal prisons, 2004. 2007. Retrieved from http://bjs.ojp.usdoj.gov/content/pub/pdf/dudsfp04.pdf. [Google Scholar]
- National Committee for Quality Assurance. HEDIS 2012. 2012. Retrieved from http://www.ncqa.org/tabid/1415/Default.aspx. [Google Scholar]
- National Quality Forum. NQF Endorsed Standards. 2009. Retrieved from http://www.qualityforum.org/MeasureDetails.aspx?SubmissionID=1245. [Google Scholar]
- Prendergast ML, Podus D, Chang E, Urada D. The effectiveness of drug abuse treatment: A meta-analysis of comparison group studies. Drug and Alcohol Dependence. 2002;67:53–72. doi: 10.1016/s0376-8716(02)00014-5. [DOI] [PubMed] [Google Scholar]
- Reynoso-Vallejo H, Chassler D, Witas J, Lundgren LM. Patterns of drug treatment entry by Latino male injection drug users from different national/geographical backgrounds. Evaluation and Program Planning. 2008;31:92–101. doi: 10.1016/j.evalprogplan.2007.05.011. [DOI] [PubMed] [Google Scholar]
- Roh S, Robinson M. A geographic approach to racial profiling: The microanalysis and macroanalysis of racial disparity in traffic stops. Police Quarterly. 2009;12:137–169. [Google Scholar]
- Saloner B, Cook B. Blacks and Hispanics are less likely than whites to complete addiction treatment, largely due to socioeconomic factors. Health Affairs. 2013;32:135–145. doi: 10.1377/hlthaff.2011.0983. [DOI] [PMC free article] [PubMed] [Google Scholar]
- Snyder HN. Arrest in the United States, 1980-2009. 2011. Retrieved from http://www.bjs.gov/content/pub/pdf/aus8009.pdf. [Google Scholar]
- StataCorp. Heckman two-stage procedure. Stata Statistical Software: Release 11. College Station, TX: Author; 2009. [Google Scholar]
- Substance Abuse and Mental Health Services Administration. The DASIS Report: Hispanic Female Admissions in Substance Abuse Treatment: 2005. 2007. Retrieved from http://www.samhsa.gov/data/2k7/LatinaTX/Latinas.pdf. [Google Scholar]
- Substance Abuse and Mental Health Services Administration. Results from the 2012 National Survey on Drug Use and Health: Summary of National Findings [NSDUH Series H-44, HHS Publication No. (SMA) 13–4795] Rockville, MD: Author; 2013a. [Google Scholar]
- Substance Abuse and Mental Health Services Administration. Treatment Episode Data Set (TEDS): 2001-2011. National Admissions to Substance Abuse Treatment Services [BHSIS Series S-65, HHS Publication No. (SMA) 13-4772] 2013b. Retrieved from http://www.samhsa.gov/data/2k13/TEDS2011/TEDS2011N.pdf.
- Suissa S. Immortal time bias in pharmaco-epidemiology. American Journal of Epidemiology. 2008;167:492–499. doi: 10.1093/aje/kwm324. [DOI] [PubMed] [Google Scholar]
- Therneau TM, Grambsch PM. Modeling survival data: Extending the Cox Model. New York, NY: Springer-Verlag; 2000. [Google Scholar]
- Tonigan JS. Project Match treatment participation and outcome by self-reported ethnicity. Alcoholism: Clinical and Experimental Research. 2003;27:1340–1344. doi: 10.1097/01.ALC.0000080673.83739.F3. [DOI] [PubMed] [Google Scholar]
- Uggen C. Work as a turning point in the life course of criminals: A duration model of age, employment, and recidivism. American Sociological Review. 2000;65:529–546. [Google Scholar]
- Weissman JS, Betancourt JR, Green AR, Meyer GS, Tan-McGrory A, Nudel JD, Carrillo JE. Commissioned Paper: Healthcare Disparities Measurement. 2012. Retrieved from http://www.qualityforum.org/Publications/2012/02/Commissioned_Paper—Healthcare_Disparities_Measurement.aspx. [Google Scholar]
- Wells K, Klap R, Koike A, Sherbourne C. Ethnic disparities in unmet need for alcoholism, drug abuse, and mental health care. American Journal of Psychiatry. 2001;158:2027–2032. doi: 10.1176/appi.ajp.158.12.2027. [DOI] [PubMed] [Google Scholar]
- WWAMI Rural Health Research Center. RUCA data. 2007. Retrieved from http://depts.washington.edu/uwruca/ruca-download.php. [Google Scholar]