

Background: The regulatory mechanisms and potential redundancy of the structurally related actin nucleation promoting factors, WAVE2 and WASp, are poorly understood.
Results: Following T cell activation, WAVE2 and WASp are recruited to the TCR site and then dissociate.
Conclusion: WAVE2 and WASp share similar recruitment mechanisms but differ in their subsequent molecular interactions and dynamics.
Significance: These differences may explain their distinct functions in regulating actin-dependent processes.
Keywords: Actin, Adaptor Protein, Cytoskeleton, Lymphocyte, Molecular Dynamics, T Cell Receptor (TCR), T Cell Signaling, WASp, WAVE2
Abstract
T cell antigen receptor (TCR) engagement has been shown to activate pathways leading to actin cytoskeletal polymerization and reorganization, which are essential for lymphocyte activation and function. Several actin regulatory proteins were implicated in regulating the actin machinery, such as members of the Wiskott-Aldrich syndrome protein (WASp) family. These include WASp and the WASp family verprolin-homologous protein-2 (WAVE2). Although WASp and WAVE2 share several structural features, the precise regulatory mechanisms and potential redundancy between them have not been fully characterized. Specifically, unlike WASp, the dynamic molecular interactions that regulate WAVE2 recruitment to the cell membrane and specifically to the TCR signaling complex are largely unknown. Here, we identify the molecular mechanism that controls the recruitment of WAVE2 in comparison with WASp. Using fluorescence resonance energy transfer (FRET) and novel triple-color FRET (3FRET) technology, we demonstrate how WAVE2 signaling complexes are dynamically regulated during lymphocyte activation in vivo. We show that, similar to WASp, WAVE2 recruitment to the TCR site depends on protein-tyrosine kinase, ZAP-70, and the adaptors LAT, SLP-76, and Nck. However, in contrast to WASp, WAVE2 leaves this signaling complex and migrates peripherally together with vinculin to the membrane leading edge. Our experiments demonstrate that WASp and WAVE2 differ in their dynamics and their associated proteins. Thus, this study reveals the differential mechanisms regulating the function of these cytoskeletal proteins.
Introduction
The actin cytoskeleton is involved in every significant stage of T cell activity, including migration, proliferation, and cytotoxicity (1–3). The mutual recognition of the T cell and antigen-presenting cell results in the engagement and clustering of the T cell antigen receptor (TCR)3 and the formation of the T cell/antigen-presenting cell interface, known as the immunological synapse (IS). Signaling molecules reach this site and activate calcium flux, gene transcription, actin polymerization, and affinity maturation of integrins. Actin polymerization is mediated by the actin-related protein 2/3 (Arp2/3) complex of proteins, which bind to the side of existing actin filaments, enabling the nucleation and elongation of a new filament and resulting in a branched actin network (4).
The Wiskott-Aldrich syndrome family of proteins (WASp) regulates the activation of the Arp2/3 complex through the verprolin-homology (V), cofilin-like (C), and acidic (A) (VCA) regions at their C terminus (5–7). This family consists of eight members: WASp, N-WASp, WAVE1–3, WASH, WHAMM, and JMY (6). The WASp family members that are expressed in T cells can be divided into at least three main groups according to their structural homology. The first includes hematopoietic WASp and ubiquitous N-WASp. The second includes the WAVE proteins, whereas WASH forms the third group. The WAVE proteins share a WAVE homology domain (WHD) at their N terminus, followed by a basic domain, a proline-rich domain (PRD), and a C-terminal VCA domain (2).
Several studies have shown that WAVE2 plays a major role in the regulation of actin polymerization of T cells (8–10). The WAVE2 protein, along with PIR121, Hem1/2, Abi1/2, and HSPC300, forms a pentameric complex (11–14), which is highly conserved throughout evolution and is expressed in multicellular organisms, in which cells must migrate as part of morphogenesis and alter their shapes to adapt to changing environments (15–17). Although much remains unknown regarding the interactions of WAVE2 within the complex, it was shown that the stability of WAVE2 is regulated by its associated proteins (8). RNAi inhibition of either WAVE2, Abi, or Hem1 results in a decrease of F-actin polymerization at the IS and impaired TCR-mediated cell spreading (8, 10).
Unlike WASp, which exists in an autoinhibited conformation that is relieved by the binding of GTP-Cdc42 to the GTPase-binding domain, WAVE2 exists in a basal inactive state and is activated by multiple factors. It was shown that there are three requirements for its activation: its interactions with prenylated Rac-GTP and acidic phospholipid and a specific phosphorylation state (11, 12).
Although some aspects of the function of WAVE2 in T cells are known (9, 18), unlike WASp, the proximal molecular cascade that regulates its recruitment to the IS and links its association to the TCR signaling complex remains largely unknown. Although WASp and WAVE2 share several structural features and are recruited to the IS, the precise regulatory mechanisms, localization, and redundancy between them have not been fully characterized. Although both were shown to be involved in the formation of actin-rich lamellipodia-like (sheet-like) structures, they might differ in other functions, such as vesicular trafficking (19–21) and integrin activation (22). This raises the question of how WASp and WAVE2 control both similar and diverse actin-dependent cellular functions. Do they share regulatory molecular mechanisms for some functions (i.e. membrane protrusion), with distinct pathways in others (i.e. integrin activation)? In this study, we identified the molecular mechanism that regulates the recruitment of WAVE2 to the IS and compared it with the mechanisms governing WASp (20).
EXPERIMENTAL PROCEDURES
Reagents
Mouse anti-CD3ϵ (UCHT or HIT3a) and anti-CD28 were purchased from BD Pharmingen. The expression vectors pEYFP-N1, pEYFP-C1, and pECFP-C1 were obtained from Clontech, and pcDNA3.1+/Hygro was obtained from Invitrogen. Antibodies and reagents were obtained from the following suppliers: anti-WASp from Santa Cruz Biotechnology, Inc.; anti-Nck and anti-phospho-WAVE2 (Ser-351) from Millipore; anti-SLP-76 from Antibody Solutions; anti-GFP from Roche Applied Science; and phalloidin and calcein AM from Molecular Probes. Anti-WAVE2 antibody was purchased from Santa Cruz Biotechnology and was kindly provided by D. D. Billadeau (College of Medicine, Mayo Clinic, Rochester, MN). The KIM127 hybridoma was kindly provided by F. Kiefer (Max Planck Institute, Münster, Germany). Alexa-conjugated, isotype-specific secondary antibodies were purchased from Molecular Probes. Pools of the following independent specific RNA duplexes were purchased from Dharmacon: human WASp small interfering RNA (siRNA) oligonucleotides: GCCGAGACCUCUAAACUUA, UGACUGAGUGGCUGAGUUA, GAAUGGAUUUGACGUGAAC, and GACCUAGCCCAGCUGAUAA; human Nck1 siRNA oligonucleotides: ACUAAAAGCACAAGGGAAA, GAAAUGGCAUUAAAUGAA, and GAUAGUGAAUCUUCGCCAA; human Nck2 siRNA oligonucleotide, CUUAAAGCGUCAGGGAAGA; human WAVE2 siRNA oligonucleotides, CACCAGCAGAAUUCAGUUATT, GGAUCCCUUUGGUGAGUAUTT, and CAGGUGCUAUUAUUCAGAATT. Pools of non-targeting (nonspecific) siRNA duplexes were purchased from Dharmacon: UAGCGACUAAACACAUCAAUA, AGGCUAUGAAGAGAUAC, AUGUAUUGGCCUGUAUUAG, AUGAACGUGAAUUGCUCAA, and UGGUUUACAUGUCGACUAA.
Plasmid Construction and GFP Mutations
Human WAVE2 cDNA was kindly provided by D. D. Billadeau (College of Medicine, Mayo Clinic). Human Nckα cDNA and human WASp cDNA were kindly provided by B. Mayer (Connecticut University Health Center, Farmington, CT) and by D. Nelson (NCI, National Institutes of Health, Bethesda, MD), respectively. The cDNAs were cloned into the expression vectors pECFP-C/N or pEYFP-C/N to obtain CFP or YFP-tagged proteins. Aequorea GFP derivatives were rendered monomeric by the A206K substitution described by Zacharias et al. (23).
Primary Cell Culture, Cell Transfection, and Generation of Stable Cells
Human T lymphocytes were prepared from the peripheral blood of healthy donors, as described previously (24). When indicated, primary T cells were activated with anti-CD3ϵ (OKT3; 10 μg/ml) and anti-CD28 (10 μg/ml) for 30 min on ice. The cells were then warmed to 37 °C for 10 min and stimulated with anti-mouse IgG (50 μg/ml) for 2 min. Cells were transfected with an Amaxa electroporator using Amaxa solution. Transiently transfected T cell cultures and stable clones were used in this study. Stable clones were derived from transiently transfected cells using a combination of drug selection and cell sorting (20). Cell fluorescence analysis and cell sorting were performed on a FACSVantage (BD Biosciences).
Confocal Microscopy; Cellular Imaging, Spreading Assay, and Double Color FRET Analysis
Spreading assays were performed as described previously (20). Dynamic fluorescent and interference reflection microscopy images were collected on a Zeiss LSM510 Meta confocal microscope. All images were collected with a ×63 plan-apochromat objective (Carl Zeiss). For live cell imaging, a hot air blower (Nevetec) was used to maintain the sample at 37 °C. Fine adjustments were made with a digital temperature probe to monitor and maintain the buffer temperature in the chamber. Double color FRET was measured by the donor-sensitized acceptor fluorescence technique, as described previously (20).
Triple Color FRET Analysis
Triple color FRET analysis was performed as described recently (25). Three sets of filters were used to gather images for each FRET pair: one optimized for donor fluorescence (donor excitation, donor emission image); a second for acceptor fluorescence (acceptor excitation, acceptor emission image); and a third for FRET (donor excitation, acceptor emission image). This last filter pair provides a raw, uncorrected FRET image that includes two non-FRET components: the “bleed-through” of the donor emission into the acceptor detection channel and the cross-excitation of acceptor by the donor excitation laser.
The energy transfer in the 3FRET system occurs due to overlapping spectral areas and consists of three FRET pairs, CFP-YFP (excitation at 458 nm, detection at 530–600 nm), CFP-mCherry (excitation at 458 nm, detection at 615 nm long pass), and YFP-mCherry (excitation at 514 nm, detection at 615 nm long pass), with the first serving as the donor and the latter as the acceptor, respectively. In order to eliminate the non-FRET components and to exclude the possibility of false-positive FRET, we prepared cells expressing free CFP, free YFP, and free mCherry as negative controls (data not shown). The FRET efficiency in the negative control system was measured and calculated in the same way as in the main experiment. FRET efficiency values obtained from the negative control samples were subtracted from the values obtained in the main experiments.
FRET Correction
FRET was corrected as described previously (25).
FRET Efficiency Calculation
All images were taken using the LSM510 Meta confocal microscope (Zeiss). The FRET efficiency (FRETeff) was calculated on a pixel-by-pixel basis using the equation, FRETeff = FRETcorr/(FRETcorr + Donor) × 100%, where FRETcorr is the pixel intensity in the corrected FRET image, and Donor is the intensity of the corresponding pixel in the donor channel image.
To increase the reliability of the calculations and to prevent low level noise from distorting the calculated ratio, pixels below 50 intensity units and saturated pixels from the calculations were excluded, and their intensities were set to zero. These pixels are shown in black in the “pseudocolored” FRET efficiency images.
Colocalization Analysis
Colocalization was detected by determining the Pearson's colocalization correlation coefficient, as described previously (24, 26). Raw two-channel images were loaded into Imaris 7.0.0 software (Bitplane AG, Zurich, Switzerland). Thresholds used for calculating colocalization were determined using the objective and automated integrated algorithm developed by Costes et al. (27). For each cell, at each time point (if applicable) Pearson's colocalization coefficient was determined. Pearson's colocalization coefficient varies from −1 to 1, where a score of 1 means perfect colocalization, and −1 means anti-correlation. Line profiles of fluorescence intensities of signaling clusters were determined using the ImageJ software. All imaging analyses were performed using unprocessed 8-bit grayscale images with no saturated pixels.
Image Processing and Quantitation
The acquired images were extracted with the LSM Image Browser (Carl Zeiss). Figures were composed from these images using Adobe Photoshop. Movies were made using z-stacks by preparing a maximum intensity projection of a given time point and then arranging a sequence of all of the projections. To quantify cluster movement data in the obtained images and to generate averaged traces, we used algorithms based on previously published methods (28, 29) specifically adapted for our system. Kymographs were made by drawing regions of interest around moving clusters, and cluster traces were extracted from the kymographs and analyzed with IP Lab software, version 3.9.
Immunoprecipitation and Immunoblotting
Proteins of interest were immunoprecipitated and immunoblotted, as described previously (30).
Shape Index
A quantitative estimate of WAVE2 distribution changes was obtained as described previously (24), using the equation, cell shape index = P2/4πS, where P and S are the perimeter and the surface of the cell, respectively. These values were obtained by thresholding images of cells tagged with fluorescence proteins. A perfectly circular shape of WAVE2 distribution yields a shape index of 1, and departure from a circle yields a shape index larger than 1.
Adhesion Assays
For fibronectin binding, 96-well plates were coated with 3 μg/ml fibronectin, as described previously (9). Cells were stained with 5 μm calcein AM (Invitrogen) for 30 min in serum-free medium and washed twice with PBS; then 105 cells/well were seeded over pretreated flat-bottom 96-well plates. Cells were added to wells containing medium alone (unstimulated) or 5 μg/ml anti-CD3 and goat anti-mouse IgG (stimulated). Cells were placed on ice for 30 min and then incubated at 37 °C for 15 min. After incubation, the cellular input was measured using a fluorescent plate reader (Synergy4) using an excitation of 495 nm and emission of 520 nm. Plates were then subsequently washed six times with PBS, and adhesion was continually monitored at the same wavelengths. All adhesion experiments were performed in triplicate, and the S.E. value is shown.
LFA-1 Activation Assay
The activation of LFA-1 integrins was determined by flow cytometry, as described previously (31). Briefly, 3 × 10⁵ cells were stimulated with 5 μg/ml anti-CD3 at 37 °C for 15 min. After stimulation, cells were washed and incubated with the conformation-sensitive anti-LFA-1 KIM127 mAb at 37 °C for 30 min. Cells were then washed and incubated with Alexa 488-conjugated goat anti-mouse IgG on ice for 30 min. After washing, cells were analyzed with a Gallios Flow Cytometer (Beckman Coulter).
Statistical Analyses
The S.E. values were calculated with the use of Microsoft Excel. Statistical significance was determined by Student's t test, calculated with Microsoft Excel. In all cases, the threshold p value required for significance was 0.05.
RESULTS
Characterization of the Proteins That Form a Complex with WAVE2 upon TCR Ligation
Several studies defined the molecular mechanism controlling the recruitment of WASp to the IS (20, 21, 32, 33), whereas others demonstrated the importance of WASp and WAVE2 in the regulation of actin polymerization in T cells (8, 10, 20). However, the molecular mechanism regulating the recruitment of WAVE2 to the T cell membrane remains poorly understood. In order to study this mechanism, we first identified WAVE2-associated proteins during the activation of peripheral blood lymphocytes (PBLs). WAVE2 was immunoprecipitated from resting or stimulated PBLs and examined for phosphotyrosine associated proteins (Fig. 1A). We found that WAVE2 co-immunoprecipitated with phosphoproteins with molecular weights of ∼36, 70, 76, 100, and 120 kDa; these sizes correspond to LAT (linker for activation of T cells), ZAP-70, SLP-76 (SH2 domain-containing leukocyte protein of 76 kDa), Vav1, and c-Cbl, respectively.
FIGURE 1.

WAVE2 protein interactions and the distribution of its signaling clusters. A, immunoprecipitation (IP) experiments were performed to detect the interaction between WAVE2 and phosphotyrosine proteins in human PBLs stimulated with anti-CD3 and -CD28 antibodies. Cell lysates were prepared and immunoprecipitated with anti-WAVE2. Immunoprecipitates were separated by SDS-PAGE, transferred, and subsequently blotted (IB) for Tyr(P) (pTy), c-Cbl, Vav1, and WAVE2. The identity of SLP-76, ZAP-70, and LAT was further confirmed in the subsequent immunoprecipitations presented in the subsequent figures. Data shown are representative of five independent experiments. B, Jurkat E6.1 T cells expressing YFP-WAVE2 (green) were plated on stimulatory coverslips, fixed, and stained for pZAP-70 (blue) and with phalloidin for F-actin (red). Confocal images were obtained at the coverslip. Images were collected 1, 3, and 5 min into the spreading process. Overlays (insets, marked with arrowheads) of the fluorescence peaks of the punctae are shown. Image analysis was performed on >25 cells for each experimental group. Data shown are representative of at least three independent experiments. A representative analysis of a single cell is shown.
In order to determine whether WAVE2 forms signaling clusters in response to TCR engagement and whether it colocalizes with TCR-proximal signaling molecules, including ZAP-70, Jurkat T cells expressing YFP-WAVE2 (green) were seeded over a stimulating coverslip for 1, 3, and 5 min as described previously (20), fixed, and stained for pZAP-70 (blue) and phalloidin (red). After 1 min of activation, signaling clusters of WAVE2 and pZAP-70 appeared at the contact sites (Fig. 1B, top). After 3 min of activation, the cell began to spread, and the signaling clusters moved together to the cell's perimeter, as detected by the fluorescence colocalization (Fig. 1B, middle). After 5 min, the cells were completely spread, and actin-rich ring structures formed (Fig. 1B, bottom). At this time point, both WAVE2 and actin were localized to the leading edge of the cell membrane, whereas the signaling clusters of pZAP-70 were separated from the WAVE2·actin complex and showed a scattered distribution. These results strengthen the previous observation that WAVE2 is recruited to the TCR site upon TCR engagement (8, 10) and demonstrate its initial colocalization with pZAP-70.
In order to better determine WAVE2 dynamics, we monitored the movement of WAVE2 clusters in live activated Jurkat T cells stably expressing YFP-WAVE2. As seen in supplemental Movies S1 and S2, clusters of YFP-WAVE2 were formed at the contact sites and rapidly moved toward the periphery of the cell to the leading edge, where they quickly disappeared.
ZAP-70 Is Required for the Recruitment of WAVE2 to the TCR Site
Because WAVE2 colocalized with pZAP-70 following TCR engagement, we next examined whether ZAP-70 is required for WAVE2 distribution and whether the absence of ZAP-70 would alter WAVE2 recruitment to the TCR site.
YFP-WAVE2 (green in Fig. 2) was introduced into ZAP-70-deficient Jurkat cells (P116 cells). Cells were stimulated and stained for phosphotyrosine (pTy-Red). As described previously (34), protein tyrosine kinase-dependent signals are initiated in newly formed TCR clusters; therefore, phosphotyrosine staining indicates cell viability and activity. To assess the role of ZAP-70 in the recruitment of WAVE2 to the TCR site, we compared WAVE2 colocalization with phosphotyrosine-containing proteins in the ZAP-70-deficient P116 cells in comparison with P116 reconstituted with ZAP-70 WT (Fig. 2A).
FIGURE 2.

ZAP-70 is essential for the recruitment of WAVE2 to the TCR site. A, ZAP-70-deficient Jurkat cells (P116) expressing YFP-WAVE2 (green), were plated onto stimulatory antibody-coated coverslips and then fixed and stained for phosphotyrosine (pTy-Red). Far left, differential interference contrast (DIC); far right, fluorescence intensity scatter plots. B, P116 cells reconstituted with wild-type ZAP-70 expressing YFP-WAVE2 were treated as described above. C, colocalization analysis between WAVE2 and Tyr(P) was performed in P116 cells in comparison with P116 reconstituted with ZAP-70 WT by calculating Pearson's colocalization coefficients. Imaging analysis was performed on 25 cells for each experimental group. D, Jurkat E6.1 T cells expressing YFP-WAVE2 were stimulated for 2 min (+) or left unstimulated (−). After stimulation, cells were lysed and immunoprecipitated (IP) with anti-GFP. Immunoprecipitates were separated by SDS-PAGE, transferred, and blotted (IB) with anti-pZAP-70 and GFP antibodies. E, lysates of unstimulated (−) and stimulated (+) PBLs were immunoprecipitated with anti-WAVE2 and blotted for pZAP-70 and WAVE2. F, LAT-deficient T cells (J.CaM2.5) and J.CaM2.5 cells reconstituted with LAT WT, SLP-76-deficient T cells (J14), and J14 cells reconstituted with SLP-76 WT were stimulated, lysed, and immunoprecipitated with anti-WAVE2 and blotted for pZAP-70 and WAVE2. Data shown are representative of at least three independent experiments. Error bars, S.E.
In the absence of ZAP-70, WAVE2 was unable to colocalize with phosphotyrosine-containing proteins, and its distribution remained diffuse throughout the activation process (Fig. 2, A and C, 1 and 3 min). WAVE2 was not recruited to the cell membrane (Fig. 2A, 1 and 3 min) in comparison with P116 cells reconstituted with ZAP-70 (P116 ZAP-70 WT) (Fig. 2B, 1 and 3 min) in which WAVE2 was correctly recruited to the membrane.
We found a significant difference in Pearson's colocalization coefficient between WAVE2 and TCR sites in P116 cells versus P116 ZAP-70 WT (Fig. 2C, 1 and 3 min; p ≤ 0.00008 and p ≤ 0.03, respectively). Nevertheless, after 5 min of activation, almost none of the cells in either experimental group contained WAVE2 clusters (p > 0.7). However, whereas WAVE2 was expressed in a diffuse manner in the ZAP-70-deficient T cells (Fig. 2A), it was translocated to the perimeter of the reconstituted cells (Fig. 2B).
To confirm the imaging data and specifically the presence of WAVE2 in ZAP-70-signaling complexes, we co-precipitated WAVE2 conjugates and then immunoblotted with an antibody specific for the activated form of ZAP-70 (Tyr(P)-319). Because maximal ZAP-70 phosphorylation is observed after 2 min of activation (35), we used a similar activation procedure for the biochemical experiments. In agreement with the results described above, we found that pZAP-70 co-precipitated with WAVE2 (Fig. 2D). This interaction was also detected in PBLs co-stimulated with anti-CD3/CD28 (Fig. 2E).
In order to define the molecular cascade that recruits WAVE2 to the pZAP-70 site, we used LAT- and SLP-76-deficient Jurkat T cells (J.CaM2.5 and J14 cells, respectively) to investigate the role of these factors in the interaction between WAVE2 and pZAP-70. In the absence of LAT, a dramatic reduction was observed in WAVE2·pZAP-70 precipitates, which were restored in J.CaM2.5 LAT-reconstituted cells. A similar although weaker trend was observed in SLP-76-deficient versus reconstituted cells (Fig. 2F). These results indicate that both LAT and, to a lesser degree, SLP-76 are required for promoting the interaction of WAVE2 with pZAP-70.
Recruitment of WAVE2 to the TCR Site Is Dependent on LAT
Following TCR engagement, ZAP-70 is recruited to the TCR site and activates LAT in addition to other signaling proteins (36). Our findings of a WAVE2-ZAP-70 interaction prompted us to investigate the requirement for LAT in the recruitment of WAVE2 to the TCR site (Fig. 3). Indeed, no signaling clusters of YFP-WAVE2 (green) were detected in J.CaM2.5 during the first 3 min of activation. After 5 min of stimulation, no lamellipodial structures were observed, and WAVE2 remained in a diffuse pattern across the cell (Fig. 3A). In contrast, when YFP-WAVE2 was transfected into LAT-reconstituted J.CaM2.5 cells (J.CaM2.5 LAT WT), WAVE2 signaling clusters were observed and colocalized with Tyr(P) (Fig. 3, B and C, 1 and 3 min). By 5 min into the spreading assay, a lamellipodial structure formed at the front of the cells, and WAVE2 formed a peripheral ring (Fig. 3B). Pearson's colocalization coefficient between WAVE2 and phosphorylated proteins was significantly different between J.CaM2.5 cells and J.CaM2.5 LAT WT at 1 and 3 min of activation but not at 5 min (Fig. 3C).
FIGURE 3.

LAT is required for the recruitment of WAVE2 to the TCR site. A, LAT-deficient T cells (J.CaM2.5) expressing YFP-WAVE2 (green) were plated onto stimulatory antibody-coated coverslips and then fixed and stained for phosphotyrosine (pTy-Red). Far left, differential interference contrast (DIC); far right, fluorescence intensity scatter plots. B, J.CaM2.5 cells reconstituted with LAT WT and expressing YFP-WAVE2 were treated as described above. C, colocalization analysis between WAVE2 and Tyr(P) performed in J.CaM2.5 cells in comparison with J.CaM2.5 reconstituted with LAT WT by calculating Pearson's colocalization coefficients (scatter diagrams). D, FRET efficiency between LAT and WAVE2 was determined in J.CaM2.5 cells expressing LAT-CFP and YFP-WAVE2 throughout TCR activation. Imaging analysis was performed on 30 cells for each experimental group. E, PBLs were co-stimulated for 2 min with anti-CD3 and -CD28 antibodies, lysed, and immunoprecipitated (IP) with anti-WAVE2 and blotted (IB) for pLAT and WAVE2. Data shown are representative of at least four independent experiments. Error bars, S.E.
To determine whether WAVE2 and LAT associate during T cell activation, we performed FRET analysis (Fig. 3D). We transfected J.CaM2.5 cells with LAT-CFP (red) and YFP-WAVE2 (green). After 1 min, signaling clusters of both LAT and WAVE2 were colocalized (Fig. 3D, top). Colocalization was observed during the first 3 min of activation, and a FRET efficiency of 32.6 ± 2.4 and 51.1 ± 4.6% was measured after 1 and 3 min of activation, respectively (Fig. 3D, middle). After 5 min of activation, WAVE2 translocated to the periphery, whereas LAT was observed in two pools, at the outmost periphery and at the center of the cell, which was previously reported to contain the pool of LAT molecules recycling to the Golgi system (37). Surprisingly, at this time point, no FRET was detected between LAT and WAVE2 molecules (Fig. 3D, bottom). The LAT-WAVE2 interaction was also verified in stimulated PBLs by co-immunoprecipitation (Fig. 3E). Thus, our data indicate that LAT is required for the recruitment of WAVE2 to the TCR site and that these proteins are in the same molecular complex during the first minutes of activation.
SLP-76 Mediates the Recruitment of WAVE2 to the TCR Site
During TCR engagement, the phosphotyrosine motifs of SLP-76 are phosphorylated by ZAP-70 (36, 38). Together, these molecules couple the TCR to downstream signals (34). We examined whether recruitment of WAVE2 to the membrane depends on SLP-76. To this end, we transfected Jurkat J14 cells and J14 reconstituted with SLP-76 WT with YFP-WAVE2. As described above, cells were activated, fixed, and stained for Tyr(P). In the absence of SLP-76, the distribution of WAVE2 became diffuse during the activation process (Fig. 4A). However, J14 cells reconstituted with SLP-76 demonstrated WAVE2 clusters; these clusters were observed during the first 3 min of activation (Fig. 4B) and colocalized with Tyr(P) molecules as detected by Pearson colocalization coefficient analysis (p ≤ 0.01 and p ≤ 0.001 for 1 and 3 min of activation, respectively; Fig. 4C). After 5 min of activation, WAVE2 migrated toward the periphery, and no significant difference was observed in its colocalization with TCR clusters in J14 cells versus J14 reconstituted with SLP-76 WT (p > 0.8).
FIGURE 4.

WAVE2 recruitment to the TCR site is dependent on SLP-76. A, SLP-76-deficient Jurkat cells (J14) expressing YFP-WAVE2 were plated onto stimulatory antibody-coated coverslips and then fixed and stained for Tyr(P). B, J14 cells reconstituted with SLP-76 WT and expressing YFP-WAVE2 were treated as described above. C, colocalization analysis between WAVE2 and Tyr(P) was performed in J14 cells in comparison with J14 reconstituted with SLP-76 WT by calculating Pearson's colocalization coefficients. Imaging analysis was performed on 30 cells for each experimental group. D, FRET efficiency between SLP-76 and WAVE2 was determined in J14 cells expressing WAVE2-CFP and SLP-76-YFP. Imaging analysis was performed on 40 cells for each experimental group. E, PBLs were stimulated for 2, 15, 30, and 60 min with anti-CD3 and -CD28 antibodies, lysed and immunoprecipitated with anti-WAVE2, and then blotted for SLP-76, vinculin, and WAVE2. F, Jurkat E6.1 T cells were stimulated for the times indicated, lysed and immunoprecipitated (IP) with anti-WAVE2, and blotted (IB) for SLP-76 and WAVE2. G, cell lysates were immunoprecipitated with anti-WAVE2 and blotted for vinculin and WAVE2. H, cell lysates were immunoprecipitated with anti-vinculin and blotted for WASp and vinculin. Error bars, S.E.
Because we found that WAVE2 recruitment to the TCR site is dependent on SLP-76, we further examined the relative distribution of these two molecules during T cell activation. We created a stable J14 transfectant expressing WAVE2-CFP and SLP-76-YFP. FRET analysis was performed to determine the distribution of WAVE2 relative to SLP-76 following TCR activation. WAVE2 colocalized with SLP-76, as measured by a stable FRET efficiency of 48.6 ± 0.7 and 49.9 ± 0.4% after 1 and 3 min of activation, respectively (Fig. 4D, top and middle). After 5 min of activation, WAVE2 migrated toward the leading edge of the cell, whereas SLP-76 was found in a ring internal to that of WAVE2. At this time point, the FRET efficiency between these molecules was dramatically reduced to 1.2 ± 7.6% (Fig. 4D, bottom). The dynamics of WAVE2 and SLP-76 in live activated T cells demonstrated that whereas SLP-76 remained in clusters throughout T cell spreading, WAVE2 was rapidly translocated to the leading edge of the T cell membrane. As a consequence, WAVE2·SLP-76 FRET efficiency was decreased after 3 min of activation (supplemental Movie S3) as opposed to the stable FRET efficiency detected between SLP-76 and WASp throughout the T cell activation process (10 min) (20). These data indicate that while SLP-76 is required for the recruitment of both WASp and WAVE2 to the TCR site, its interaction with WAVE2, in contrast to its association with WASp, is transient.
In order to confirm this result using a biochemical approach and in primary, non-transformed T cells, we performed co-immunoprecipitation assays in PBLs (Fig. 4E) as well as in Jurkat E6.1 cells (Fig. 4F). Jurkat E6.1 cells were stimulated for 1, 3, and 5 min, whereas PBLs were stimulated for 2, 15, 30, and 60 min. Our previous data clearly indicated that although the TCR signaling complex formation in PBLs is slower than in Jurkat cells, the pattern of protein localization in the primary cells is similar to that observed in Jurkat cells (20). WAVE2 was immunoprecipitated from cells, and the lysates were analyzed for the presence of SLP-76. Our biochemical data confirmed the imaging data described above, indicating an interaction between SLP-76 and WAVE2 in Jurkat cells within the first 3 min of activation, followed by a dramatic reduction after 5 min (Fig. 4F).
These data were further confirmed in PBLs; the WAVE2·SLP-76 molecular complex was more dominant within the first 15 min of activation and dramatically reduced later in the activation process (Fig. 4E). As was shown previously, although the activation kinetics of PBLs are slower than Jurkat, the pattern of protein localization in these cells was similar to that noted with Jurkat (20). Interestingly, after 5 min (Jurkat; Fig. 4G), or 60 min of activation (PBLs; Fig. 4E), most of the WAVE2 signal was found in a complex with vinculin, whereas no WASp was found in the vinculin complex (Jurkat; Fig. 4H).
We next measured the dynamics and stability of WAVE2 relative to WASp and SLP-76 clusters during T cell activation. Cells expressing fluorescently tagged WAVE2, WASp, or SLP-76 proteins were plated onto stimulatory coverslips and continuously visualized using confocal microscopy. The resulting images were rendered into kymographs, and the movement of individual clusters of these proteins in multiple live cells was traced from the time they formed until they dissipated. Such cluster analysis differs from that of colocalization or FRET analyses in that it focuses exclusively on protein clusters rather than the general pool of examined proteins. This cluster analysis provides valuable information with high temporal resolution on cluster lifetime and kinetics. As seen in Fig. 5, clusters containing fluorescently tagged WASp or SLP-76 exhibited similar dynamics and differ from WAVE2. It seems that whereas SLP-76 and WASp clusters are translocated together, WAVE2 clusters only transiently interact with this signaling complex before they dissipate and distribute into a diffuse pattern at the leading edge of the lamellipodia. In addition, WASp and SLP-76 clusters show similar average movement rates and lifetimes compared with those containing fluorescently tagged WAVE2 clusters, which exhibited faster average movement rates and shorter lifetimes (Fig. 5; p ≤ 0.00007 and p ≤ 0.00002, respectively). These findings demonstrate that although both WASp and WAVE2 are implicated in regulating the actin machinery, they differ in their kinetics, and whereas WASp remains in clusters throughout T cell spreading (20), WAVE2 clusters are constantly forming and rapidly dissipating (supplemental Movies S1–S3).
FIGURE 5.
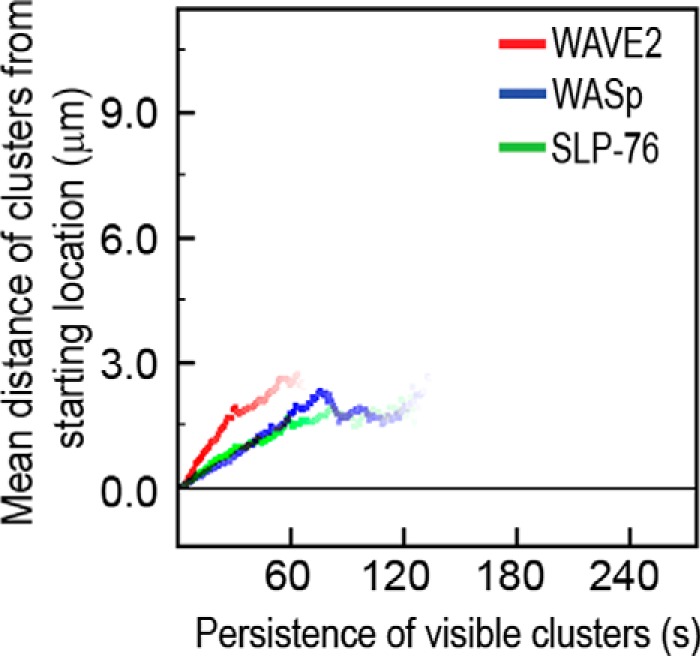
Kinetic analysis of WAVE2, WASp, and SLP-76 signaling clusters. Clusters containing fluorescently tagged WAVE2, WASp, or SLP-76 proteins were imaged and analyzed, as described under “Experimental Procedures.” Average traces demonstrating the movement of fluorescently tagged WAVE2, WASp, or SLP-76 clusters were calculated for each group. The y axis shows the average distance traversed by individual clusters (μm), the x axis is time (s), and the color intensity of the line represents the relative number of clusters that remained visible of the starting number of clusters at each time point. Ten individual clusters in each of 4–6 cells from each group were analyzed to give a total of at least 40–60 clusters from each group.
To explore how WAVE2 signaling complexes with SLP-76 and vinculin are dynamically and spatially regulated during lymphocyte activation in vivo, we used the triple color FRET (3FRET) technology, previously described by us (25). For the 3FRET system, we used specific controls for calibration of the three pairs, and a new setting condition was calculated (data not shown). To this end, three fusion proteins were transfected into Jurkat E6.1 cells, WAVE2-CFP, SLP-76-YFP, and mCherry-vinculin, and their FRET efficiencies were determined after 2 or 5 min of activation (Fig. 6). Our 3FRET analysis indicated FRET efficiency of 35.3 ± 5.7% between SLP-76 and WAVE2 at 2 min, followed by a significant reduction (8.4 ± 2.7%, p ≤ 0.0001) at 5 min. In parallel, a gradual increase in the FRET efficiency was observed between WAVE2 and vinculin, to 28.8 ± 5.4% (p ≤ 0.04). No FRET was detected between SLP-76 and vinculin throughout T cell activation.
FIGURE 6.
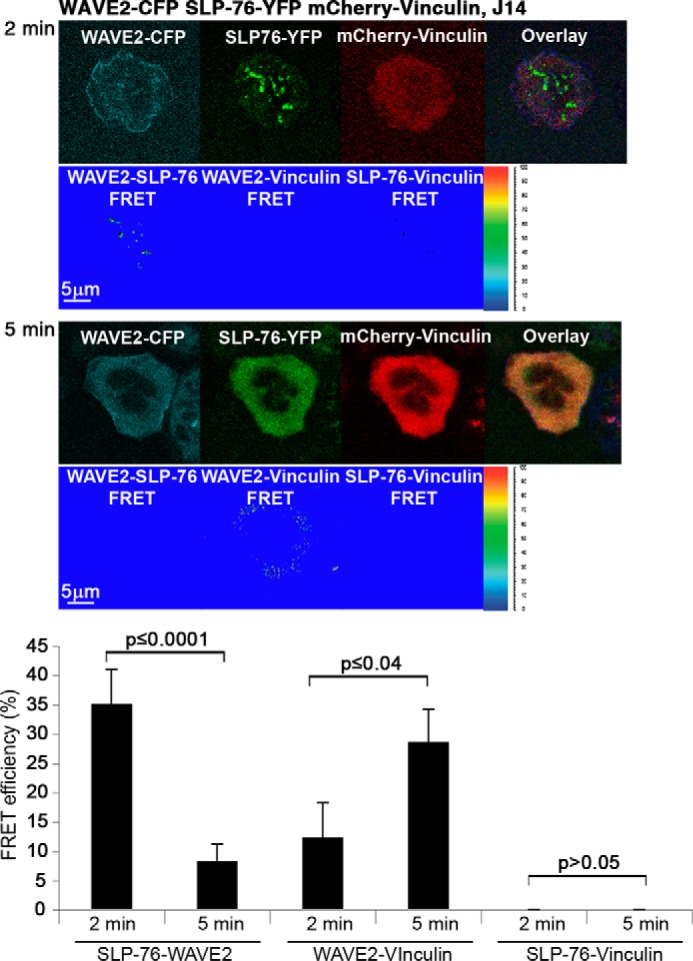
3FRET analysis of WAVE2·SLP-76·vinculin signaling complex dynamics during lymphocyte activation. Jurkat E6.1 T cells were transfected with WAVE2-CFP, SLP-76-YFP, and mCherry-vinculin. Cells were plated onto stimulatory antibody-coated coverslips, and 3FRET efficiencies were calculated as described under “Experimental Procedures.” Data shown are representative of at least three independent experiments. Note that excitation and filter settings of the 3FRET imaging differed from those used in the double color FRET experiments. Error bars, S.E.
LAT and SLP-76 Are Required for WAVE2 Phosphorylation on Serine 351 Residue
We next examined the possible influence of WAVE2-associated proteins, including LAT and SLP-76, on WAVE2 activation. As described above, although serine/threonine phosphorylation of WAVE2 serves as only one of the criteria of its activation (11, 12), we focused on this element. MAPKs phosphorylate WAVE2 at three sites: Ser-343, Thr-346, and Ser-351 (39–42). WAVE2 activation was determined by the phosphorylation of Ser-351 residue. J.CaM2.5 and J14 cells were either left unstimulated or were stimulated for 1, 3, or 5 min and then analyzed for WAVE2 activation by immunoblotting with a phospho-specific (Ser(P)-351) WAVE2 antibody. This analysis was compared with analyses performed using LAT- and SLP-76-reconstituted cells. Interestingly, WAVE2 was phosphorylated in LAT- and SLP-76-reconstituted cells but not in their deficient counterparts. These data suggest that WAVE2 activation as detected by its phosphorylation on Ser-351 is dependent on LAT- and SLP-76-signaling molecules (Fig. 7A). However, further investigation is required to clarify this point.
FIGURE 7.

Analysis of WAVE2 activation and molecular complex. A, LAT-deficient T cells (J.CaM2.5), J.CaM2.5 cells reconstituted with LAT WT- and SLP-76-deficient T cells (J14), and J14 cells reconstituted with SLP-76 WT were left unstimulated or stimulated for the indicated times, lysed, and blotted (IB) for pWAVE2, WAVE2, and GAPDH (as a loading control). B, FRET efficiency of the molecular interaction between Nck and WAVE2 was determined in E6.1 cells expressing CFP-Nck and YFP-WAVE2. Imaging analysis was performed on 25 cells for each time point. Data shown are representative of three independent experiments. C, Jurkat E6.1 T cells were stimulated for the indicated times and lysed. Cell lysates were immunoprecipitated (IP) with anti-WAVE2 and blotted for Nck. WCL, whole cell lysates. D, SLP-76-deficient T cells expressing SLP-76-YFP and WAVE2-CFP were treated with siRNA specific to Nckα and -β or NS siRNA. After 48 h, cells were plated and activated, and FRET efficiency for each group was calculated. E, the WAVE2 shape index was determined as described under “Experimental Procedures.” Imaging analysis was performed on 35 cells. Significant differences (p ≤ 0.00001) were found in WAVE2 distribution as determined by this assay in cells treated with Nckα and -β siRNA, compared with the results from the control group (NS). Error bars, S.E.
Nck Interacts with the WAVE2 Complex
Nck is an adaptor protein consisting of three SH3 domains and one SH2 domain at the C terminus and serves as a mediator between upstream signals and downstream responses (43, 44). Following TCR engagement, Nck is recruited to the membrane by an interaction of its SH2 domain with phosphorylated tyrosines 113 and 128 of SLP-76 (45–50). The role of Nck in the recruitment of the WAVE2 complex to T cell membrane and its association with WAVE2 have not been resolved.
Thus, we first examined the binding of Nck to WAVE2 both by imaging and biochemical approaches. In order to follow the dynamics of Nck and WAVE2, we transfected Jurkat E6.1 with WAVE2 tagged with YFP and Nck tagged with CFP at the N terminus. Upon activation, Nck and WAVE2 appeared at the contact sites; the proteins were colocalized, and a stable FRET efficiency of 39.3 ± 3.4 and 37.3 ± 4.8% was measured after 1 and 3 min of activation, respectively (Fig. 7B, top and middle). After 5 min of activation, both WAVE2 and Nck migrated to the cell periphery, where they colocalized, although no FRET efficiency was detected between them (Fig. 7B, bottom). Similar data were obtained by co-immunoprecipitation of WAVE2·Nck complexes. WAVE2 was immunoprecipitated, and the blot was probed with Nck antibody. We found that WAVE2 associated with Nck within the first 3 min of activation, with a substantial reduction after 5 min of activation (Fig. 7C).
FRET analysis measures protein interactions at a distance range of 1–10 nm, whereas biochemical analysis is less sensitive to distance between molecules and can be influenced by indirect interactions; this difference in distance sensitivity explains why, although the colocalization between Nck and WAVE2 was detected by an immunoprecipitation assay after 5 min of activation (Fig. 7C), only negligible interaction was measured by FRET (Fig. 7B). Employing a gene silencing approach, we examined the role of the two Nck isoforms, Nckα and -β, in WAVE2 scattering and dynamics, cell morphology, and shape. Following Nckα,β co-silencing or transfection with nonspecific (NS) siRNA (as negative control), J14 cells expressing WAVE2-CFP and SLP-76-YFP were stimulated and analyzed for WAVE2-SLP-76 interactions (Fig. 7D). After 3 min of activation, WAVE2 rapidly migrated to the periphery in both the Nck-silenced cells and in cells treated with NS siRNA. The FRET efficiency in cells silenced for both Nck isoforms was significantly lower than in cells expressing Nck WT (p ≤ 0.01). In addition, as demonstrated by the WAVE2 shape index (Fig. 7E) in the NS siRNA-treated cells, WAVE2 formed a typical ring shape, whereas in the Nckα,β siRNA-treated cells, WAVE2 was diffusely spread in a less ordered manner (Fig. 7E; p ≤ 0.00001).
Characterization of the Molecular Interactions between Nck and WAVE2
Because Nck recruits WASp to the TCR site (20), we next sought to determine whether WAVE2, similarly to WASp, interacts directly with Nck and competes with WASp for Nck binding sites or alternatively interacts through another molecular linkage. The interaction of WAVE2 and Nck can be mediated by a direct interaction of the PRD of WAVE2 with one of the SH3 domains of Nck or indirectly through Hem1, a WAVE2-associated protein. Hem1 interacts with the N terminus SH3 domain of Nck (51) and, therefore, might mediate an indirect interaction between Nck and WAVE2 WHD.
To identify the molecular link between Nck and WAVE2 and to determine potential competition with WASp, we investigated which of the proposed interactions occurs. YFP-WAVE2 constructs with a deletion of the WHD, PRD, or both domains were prepared (Fig. 8A). Mutant YFP-WAVE2 constructs were co-transfected into Jurkat E6.1 cells. Immunoprecipitation using anti-GFP antibody was performed, and the lysates were tested for the presence of Nck. As expected, we found an interaction between the WT YFP-WAVE2 and Nck; this interaction was severely impaired when the WHD domain or the PRD was deleted and completely abolished when the YFP-WAVE2 was mutated in both WHD and PRD domains (Fig. 8B). These results clearly demonstrate that WAVE2 binds to Nck via these domains and that the WHD and the PRD motifs have a role in stabilizing the WAVE2-Nck interaction.
FIGURE 8.

WAVE2 PRD domain binds to the N and the C terminus SH3 domains of Nck. A, domain structure of WAVE2 and deletion mutants used in this study. B, Jurkat E6.1 T cells were transfected with plasmids expressing various mutants of YFP-WAVE2. Anti-GFP immunoprecipitates (IP) were subjected to immunoblotting (IB) with anti-Nck and anti-GFP antibodies. Data shown are representative of four independent experiments. C, domain structure of Nck and scheme showing point mutations at the N-terminal, C-terminal, or middle SH3 domains of Nck. D, Jurkat E6.1 T cells stably expressing YFP-Nck mutants were analyzed by Western blotting. The membrane was blotted with anti-GFP and GAPDH (as a loading control). E, stable Jurkat E6.1 T cells expressing various mutations in Nck were stimulated, immunoprecipitated with anti-WAVE2, and subsequently blotted with anti-GFP and WAVE2. Data shown are representative of three independent experiments.
Our next goal was to identify the corresponding molecular sites on Nck that are required for the interaction with WAVE2. Nck has three SH3 domains, which may potentially interact with the PRD domain of WAVE2. Nck associates with WASp via its middle and C terminus SH3 domains and with Hem1 through the N-terminal SH3 domain (48, 51, 52). In addition to elucidating the molecular linkage between WAVE2 and proximal signaling molecules, we expected these experiments to reveal whether WASp and WAVE2 compete for binding to the Nck SH3 domain. To address this issue, we individually mutated Nck SH3 domains and also prepared a construct containing mutations in both the N- and the C-terminal SH3 domains (Fig. 8C). Nck mutants were tagged with YFP at their N terminus. Stable T cell lines expressing the different mutant molecules were generated, and the expression levels were tested by Western blot analysis (Fig. 8D). Next, WAVE2 was immunoprecipitated from cell lysates expressing WT or mutated Nck, and the lysates were examined for the presence of Nck using GFP antibody (Fig. 8E). WAVE2 interacted with both Nck WT and with the Nck mutated in the middle (M) SH3 domain. This interaction was slightly impaired in the C terminus SH3 mutant and was weakened even more in the presence of a point mutation in the N terminus SH3 domain. Interestingly, the interaction was completely abolished when both the N and C terminus SH3 domains were mutated, indicating that the N terminus SH3 domain of Nck and, to a lesser extent, its C-terminal SH3 domain are involved in the association with WAVE2.
The Dynamics of WAVE2 in Comparison with WASp following TCR Activation
The results described above indicate that recruitment of both WAVE2 and WASp to the TCR site depends on ZAP-70, LAT, and SLP-76. In view of the fact that the interaction of WAVE2 with Nck depends on the Nck N-terminal and C-terminal SH3 domains and that the latter serves as the binding site of Nck to the WASp PRD (48, 52), we determined the relative spatial and temporal distribution of WAVE2 and WASp following TCR activation. Thus, we first transfected WASp-CFP and YFP-WAVE2 into T cells and simultaneously followed their distribution over the course of T cell activation. We also determined their FRET efficiencies.
During the first 3 min of activation, WAVE2 and WASp appeared at the tight contacts between the cells and the stimulatory surface, previously shown to be TCR engagement sites (53). WASp and WAVE2 were colocalized, and a stable FRET efficiency of 42.7 ± 1 and 40.5 ± 3.6% was measured at 1 and 3 min of activation, respectively (Fig. 9A, top and middle). By the end of the activation process, after 5 min, both proteins migrated toward the cell periphery. At that time point, no FRET was measured between these proteins, suggesting their complete separation (Fig. 9A, bottom). Dissociation of WAVE2-WASp proteins over the course of TCR activation was also demonstrated in PBLs by immunoprecipitation analysis (Fig. 9B).
FIGURE 9.

Differential distributions and functions of WAVE2 and WASp. A, FRET analysis of the molecular interaction of WASp with WAVE2 performed in E6.1 cells expressing WASp-CFP and YFP-WAVE2. Imaging analysis was performed on 25 cells for each time point. B, PBLs were stimulated, as indicated. Cell lysates were immunoprecipitated (IP) with anti-WAVE2 antibody and immunoblotted (IB) with anti-WASp and anti-WAVE2 antibodies. C, Jurkat T cells were treated with NS siRNA, WAVE2 siRNA, or WASp siRNA. After 48 h, cells were analyzed for protein expression levels, as shown on the right. Cells were stained with calcein AM and added to a flat-bottom 96-well plate precoated with 0.3 mg of fibronectin and left unstimulated or stimulated with anti-CD3. Cell adhesion was determined as described under “Experimental Procedures.” Data shown are representative of three independent experiments. D, flow cytometry analysis of the LFA-1-active form present in cells treated with NS, WAVE2, or WASp siRNA. Flow cytometry plots were gated on total viable cells. Error bars, S.E.
Previously, it was shown that WAVE2 regulates integrin clustering at the IS, leading to high affinity binding of integrins to their ligands, and is involved in Rap1 activation (9, 22). Because the role of WASp in integrin activation is unclear, we decided to elucidate the potential differential activities of WAVE2 and WASp and to compare their roles in integrin-mediated adhesion by their ability to adhere to fibronectin, using a gene silencing approach. T cells were transfected with WAVE2 or WASp siRNA, demonstrating ∼90% gene silencing, and their ability to adhere to fibronectin in response to TCR induction was determined, as described under “Experimental Procedures” (Fig. 9C). Cells treated with NS siRNA served as a negative control. Whereas WASp siRNA-treated cells demonstrated no reduction in their adhesion to fibronectin in comparison with NS siRNA (p > 0.61), WAVE2-depleted cells showed a substantial decrease in this adhesion phenotype following T cell activation (p ≤ 0.001). In order to examine the suggested role of WAVE2 in integrin activation more specifically, we analyzed the expression level of the active form of the LFA-1 integrin by flow cytometry in NS, WAVE2, or WASp siRNA-treated cells using the conformation-sensitive anti-LFA-1 KIM127 mAb, which recognizes the active form of this integrin. In agreement with the fibronectin-binding assays, the silencing of WAVE2, but not WASp, led to a substantial decrease in the activation of the LFA-1 integrin, as determined by FACS analysis (Fig. 9D).
These results indicate that although both WASp and WAVE2 interact with the actin machinery, the dynamics of their association with the proximal signaling proteins differ. Although both WASp and WAVE2 interact directly with Nck via its C-terminal SH3 domain, the interactions of Nck with WASp are stable (20), whereas those with WAVE2 are transient and are mainly mediated via the Nck N-terminal SH3 domain. The non-overlapping dynamics of WAVE2 and WASp are consistent with and could explain their differential roles in integrin-mediated adhesion.
DISCUSSION
Here we demonstrate the distinct activation-dependent recruitment of WAVE2 to the TCR site relative to that of WASp and how these differences explain different functional outcomes of these two proteins. The signaling cascades linking the TCR to actin polymerization play a critical role in controlling vital cellular properties, such as cell proliferation, motility, and adhesion. Importantly, alterations or deficiencies in dynamic actin cytoskeletal rearrangement are linked to immune cell unresponsiveness (54) and result in immunodeficiencies, such as the Wiskott-Aldrich syndrome and X-linked thrombocytopenia. The mechanisms controlling actin polymerization and rearrangement are not completely understood. The nucleation-promoting factors WASp and WAVE2 are major regulators of actin dynamics. However, although the molecular mechanisms governing the recruitment of WASp to the TCR site have been extensively studied (20, 32, 33), those regulating WAVE2 remain mostly unknown. Localization of WAVE2 to the cell membrane is required for its function (1).
In this study, we compared the molecular cascades linking WASp and WAVE2 to both shared and distinct actin-dependent processes (Fig. 10). Our data demonstrate that upon TCR engagement, WAVE2 is recruited to the TCR site and forms signaling clusters. These interactions occur through the association with protein-tyrosine kinases (i.e. ZAP-70 and the adaptor proteins LAT, SLP-76, and Nck). After several min of activation, WAVE2 disassociates from these molecules and interacts with vinculin, which is essential for TCR-mediated integrin activation. The disassociation of WAVE2 from the WASp signaling complex and its rapid translocation to the leading edge of the actin-rich site reflect both the similarities and the differences between the role of WAVE2 and that of WASp.
FIGURE 10.
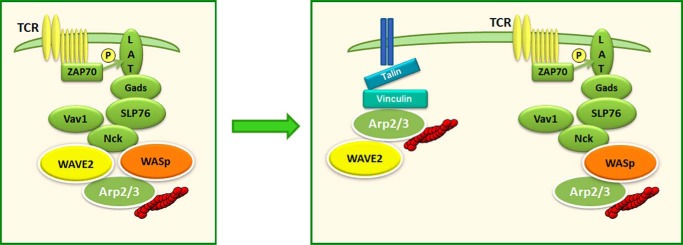
Proposed model for the recruitment and the molecular interactions of WAVE2 following TCR activation. Following TCR engagement, the WAVE2 complex is recruited to the TCR site by ZAP-70, LAT, SLP-76, and Nck, leading to actin polymerization (depicted as red filaments) (left). Late in the activation process, WAVE2 disassociates from the SLP-76·WASp signaling clusters and translocates to vinculin-rich sites where it regulates integrin activation by binding to talin (right).
Using mutated T cell lines lacking key signaling molecules (ZAP-70, LAT, or SLP-76) in comparison with their corresponding reconstituted cells, we demonstrated that WAVE2 recruitment to the TCR site is impaired when these signaling molecules are absent. Furthermore, co-localization between pZAP-70 and WAVE2 is dependent on the presence of LAT and SLP-76. Experiments were performed in primary lymphocytes to confirm these signaling cascades.
More rigorous evidence for the interaction between WAVE2, LAT, SLP-76, and Nck was provided by FRET analysis. High FRET efficiency was detected between WAVE2 and fluorescently tagged LAT, SLP-76, Nck, and WASp molecules within the first 3 min of activation. Interestingly, after 5 min of activation, FRET efficiency was dramatically reduced to negligible levels. SLP-76, together with WASp, translocates to the perimeter of the cells before their internalization. WAVE2, together with vinculin, translocates to the cell's leading edge, most probably for integrin activation. These results indicate that WASp and WAVE2 remain in the same signaling complex only within the first minutes of activation.
Live cell imaging analysis provided insights into the dynamics of WAVE2 relative to WASp and SLP-76 in terms of protein clusters. Our data showed that upon TCR stimulation, WAVE2 clusters are formed and move quickly to the leading edge of the forming lamellipodia, where they rapidly dissipate, whereas WASp and SLP-76 clusters exhibit slower cluster movement and increased lifetimes of visible clusters. These data indicate that WAVE2 and WASp differ not only in the dynamics of their association with proximal signaling proteins but also in their cluster kinetics.
Although Nck and WASp were also previously shown to translocate to actin-rich sites, both of them were found in the inner ring of actin filaments (20), whereas WAVE2 was observed at the leading edge. Indeed, after 5 min of activation, no FRET was measured between Nck or WASp and WAVE2. Instead, we found high FRET efficiency between WAVE2 and vinculin. Triple color FRET analysis between SLP-76, WAVE2, and vinculin confirmed these results. Although high FRET efficiency was observed between SLP-76 and WAVE2 at 2 min of activation, with low FRET between WAVE2 and vinculin, this trend was reversed at 5 min, indicating low FRET between SLP-76 and WAVE2 and high FRET between WAVE2 and vinculin. These data clearly indicate that, in contrast to the stable interaction detected between SLP-76 and WASp throughout the entire activation process (20), the interaction between WAVE2 and SLP-76 is transient.
Our results were confirmed using a biochemical approach. Co-immunoprecipitation of WAVE2 with SLP-76 and Nck was evident at only the initial activation stage, whereas the interaction with vinculin occurred later. Interestingly, co-immunoprecipitation of vinculin with WASp did not yield any precipitates, supporting the assumption that WASp in the presence of WAVE2 is not involved in integrin activation. These data are supported by our findings demonstrating that WAVE2, but not WASp, gene silencing reduces the ability of the cells to bind fibronectin and leads to a substantial decrease in LFA-1 activation.
Thus, our results illustrate the differential roles and functions of WAVE2 and WASp, stemming from the different recruitment and activity mechanisms of these two nucleation-promoting factors. Although WASp and WAVE2 are both involved in formation of the lamellipodia, WASp participates together with SLP-76 in vesicular trafficking and endocytosis (7, 19–21, 55), whereas WAVE2 is involved in integrin-mediated adhesion. The divergence of these two signaling pathways enables the independent activities of WAVE2 and WASp. Characterizing the time point at which these two signaling pathways diverge offers invaluable insights, allowing the specific pathways controlled by each protein to be identified.
Previous studies (11, 12) showed that the WAVE regulatory complex is inactive toward the Arp2/3 complex but can be stimulated by the Rac GTPase, kinases (ERK, Abl, and others), and phosphatidylinositols. Accordingly, the crystal structure of the WAVE regulatory complex (11) suggests spatial proximity of the Rac binding site and the WAVE regulatory complex, suggesting that Rac and phospholipids could cooperatively recruit the complex to the membrane. However, the PRD domain of WAVE2 was not included in the crystallization analysis; based on our findings, we suggest that the recruitment of WAVE2 to the membrane also requires SH3-containing proteins (i.e. Nck).
Indeed, our data indicate that Nck plays an important role in the recruitment of WAVE2 to the cell membrane. Gene silencing of Nck alters WAVE2 translocation. This is achieved due to its SH2/SH3 domains, which simultaneously enable its recruitment to the SLP-76 signaling complex (50, 56, 57) and to the nucleation-promoting factors, WASp and WAVE2. Previously, a 2:1 stoichiometry between Nck and N-WASp was demonstrated, and it was suggested that the interaction of Nck with WASp occurs via the middle and C terminus SH3 domains of Nck, which associate with the WASp WH1 (through the WASp-interacting protein) and PRD domains, respectively (58). Here, we demonstrate that the interaction of Nck with WAVE2 is mediated mainly by the N-terminal SH3 domain and, to a lesser extent, by the C-terminal SH3 domain that associate with the WAVE2 WHD and PRD binding sites, respectively. Interestingly, unlike the Nck-WASp interaction, which is constitutive and independent of TCR activation (20, 48, 52), the Nck-WAVE2 interaction is transient and becomes weakened at later time points following activation. By exploring the WAVE2-Nck association with mutations in both WAVE2 and Nck, our study shows that the interactions between WAVE2 and Nck involve WAVE2-WHD and PRD domains. Because WAVE2 binds Nck directly through its PRD domain and indirectly via Hem1 through its WHD, it is possible that this interaction relies mostly on the formation of the pentameric complex consisting of PIR121, Hem1, Abi1/2, and HSPC300, whose conformation is affected by TCR activation. This might explain the transient association between Nck and WAVE2.
In this study, we compared WASp and WAVE2 regulatory cascades and explored the shared and distinct signaling cascades that link TCR engagement to an actin-dependent process. Identifying the specific partners of WAVE2 over the course of its recruitment and activity allowed us to demonstrate its differences from WASp, with its own unique role following activation. Indeed, as the cellular activation process progresses, WAVE2 discards the earlier binding partners that it shares with WASp and binds to integrin-mediated adhesion proteins, such as vinculin, that are not associated with WASp. The differences in the localization of WAVE2 and WASp strongly suggest that WAVE2 is regulated by a different signal from the one that regulates WASp. Indeed, whereas the similar distribution of WASp and WAVE2 observed at the early phase of the activation process explains their mutual involvement in membrane structure formation (e.g. lamellipodia), their differential interactions with specific signaling molecules, such as vinculin, in the late phase of activation, illustrate their diverse functions.
Supplementary Material
Acknowledgments
We thank Sophia Fried and Omri Matalon for technical assistance.
This work was supported, in part, by the Israeli Ministry of Health through the Office of the Chief Scientist, and by the Israel Science Foundation.

This article contains supplemental Movies S1–S3.
- TCR
- T cell antigen receptor
- IS
- immunological synapse
- WASp
- Wiskott-Aldrich syndrome protein
- WHD
- WAVE homology domain
- PRD
- proline-rich domain
- PBL
- peripheral blood lymphocyte
- SH2
- Src homology 2
- SH3
- Src homology 3
- 3FRET
- triple-color FRET
- CFP
- cyan fluorescent protein
- NS
- nonspecific.
REFERENCES
- 1. Gomez T. S., Billadeau D. D. (2008) T cell activation and the cytoskeleton: you can't have one without the other. Adv. Immunol. 97, 1–64 [DOI] [PubMed] [Google Scholar]
- 2. Reicher B., Barda-Saad M. (2010) Multiple pathways leading from the T-cell antigen receptor to the actin cytoskeleton network. FEBS Lett. 584, 4858–4864 [DOI] [PubMed] [Google Scholar]
- 3. Yu Y., Smoligovets A. A., Groves J. T. (2013) Modulation of T cell signaling by the actin cytoskeleton. J. Cell Sci. 126, 1049–1058 [DOI] [PubMed] [Google Scholar]
- 4. Xu X. P., Rouiller I., Slaughter B. D., Egile C., Kim E., Unruh J. R., Fan X., Pollard T. D., Li R., Hanein D., Volkmann N. (2012) Three-dimensional reconstructions of Arp2/3 complex with bound nucleation promoting factors. EMBO J. 31, 236–247 [DOI] [PMC free article] [PubMed] [Google Scholar]
- 5. Boczkowska M., Rebowski G., Petoukhov M. V., Hayes D. B., Svergun D. I., Dominguez R. (2008) X-ray scattering study of activated Arp2/3 complex with bound actin-WCA. Structure 16, 695–704 [DOI] [PMC free article] [PubMed] [Google Scholar]
- 6. Campellone K. G., Welch M. D. (2010) A nucleator arms race: cellular control of actin assembly. Nat. Rev. Mol. Cell Biol. 11, 237–251 [DOI] [PMC free article] [PubMed] [Google Scholar]
- 7. Matalon O., Reicher B., Barda-Saad M. (2013) Wiskott-Aldrich syndrome protein: dynamic regulation of actin homeostasis: from activation through function and signal termination in T lymphocytes. Immunol. Rev. 256, 10–29 [DOI] [PubMed] [Google Scholar]
- 8. Nolz J. C., Gomez T. S., Zhu P., Li S., Medeiros R. B., Shimizu Y., Burkhardt J. K., Freedman B. D., Billadeau D. D. (2006) The WAVE2 complex regulates actin cytoskeletal reorganization and CRAC-mediated calcium entry during T cell activation. Curr. Biol. 16, 24–34 [DOI] [PMC free article] [PubMed] [Google Scholar]
- 9. Nolz J. C., Nacusi L. P., Segovis C. M., Medeiros R. B., Mitchell J. S., Shimizu Y., Billadeau D. D. (2008) The WAVE2 complex regulates T cell receptor signaling to integrins via Abl- and CrkL-C3G-mediated activation of Rap1. J. Cell Biol. 182, 1231–1244 [DOI] [PMC free article] [PubMed] [Google Scholar]
- 10. Zipfel P. A., Bunnell S. C., Witherow D. S., Gu J. J., Chislock E. M., Ring C., Pendergast A. M. (2006) Role for the Abi/wave protein complex in T cell receptor-mediated proliferation and cytoskeletal remodeling. Curr. Biol. 16, 35–46 [DOI] [PubMed] [Google Scholar]
- 11. Chen Z., Borek D., Padrick S. B., Gomez T. S., Metlagel Z., Ismail A. M., Umetani J., Billadeau D. D., Otwinowski Z., Rosen M. K. (2010) Structure and control of the actin regulatory WAVE complex. Nature 468, 533–538 [DOI] [PMC free article] [PubMed] [Google Scholar]
- 12. Lebensohn A. M., Kirschner M. W. (2009) Activation of the WAVE complex by coincident signals controls actin assembly. Mol. Cell 36, 512–524 [DOI] [PMC free article] [PubMed] [Google Scholar]
- 13. Leng Y., Zhang J., Badour K., Arpaia E., Freeman S., Cheung P., Siu M., Siminovitch K. (2005) Abelson-interactor-1 promotes WAVE2 membrane translocation and Abelson-mediated tyrosine phosphorylation required for WAVE2 activation. Proc. Natl. Acad. Sci. U.S.A. 102, 1098–1103 [DOI] [PMC free article] [PubMed] [Google Scholar]
- 14. Nakagawa H., Miki H., Nozumi M., Takenawa T., Miyamoto S., Wehland J., Small J. V. (2003) IRSp53 is colocalised with WAVE2 at the tips of protruding lamellipodia and filopodia independently of Mena. J. Cell Sci. 116, 2577–2583 [DOI] [PubMed] [Google Scholar]
- 15. Derivery E., Fink J., Martin D., Houdusse A., Piel M., Stradal T. E., Louvard D., Gautreau A. (2008) Free Brick1 is a trimeric precursor in the assembly of a functional wave complex. PLoS One 3, e2462. [DOI] [PMC free article] [PubMed] [Google Scholar]
- 16. Kunda P., Craig G., Dominguez V., Baum B. (2003) Abi, Sra1, and Kette control the stability and localization of SCAR/WAVE to regulate the formation of actin-based protrusions. Curr. Biol. 13, 1867–1875 [DOI] [PubMed] [Google Scholar]
- 17. Yamazaki D., Oikawa T., Takenawa T. (2007) Rac-WAVE-mediated actin reorganization is required for organization and maintenance of cell-cell adhesion. J. Cell Sci. 120, 86–100 [DOI] [PubMed] [Google Scholar]
- 18. Huang Y., Comiskey E. O., Dupree R. S., Li S., Koleske A. J., Burkhardt J. K. (2008) The c-Abl tyrosine kinase regulates actin remodeling at the immune synapse. Blood 112, 111–119 [DOI] [PMC free article] [PubMed] [Google Scholar]
- 19. McGavin M. K., Badour K., Hardy L. A., Kubiseski T. J., Zhang J., Siminovitch K. A. (2001) The intersectin 2 adaptor links Wiskott Aldrich syndrome protein (WASp)-mediated actin polymerization to T cell antigen receptor endocytosis. J. Exp. Med. 194, 1777–1787 [DOI] [PMC free article] [PubMed] [Google Scholar]
- 20. Barda-Saad M., Braiman A., Titerence R., Bunnell S. C., Barr V. A., Samelson L. E. (2005) Dynamic molecular interactions linking the T cell antigen receptor to the actin cytoskeleton. Nat. Immunol. 6, 80–89 [DOI] [PubMed] [Google Scholar]
- 21. Badour K., McGavin M. K., Zhang J., Freeman S., Vieira C., Filipp D., Julius M., Mills G. B., Siminovitch K. A. (2007) Interaction of the Wiskott-Aldrich syndrome protein with sorting nexin 9 is required for CD28 endocytosis and cosignaling in T cells. Proc. Natl. Acad. Sci. U.S.A. 104, 1593–1598 [DOI] [PMC free article] [PubMed] [Google Scholar]
- 22. Nolz J. C., Medeiros R. B., Mitchell J. S., Zhu P., Freedman B. D., Shimizu Y., Billadeau D. D. (2007) WAVE2 regulates high-affinity integrin binding by recruiting vinculin and talin to the immunological synapse. Mol. Cell. Biol. 27, 5986–6000 [DOI] [PMC free article] [PubMed] [Google Scholar]
- 23. Zacharias D. A., Violin J. D., Newton A. C., Tsien R. Y. (2002) Partitioning of lipid-modified monomeric GFPs into membrane microdomains of live cells. Science 296, 913–916 [DOI] [PubMed] [Google Scholar]
- 24. Pauker M. H., Reicher B., Fried S., Perl O., Barda-Saad M. (2011) Functional cooperation between the proteins Nck and ADAP is fundamental for actin reorganization. Mol. Cell. Biol. 31, 2653–2666 [DOI] [PMC free article] [PubMed] [Google Scholar]
- 25. Pauker M. H., Hassan N., Noy E., Reicher B., Barda-Saad M. (2012) Studying the dynamics of SLP-76, Nck, and Vav1 multimolecular complex formation in live human cells with triple-color FRET. Sci. Signal. 5, rs3. [DOI] [PubMed] [Google Scholar]
- 26. Singh S., Plassmeyer M., Gaur D., Miller L. H. (2007) Mononeme: a new secretory organelle in Plasmodium falciparum merozoites identified by localization of rhomboid-1 protease. Proc. Natl. Acad. Sci. U.S.A. 104, 20043–20048 [DOI] [PMC free article] [PubMed] [Google Scholar]
- 27. Costes S. V., Daelemans D., Cho E. H., Dobbin Z., Pavlakis G., Lockett S. (2004) Automatic and quantitative measurement of protein-protein colocalization in live cells. Biophys J. 86, 3993–4003 [DOI] [PMC free article] [PubMed] [Google Scholar]
- 28. Nguyen K., Sylvain N. R., Bunnell S. C. (2008) T cell costimulation via the integrin VLA-4 inhibits the actin-dependent centralization of signaling microclusters containing the adaptor SLP-76. Immunity 28, 810–821 [DOI] [PubMed] [Google Scholar]
- 29. Balagopalan L., Barr V. A., Sommers C. L., Barda-Saad M., Goyal A., Isakowitz M. S., Samelson L. E. (2007) c-Cbl-mediated regulation of LAT-nucleated signaling complexes. Mol. Cell. Biol. 27, 8622–8636 [DOI] [PMC free article] [PubMed] [Google Scholar]
- 30. Reicher B., Joseph N., David A., Pauker M. H., Perl O., Barda-Saad M. (2012) Ubiquitylation-dependent negative regulation of WASp is essential for actin cytoskeleton dynamics. Mol. Cell. Biol. 32, 3153–3163 [DOI] [PMC free article] [PubMed] [Google Scholar]
- 31. Lu C., Ferzly M., Takagi J., Springer T. A. (2001) Epitope mapping of antibodies to the C-terminal region of the integrin β2 subunit reveals regions that become exposed upon receptor activation. J. Immunol. 166, 5629–5637 [DOI] [PubMed] [Google Scholar]
- 32. Cannon J. L., Labno C. M., Bosco G., Seth A., McGavin M. H., Siminovitch K. A., Rosen M. K., Burkhardt J. K. (2001) Wasp recruitment to the T cell:APC contact site occurs independently of Cdc42 activation. Immunity 15, 249–259 [DOI] [PubMed] [Google Scholar]
- 33. Zeng R., Cannon J. L., Abraham R. T., Way M., Billadeau D. D., Bubeck-Wardenberg J., Burkhardt J. K. (2003) SLP-76 coordinates Nck-dependent Wiskott-Aldrich syndrome protein recruitment with Vav-1/Cdc42-dependent Wiskott-Aldrich syndrome protein activation at the T cell-APC contact site. J. Immunol. 171, 1360–1368 [DOI] [PubMed] [Google Scholar]
- 34. Bunnell S. C., Hong D. I., Kardon J. R., Yamazaki T., McGlade C. J., Barr V. A., Samelson L. E. (2002) T cell receptor ligation induces the formation of dynamically regulated signaling assemblies. J. Cell Biol. 158, 1263–1275 [DOI] [PMC free article] [PubMed] [Google Scholar]
- 35. Houtman J. C., Houghtling R. A., Barda-Saad M., Toda Y., Samelson L. E. (2005) Early phosphorylation kinetics of proteins involved in proximal TCR-mediated signaling pathways. J. Immunol. 175, 2449–2458 [DOI] [PMC free article] [PubMed] [Google Scholar]
- 36. Zhang W., Sloan-Lancaster J., Kitchen J., Trible R. P., Samelson L. E. (1998) LAT: the ZAP-70 tyrosine kinase substrate that links T cell receptor to cellular activation. Cell 92, 83–92 [DOI] [PubMed] [Google Scholar]
- 37. Bonello G., Blanchard N., Montoya M. C., Aguado E., Langlet C., He H. T., Nunez-Cruz S., Malissen M., Sanchez-Madrid F., Olive D., Hivroz C., Collette Y. (2004) Dynamic recruitment of the adaptor protein LAT: LAT exists in two distinct intracellular pools and controls its own recruitment. J. Cell Sci. 117, 1009–1016 [DOI] [PubMed] [Google Scholar]
- 38. Bubeck Wardenburg J., Fu C., Jackman J. K., Flotow H., Wilkinson S. E., Williams D. H., Johnson R., Kong G., Chan A. C., Findell P. R. (1996) Phosphorylation of SLP-76 by the ZAP-70 protein-tyrosine kinase is required for T-cell receptor function. J. Biol. Chem. 271, 19641–19644 [DOI] [PubMed] [Google Scholar]
- 39. Spear M., Guo J., Turner A., Yu D., Wang W., Meltzer B., He S., Hu X., Shang H., Kuhn J., Wu Y. (2014) HIV-1 triggers WAVE2 phosphorylation in primary CD4 T cells and macrophages, mediating Arp2/3-dependent nuclear migration. J. Biol. Chem. 289, 6949–6959 [DOI] [PMC free article] [PubMed] [Google Scholar]
- 40. Mendoza M. C., Er E. E., Zhang W., Ballif B. A., Elliott H. L., Danuser G., Blenis J. (2011) ERK-MAPK drives lamellipodia protrusion by activating the WAVE2 regulatory complex. Mol. Cell 41, 661–671 [DOI] [PMC free article] [PubMed] [Google Scholar]
- 41. Nakanishi O., Suetsugu S., Yamazaki D., Takenawa T. (2007) Effect of WAVE2 phosphorylation on activation of the Arp2/3 complex. J. Biochem. 141, 319–325 [DOI] [PubMed] [Google Scholar]
- 42. Danson C. M., Pocha S. M., Bloomberg G. B., Cory G. O. (2007) Phosphorylation of WAVE2 by MAP kinases regulates persistent cell migration and polarity. J. Cell Sci. 120, 4144–4154 [DOI] [PMC free article] [PubMed] [Google Scholar]
- 43. Krause M., Sechi A. S., Konradt M., Monner D., Gertler F. B., Wehland J. (2000) Fyn-binding protein (Fyb)/SLP-76-associated protein (SLAP), Ena/vasodilator-stimulated phosphoprotein (VASP) proteins and the Arp2/3 complex link T cell receptor (TCR) signaling to the actin cytoskeleton. J. Cell Biol. 149, 181–194 [DOI] [PMC free article] [PubMed] [Google Scholar]
- 44. Rohatgi R., Nollau P., Ho H. Y., Kirschner M. W., Mayer B. J. (2001) Nck and phosphatidylinositol 4,5-bisphosphate synergistically activate actin polymerization through the N-WASP-Arp2/3 pathway. J. Biol. Chem. 276, 26448–26452 [DOI] [PubMed] [Google Scholar]
- 45. Bubeck Wardenburg J., Pappu R., Bu J. Y., Mayer B., Chernoff J., Straus D., Chan A. C. (1998) Regulation of PAK activation and the T cell cytoskeleton by the linker protein SLP-76. Immunity 9, 607–616 [DOI] [PubMed] [Google Scholar]
- 46. Jordan M. S., Koretzky G. A. (2010) Coordination of receptor signaling in multiple hematopoietic cell lineages by the adaptor protein SLP-76. Cold Spring Harb. Perspect. Biol. 2, a002501. [DOI] [PMC free article] [PubMed] [Google Scholar]
- 47. Jordan M. S., Sadler J., Austin J. E., Finkelstein L. D., Singer A. L., Schwartzberg P. L., Koretzky G. A. (2006) Functional hierarchy of the N-terminal tyrosines of SLP-76. J. Immunol. 176, 2430–2438 [DOI] [PubMed] [Google Scholar]
- 48. Lettau M., Pieper J., Gerneth A., Lengl-Janssen B., Voss M., Linkermann A., Schmidt H., Gelhaus C., Leippe M., Kabelitz D., Janssen O. (2010) The adapter protein Nck: role of individual SH3 and SH2 binding modules for protein interactions in T lymphocytes. Protein Sci. 19, 658–669 [DOI] [PMC free article] [PubMed] [Google Scholar]
- 49. Wunderlich L., Faragó A., Downward J., Buday L. (1999) Association of Nck with tyrosine-phosphorylated SLP-76 in activated T lymphocytes. Eur. J. Immunol. 29, 1068–1075 [DOI] [PubMed] [Google Scholar]
- 50. Barda-Saad M., Shirasu N., Pauker M. H., Hassan N., Perl O., Balbo A., Yamaguchi H., Houtman J. C., Appella E., Schuck P., Samelson L. E. (2010) Cooperative interactions at the SLP-76 complex are critical for actin polymerization. EMBO J. 29, 2315–2328 [DOI] [PMC free article] [PubMed] [Google Scholar]
- 51. Kitamura T., Kitamura Y., Yonezawa K., Totty N. F., Gout I., Hara K., Waterfield M. D., Sakaue M., Ogawa W., Kasuga M. (1996) Molecular cloning of p125Nap1, a protein that associates with an SH3 domain of Nck. Biochem. Biophys. Res. Commun. 219, 509–514 [DOI] [PubMed] [Google Scholar]
- 52. Rivero-Lezcano O. M., Marcilla A., Sameshima J. H., Robbins K. C. (1995) Wiskott-Aldrich syndrome protein physically associates with Nck through Src homology 3 domains. Mol. Cell. Biol. 15, 5725–5731 [DOI] [PMC free article] [PubMed] [Google Scholar]
- 53. Bunnell S. C., Kapoor V., Trible R. P., Zhang W., Samelson L. E. (2001) Dynamic actin polymerization drives T cell receptor-induced spreading: a role for the signal transduction adaptor LAT. Immunity 14, 315–329 [DOI] [PubMed] [Google Scholar]
- 54. Sechi A. S., Buer J., Wehland J., Probst-Kepper M. (2002) Changes in actin dynamics at the T-cell/APC interface: implications for T-cell anergy? Immunol. Rev. 189, 98–110 [DOI] [PubMed] [Google Scholar]
- 55. Barr V. A., Balagopalan L., Barda-Saad M., Polishchuk R., Boukari H., Bunnell S. C., Bernot K. M., Toda Y., Nossal R., Samelson L. E. (2006) T-cell antigen receptor-induced signaling complexes: internalization via a cholesterol-dependent endocytic pathway. Traffic 7, 1143–1162 [DOI] [PubMed] [Google Scholar]
- 56. Buday L., Wunderlich L., Tamás P. (2002) The Nck family of adapter proteins: regulators of actin cytoskeleton. Cell. Signal. 14, 723–731 [DOI] [PubMed] [Google Scholar]
- 57. Wu J. N., Koretzky G. A. (2004) The SLP-76 family of adapter proteins. Semin Immunol. 16, 379–393 [DOI] [PubMed] [Google Scholar]
- 58. Ditlev J. A., Michalski P. J., Huber G., Rivera G. M., Mohler W. A., Loew L. M., Mayer B. J. (2012) Stoichiometry of Nck-dependent actin polymerization in living cells. J. Cell Biol. 197, 643–658 [DOI] [PMC free article] [PubMed] [Google Scholar]
Associated Data
This section collects any data citations, data availability statements, or supplementary materials included in this article.