Background: The molecular mechanisms regulating brain development are unclear.
Results: HDAC3 deletion disrupts the organization of certain neuronal cell types and the proportions of some glial cell types in the cortex and cerebellum.
Conclusion: HDAC3 regulates brain development, and other HDACs cannot compensate for its function.
Significance: Our study identifies a key player in the regulation of brain development.
Keywords: Brain, Cerebellum, Glial Cell, Histone Deacetylase 3 (HDAC3), Neurodevelopment, Neuron, Cortex
Abstract
The functional role of histone deacetylase 3 (HDAC3) in the developing brain has yet to be elucidated. We show that mice lacking HDAC3 in neurons and glia of the central nervous system, Nes-Cre/HDAC3 conditional KO mice, show major abnormalities in the cytoarchitecture of the neocortex and cerebellum and die within 24 h of birth. Later-born neurons do not localize properly in the cortex. A similar mislocalization is observed with cerebellar Purkinje neurons. Although the proportion of astrocytes is higher than normal, the numbers of oligodendrocytes are reduced. In contrast, conditional knockout of HDAC3 in neurons of the forebrain and certain other brain regions, using Thy1-Cre and calcium/calmodulin dependent protein kinase II α-Cre for ablation, produces no overt abnormalities in the organization of cells within the cortex or of cerebellar Purkinje neurons at birth. However, both lines of conditional knockout mice suffer from progressive hind limb paralysis and ataxia and die around 6 weeks after birth. The mice display an increase in overall numbers of cells, higher numbers of astrocytes, and Purkinje neuron degeneration. Taken together, our results demonstrate that HDAC3 plays an essential role in regulating brain development, with effects on both neurons and glia in different brain regions.
Introduction
Histone deacetylases (HDACs)3 are proteins originally identified on the basis of their ability to deacetylate histones, resulting in the compacting of chromatin into a transcriptionally repressed state. HDACs also deacetylate a large number of other non-histone proteins in the nucleus, cytoplasm, and mitochondria, thereby regulating diverse cellular events. Vertebrates express 18 HDACs organized into four classes: class I (HDAC1, HDAC2, HDAC3, and HDAC8), class II (HDAC4, HDAC5, HDAC6, HDAC7, HDAC9, histone deacetylase-related protein (HDRP), and HDAC10), class III (SIRT1–7), and class IV (HDAC11). Class I, II, and IV HDACs are zinc-dependent enzymes collectively referred to as classical HDACs, whereas class III HDACs, commonly referred to as sirtuins, require NAD+ for their activity (1, 2).
Most HDACs are expressed efficiently in developing and adult brains, suggesting important roles in brain development and function (3). Surprisingly, knockout of several individual HDACs in mice, including HDACs 1, 2, 4, 5, 6, 7, 9, 10, and 11, does not produce a neurological phenotype (4), suggesting functional redundancy. Although deletion of either HDAC1 or HDAC2 in neuronal precursors produces mice that are normal, double conditional KO mice (cKO) lacking both these HDACs show reduced brain size, cellular disorganization in the cortex, and a deformed cerebellum and die within a week of birth (5). The severity of these neurological abnormalities can be sharply reduced with just one functional allele of HDAC1 or HDAC2 (5). As observed with conditional neuronal knockouts, mice lacking either HDAC1 or HDAC2 in oligodendrocytes or Schwann cells are normal, although double cKO mice lacking both HDACs display reduced myelination, severe tremor, and hind limb paralysis and die within 2–3 weeks (6–8). We have been interested in HDAC3, which, as we have described previously, plays a critical role in promoting the death of cultured postmitotic neurons (9–11). This neurotoxic effect of HDAC3 requires phosphorylation by GSK3β and its release from huntingtin (9–11). We showed that HDAC3 is required for the toxicity of mutant huntingtin (Htt), suggesting a role for HDAC3 in Huntington disease pathogenesis (11). However, HDAC3 is highly expressed in the developing and adult brain, where its function is not clear. To investigate this issue, we generated and analyzed the brains of HDAC3 cKO mice in which the gene was ablated either in the whole CNS or in neurons of select brain regions. We report neurodevelopmental abnormalities and perinatal death of mice in which HDAC3 is deleted in neural progenitor cells of the CNS. Serious neurological deficits and premature death are also observed in mice in which the HDAC3 gene is knocked out in neurons of select brain regions. Together, these results demonstrate an essential role of HDAC3 in brain development.
EXPERIMENTAL PROCEDURES
Mice
HDAC3lox/lox mice were obtained from Dr. Eric Olson of the University of Texas Southwestern Medical Center (12). CaMKII-Cre mice were obtained from Dr. Lisa Monteggia of the University of Texas Southwestern Medical Center (13). Nestin-Cre (Nes-Cre) (14) and Thy1-Cre (15) mice were purchased from The Jackson Laboratory (Bar Harbor, ME; catalog nos. Thy1-Cre 006143 and Nes-Cre 003771).
Mice were housed in a temperature-, humidity-, and light-controlled room (12-h light/dark cycle, lights from 7:00 AM to 19:00 PM). Food and water were available ad libitum. All procedures were conducted in accordance with the National Institutes of Health Guide for the Care and Use of Laboratory Animals as approved by the Southern Methodist University Institutional Animal Care and Use Committee.
Generation of Hdac3−/− cKO Mice
Hdac3−/− cKO mice were generated as described previously (10). Briefly, for CNS-specific knockdown, mice homozygous for loxP sites in the HDAC3 locus (Hdac3neo-loxP) were bred to Nes-Cre (The Jackson Laboratory) transgenic mice that express the Cre recombinase throughout the developing CNS. Their offspring, Hdac3+/− mice, were then interbred, and genotyping of pups was performed on the day of birth. For conditional knockdown in neurons of the forebrain and cerebellum, mice homozygous for loxP sites in the HDAC3 locus (Hdac3neo-loxP) were bred to Thy1-Cre (The Jackson Laboratory) or CaMKII-Cre transgenic mice that express the Cre recombinase throughout neurons in the forebrain and cerebellum. These Hdac3+/− mice were then interbred, and genotyping of pups was performed by P10.
Genotyping
Genotyping of Nes-Cre/HDAC3, Thy1-Cre/HDAC3, and CaMKII-Cre/HDAC3 cKO mice was performed as described previously (10, 12). Briefly, DNA was extracted from mouse toe clips for Thy1-Cre/HDAC3 and CaMKII-Cre/HDAC3 or tail tissue for Nes-Cre/HDAC3 mice using the REDExtract-N-Amp tissue PCR kit from Sigma-Aldrich (St. Louis, MO), and the DNA obtained was used in PCRs to determine the genotype: HDAC3, GCTTGGTAGCCAGCCAGCTTAG (forward) and CATGTGACCCCAGACATGACTGG (reverse); Cre, CCCGCAGAACCTGAAGATGTT (forward) and CGGCTATACGTAACAGGGTG (reverse); and Gdf, AAGCCCTCAGTCAGTTGTGC (forward) and AAAACCATGAAAGGAGTGGG (reverse).
Western Blot Analysis
Mice were euthanized by carbon dioxide inhalation prior to dissection of brain tissue. Brain tissue was homogenized in radioimmune precipitation assay buffer and centrifuged at 10,000 rpm for 10 min. Protein concentrations were taken using Bradford reagent from Bio-Rad. Protein samples were loaded on a 10% SDS-PAGE gel, transferred to a PVDF membrane, and probed with the following antibodies: anti-Total Erk (Cell Signaling Technology, Beverly, MA, 1:1000), anti-HDAC3 (Santa Cruz Biotechnology, Santa Cruz, CA, 1:500), anti-Olig2 (PhosphoSolutions, Aurora, CO, 1:500), anti-tubulin (Santa Cruz Biotechnology, 1:1000), anti-GFAP (Cell Signaling Technology, 1:1000), anti-FLAG (Sigma-Aldrich), and anti-GFP (Sigma-Aldrich). After incubation in the appropriate secondary antibody, membranes were subjected to enhanced chemiluminescence (GE Healthcare).
Open Field Locomotor Testing
To assess differences in motor function in cKO mice, the TruScan system from Coulbourn Instruments (Whitehall, PA) was utilized. Mice were analyzed for 15 min, and six different measurements were taken. Five measurements corresponded to movements in the floor plane, and one measurement was taken for vertical movements. Data are an average of cKO mice and wild-type littermates.
Histology
Sagittal brain sections were either stained with cresyl violet for structural studies or subjected to immunohistochemistry as described previously (16, 17). Briefly, brains were fixed in 4% paraformaldehyde in 0.1 m phosphate buffer and then allowed to sink in 20% sucrose solution in phosphate-buffered saline overnight. These brains were then frozen in cryopreservative solution (Cryo-STAT2, Statlab Medial Products, Lewisville, TX) on dry ice and sectioned sagitally at 20 μm on a cryostat. Sections were allowed to dry overnight. For cresyl violet staining, slides were immersed in xylene, followed by immersion in 100% ethanol, 95% ethanol, 70% ethanol, and distilled water. Slides were then immersed in cresyl violet staining solution and washed with distilled water. Finally, slides were immersed in 70% ethanol, 95% ethanol, 100% ethanol, and xylene. For immunohistochemistry, primary antibodies used on sections were as follows: Calbindin (Sigma-Aldrich, 1:500), GFAP (Cell Signaling Technology, 1:500), Ctip2 (Abcam, Cambridge, MA, 1:300), Satb2 (Abcam, 1:100), Tbr1 (Abcam, 1:4000), Ki67 (Neomarkers, Fremont, CA, 1:200), Reelin (Millipore, Billerica, MA, 1:400), and Olig2 (PhosphoSolutions, 1:500). Sections were first subjected to sodium citrate treatment and then blocked in 4% goat serum for 1 h. Then sections were incubated with primary antibody at 4 °C overnight, followed by incubation with Texas Red secondary antibody (Jackson ImmunoResearch Laboratories, West Grove, PA, 1:300) or FITC secondary antibody (Jackson ImmunoResearch Laboratories, 1:300) for 1 h at room temperature, and DAPI was used to stain cell nuclei.
Histological and Immunohistological Analyses
For all histological and immunohistological analyses, data were collected and analyzed from analogous sections of the anterior cortex or cerebellum of cKO and wild-type littermate mice. The numbers of Satb2-positive, Ctip2-positive, Ki67-positive, and DAPI-stained cells were counted blindly within a 0.15 mm2 area in the anterior cortex or cerebellum using the taxonomy function in NIS-Elements Advanced Research software. An average was taken from different fields of the anterior cortex or cerebellum for four different groups of wild-type and cKO littermates. DAPI counts were displayed as an average. Because changes in the number of DAPI-stained cells could contribute to the changes in the number of positive cells, positive cells counts were normalized to DAPI and expressed as a percentage of wild-type littermate controls. Calbindin staining intensity in the Nes-Cre/HDAC3 cKO and wild-type littermates was assessed using NIH ImageJ Software as described previously (18). For measurement of cortex or staining widths, NIS-elements Advanced Research software was used to calibrate the images, and then the measurement tools were used to quantify widths. The overall width of the cortex was measured from the top of layer I to the bottom of layer VI in the anterior cortex of wild-type and cKO littermates. Calbindin staining widths were collected as depicted in the schematic shown in Fig. 3. The measurements were averaged and expressed as a percentage of wild-type littermate controls.
FIGURE 3.
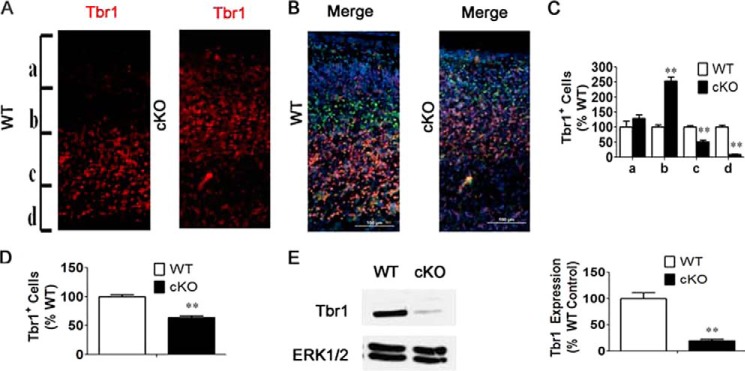
Knockdown of HDAC3 reduces Tbr1-positive cell numbers in the anterior cortex. A, Tbr1 staining in the superficial layers of the cortex in cKO mice compared with wild-type littermates. B, merged image of Ctip2, Tbr1, and DAPI staining. C and D, quantification of proportion of Tbr1-postive cells in the cortex (n = 4). E, Western blot analysis of Tbr1 in cortex of cKO mice. ERK1/2 was used as a loading control (n = 4). Values are mean ± S.E. **, p < 0.01.
ChIP
To examine binding of HDAC3 to the GFAP promoter, a glioblastoma cell line (U251), purchased from Sigma-Aldrich, was used. Briefly, cells were fixed in 1% formaldehyde for 10 min at room temperature. Fixation was stopped by adding glycine (0.125 m), and, after washing twice in ice-cold PBS, cells were collected and centrifuged at 1500 rpm for 10 min. Pellets were resuspended in 800 μl of buffer 1 (50 mm HEPES-KOH (pH 7.5), 140 mm NaCl, 1 mm EDTA (pH 8), 10% glycerol, 0.5% Nonidet P-40, 0.25% Triton X-100, 1 mm PMSF, and protease inhibitor mixture). Cells were lysed for 10 min on ice, and nuclei were pelleted by centrifugation at 3000 rpm for 10 min. After washing once with buffer 2 (200 mm NaCl, 1 mm EDTA (pH 8), 0.5 mm EGTA (pH 8), 10 mm Tris-HCl (pH 8.1), 0.5% SDS supplemented with 1 mm PMSF, and protease inhibitor mixture), nuclear were resuspended in buffer 3 (1 mm EDTA (pH 8), 0.5 mm EGTA (pH 8), 10 mm Tris-HCl (pH 8.1), 0.5% SDS supplemented with 1 mm PMSF, and protease inhibitor mixture) and sonicated to a size range of 800- to 1000-bp fragments. Samples were centrifuged at 13,000 rpm for 15 min at 4 °C. For ChIP analysis, 100 μg of chromatin was used. Samples were incubated overnight with 5 μg of HDAC3 antibody (Santa Cruz Biotechnology) or a control IgG antibody (Santa Cruz Biotechnology). After washing once, chromatin was reverse-cross-linked by incubating at 65 °C overnight, and DNA was then purified and dissolved in 60 μl of 10 mm Tris (pH 7.5). For PCR, 3 μl of template DNA was used. Primers were targeted to the proximal region of the GFAP promoter (around −500 bp to TSS) as well as far upstream (around −5000 bp to TSS). Primer sequences included the following: GFAP promoter (−500 to TSS), 5′AGTGTGACCCAGGGAAGCCTA (forward) and 5′TTTATTGAGGGGACGGGCTGG (reverse); GFAP promoter (−5000 to TSS), 5′TGATGCCTTCCATTTCCGGG (forward) and 5′CCAAGGTACAACGCTGGGTA (reverse); Nestin promoter (−500 to TSS), 5′GGGCAGTGTCTCTCTGCAAT (forward) and 5′GAGCTGGAGCGAGGGTATTC (reverse); and Tubb2A promoter (−500 to TSS), 5′CTCGCCCTCGATTATCACCC (forward) and 5′CCTTTTATACCCGGGGACCG (reverse).
Cell Culture Transfection
U251 cells were transfected with FLAG-HDAC3 or GFP expression plasmids, purchased from Sigma-Aldrich, for 24 or 48 h. Cell lysate was collected, and Western blot analysis was conducted to examine expression of GFAP.
Luciferase Activity
For Luciferase activity experiments, HEK293 cells were cotransfected with pcDNA3.1 FLAG-HDAC3 and hGFAP-Luc vectors (Addgene, Cambridge, MA) that contained human a GFAP promoter fragment (−2163 to +47). Briefly, cells were transfected for 48 h and lysed, and then luciferase activity was measured on a BioTek Synergy microplate reader using a Dual-Luciferase assay (Promega, Madison, WI).
Statistics
All statistical analyses were done using GraphPad Prism software. Student's t tests were performed for all quantification experiments. Data are expressed as the mean ± S.E. * or ** denotes a p value of <0.05 or <0.01, respectively.
RESULTS
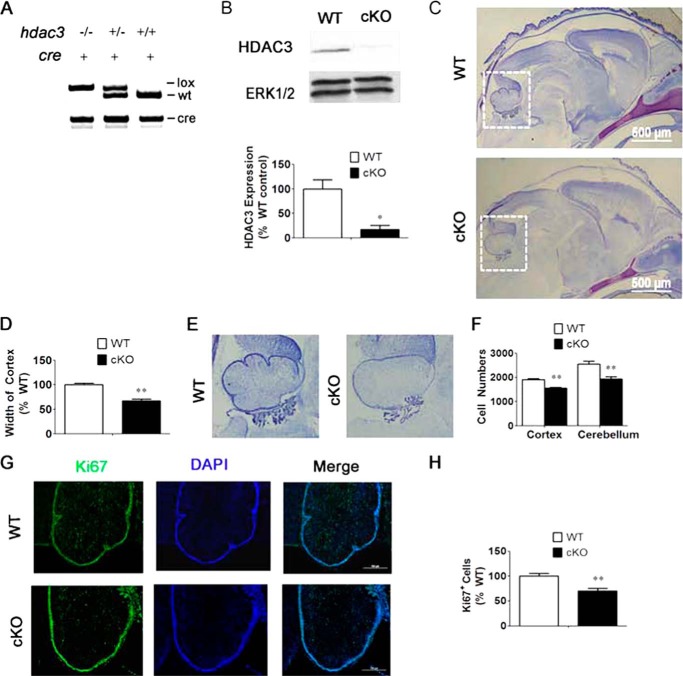
Because conventional HDAC3 knockout mice die by embryonic day 9.5 (12), we generated cKO mice in which the HDAC3 gene was ablated in neural progenitor cells by crossing HDAC3fl/fl mice with Nes-Cre transgenic mice. Because Cre is expressed in neural progenitor cells, this results in mice lacking HDAC3 in the CNS (Fig. 1A). Mice homozygous for ablation of the HDAC3 allele, henceforth referred to as Nes-Cre/HDAC3 cKO mice, were born in expected numbers and were indistinguishable in appearance from wild-type littermates. However, none of more than 25 Nes-Cre/HDAC3 cKO mice identified in our studies survived beyond 16 h after birth. Examination of the stomach of Nes-Cre/HDAC3 cKO mice showed the presence of milk, ruling out starvation as the reason for death. The appearance of other internal organs also revealed no obvious abnormalities. Results from Western blot experiments confirmed a reduction in HDAC3 expression at the protein level (Fig. 1B). In contrast to Nes-Cre/HDAC3 cKO mice, mice lacking only one HDAC3 allele survived normally, displayed no obvious defects, and were fertile (data not shown).
FIGURE 1.
Knockdown of HDAC3 in CNS neurons and glia causes abnormalities in the cerebellum and cortex. A, representative figure showing identification of genotypes. The left lane represents cKO mice, and the right lane represents wild-type (WT) littermate control mice. For Cre PCR results, + represents presence of Cre. B, Western blot analysis of Nes-Cre/HDAC3 cKO and wild-type littermate mice confirms knockdown of HDAC3 in the brains of cKO mice at P0. ERK1/2 was used as a loading control. C, histological analysis of Nes-Cre/HDAC3 cKO and control wild-type littermate mice. Sagittal sections from P0 Nes-Cre/HDAC3 wild-type mice and cKO littermates were stained with cresyl violet. D, quantification of the average cortex lengths of cKO mice as a percentage of the wild-type littermate control mice. Shown is a decreased average cortex length of cKO mice compared with wild-type littermate mice (n = 7). E, higher magnification of the same brain region from B, indicated by a white box. Defects in cerebellar foliations in cKO mice compared with wild-type littermate mice are shown. F, quantification of DAPI-stained cells per 0.15 mm2. Shown is a reduced number of DAPI cells in cKO mice compared with wild-type littermate controls (n = 4). G, reduced Ki67 staining in the cerebellum of cKO mice compared with wild-type littermate mice (n = 4). H, quantification of Ki67-positive cells in the cerebellum as described under “ Experimental Procedures.” Shown is a reduced proportion of Ki67-positive cells in cKO mice compared with wild-type littermates (n = 4). Values are mean ± S.E. *, p < 0.05; **, p < 0.01.
Examination of cresyl violet-stained sagittal sections of the Nes-Cre/HDAC3 brains revealed a decrease in width of the cortex (Fig. 1, C and D). Additionally, the cerebellum of the mutant displayed underdeveloped folia (Fig. 1, C and E). Quantification of cell numbers in random areas of the cortex and cerebellar cortex revealed a lower cell density in the mutant (Fig. 1F). TUNEL staining was performed to investigate whether the reduced cell number was due to increased cell death. However, no increase in TUNEL staining was discernible in the HDAC3 cKO cortex as compared with wild-type littermate controls (data not shown). This suggested that abnormal cell death, if any, was completed by P0 or because of a non-apoptotic mechanism. Alternatively, the reduced cell numbers could result from a reduction in cell production. Consistent with this possibility, we found that the proportion of Ki67-positive cells (Ki67 stains proliferating cells) is reduced in the cerebellum of Nes-Cre/HDAC3 cKO mice (Fig. 1, G and H).
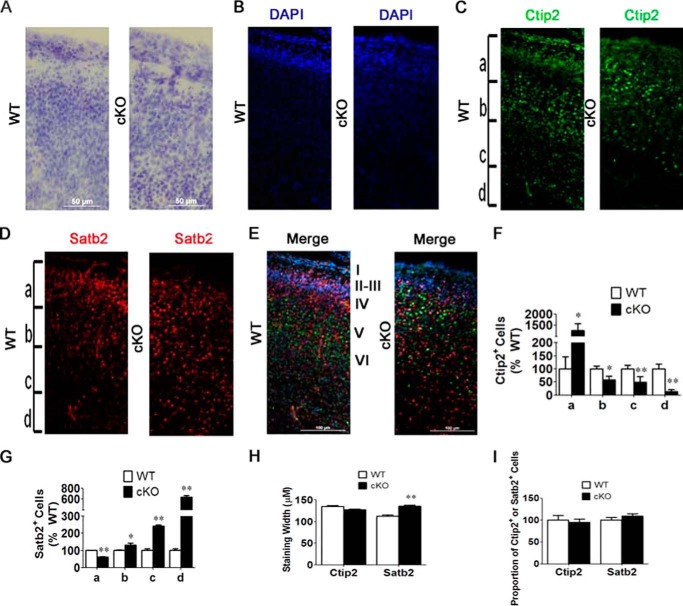
The neocortex in mammals is made up of six cellular layers, formed in an inside-out pattern, in which layer VI is formed first, whereas more superficial layers are formed later during brain development (19). Examination of cresyl violet-stained sections of Nes-Cre/HDAC3 cKO mice suggested abnormalities in the organization of cells (Fig. 2A). Furthermore, cresyl violet and DAPI staining showed a sharp reduction in the density of the cell-dense layer 2/3 in the mutant (Fig. 2, A and B). We therefore examined whether lamination of the cortex was normal in Nes-Cre/HDAC3 cKO mice using antibodies against Ctip2, which is expressed in deeper layer projecting neurons (layers V and VI, generated earlier), and Satb2, which is expressed in upper layer neurons (layers II-IV) (19, 20). In comparison with wild-type littermates, Ctip2 staining was found more superficially (Fig. 2, C and E), whereas Satb2 staining extended to deeper regions of the cortex (Fig. 2, D and E). Indeed, quantification of Ctip2- and Satb2-positive cells in subdivided sections along the width of the cortex (designated a–d) confirmed that there was a greater proportion of Ctip2-positive cells more superficially (Fig. 2F, a), whereas a greater proportion of Satb2-positive cells where found deeper within the cortex (Fig. 2G, d). The width of Ctip2-stained area of the cortex was similar in wild-type and mutant mice. In contrast, and consistent with the more diffuse localization pattern, the width of the Satb2-stained area was greater in the mutant mice (Fig. 2H). Although localizing in a broader pattern in the cKO cortex, the proportion of Satb2-positive cells was similar to the wild type (Fig. 2I). Similarly, the proportion of Ctip2-positive cells was not altered in the mutant (Fig. 2J). These results suggest that, although early born neurons behave normally, neurons generated later during cortical development fail to organize into a compact layer (Fig. 2, H and I). This conclusion is consistent with the absence of a well defined band of cells in layers II/III by cresyl violet and DAPI staining (Fig. 2, A and B).
FIGURE 2.
Knockdown of HDAC3 alters cellular organization in the anterior cortex. Immunohistochemical analysis of sagittal sections of cKO mice and wild-type littermates at P0 was performed using antibodies against Satb2 (a marker of layers II-IV), Ctip2 (a marker of layers V -VI), and Tbr1 (a marker of layers II and VI). The representative images shown here are from analogous sections of the anterior cortex in cKO and wild-type littermate mice (n = 4). A and B, cresyl violet- (A) and DAPI-stained (B) cells in the anterior cortex of cKO and wild-type littermate mice. Shown is a decreased density of cells in layer II/III in cKO compared with wild-type littermate mice. C, increased Ctip2 staining in superficial layers of cKO compared with wild-type littermate mice. D, increased Satb2 staining in the lower layers of the anterior cortex of cKO mice compared with wild-type littermate mice. E, merged image of Ctip2, Satb2, and DAPI staining shown in A, B, and C, respectively. F, quantification of Ctip2-positive cells in a subdivision of the cortex shown in Fig. 2A, including a–d. Ctip2-positive cells and DAPI-stained cells were counted in each, section and an analysis was conducted as described under “Experimental Procedures.” Shown are an increased proportion of Ctip2-positive cells of cKO mice compared with wild-type littermates (a) and a reduced proportion of Ctip2-positive cells of cKO mice compared with wild-type littermates (b–d). G, quantification of Satb2-positive cells in a subdivision of the anterior cortex shown in Fig. 2C, which included a–d. Data were analyzed as described under “Experimental Procedures.” Shown are a reduced proportion of Satb2-positive cells (a) and an increased proportion of Satb2-positive cells (b–d) in cKO mice compared with wild-type littermate controls. H, quantification of Satb2 and Ctip2 staining width. Shown is an increased Satb2 staining width (n = 4). I, quantification of total Ctip2- and Satb2-positive cells as a proportion of total cells as described under “Experimental Procedures.” Total cells quantified were stained by DAPI (n = 4). Values are mean ± S.E. *, p < 0.05; **, p < 0.01.
Previous studies have shown that Tbr1 knockout mice display a pattern of cellular organization similar to what we have detected in HDAC3 cKO mice, suggesting that the absence of HDAC3 might affect Tbr1 function (21). Normally, Tbr1 is expressed in select superficial and deep layer neurons, including layers II and V/VI, respectively (22). We found that the superficial Tbr1-positive band of cells was not well defined in the mutant, appearing more diffuse and merging with the deeper layer of Tbr1-positive cells that appeared to localize more superficially within the cortex (Fig. 3, A and B). Quantification of the overall proportion of Tbr1-positive cells revealed a significant reduction in Tbr1 in cKO mice compared with wild-type littermate controls (Fig. 3, C and D). Moreover, Western blot analysis showed a reduction in Tbr1 expression (Fig. 3E). These results confirm that HDAC3 plays an important role in regulating cortical cytoarchitecture and suggests that this role of HDAC3 involves Tbr1.
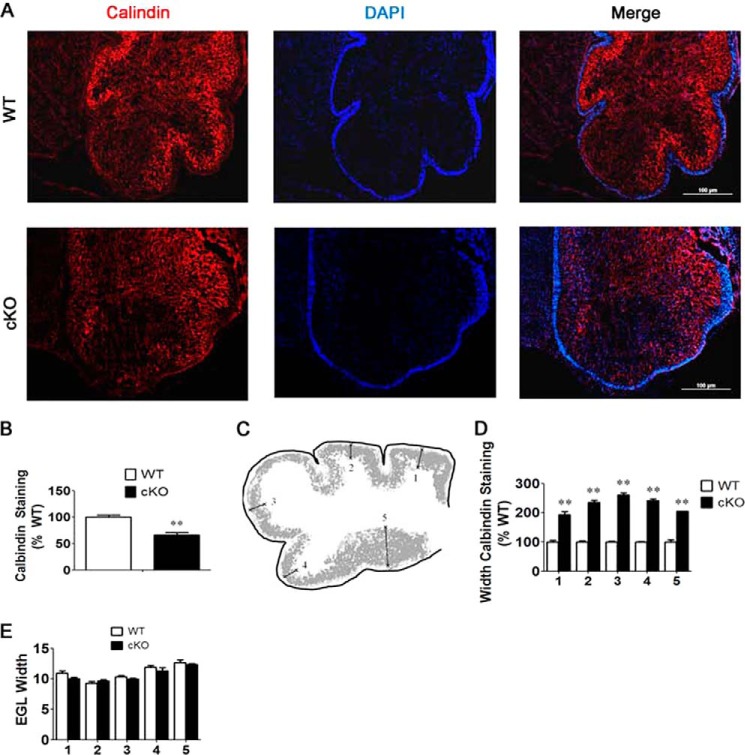
The underdeveloped folia also indicated cerebellar defects. To investigate this, we performed calbindin immunohistochemistry, which detects Purkinje neurons. An overall reduction in calbindin staining intensity was observed in the Nes-Cre/HDAC3 cKO cerebellum (Fig. 4, A and B). Moreover, although Purkinje neurons in the wild-type P0 cerebellum were coalescing into a band of cells, they were much more dispersed in the mutant (Fig. 4, A, C, and D). We also found that the width of the external granule layer of the cerebellum was not significantly modified in the mutant (Fig. 4E).
FIGURE 4.
Knockdown of HDAC3 disrupts the developing Purkinje cell layer. Shown is an immunohistochemical analysis of sagittal sections of Nes-Cre/HDAC3 cKO and wild-type littermates at P0. Representative images are shown of analogous sections of the cerebellum in Nes-Cre/HDAC3 cKO and wild-type mice (n = 4). A, calbindin staining pattern in cKO and wild-type cerebellum. Purkinje cells in cKO mice are more diffusely spread compared with wild-type littermates. B, quantification of calbindin staining intensity in whole cerebellum of cKO and wild-type mice. Shown is a decreased mean intensity of calbindin staining in cKO mice compared with wild-type littermate controls (n = 4). C, schematic of the cerebellar lobes and areas used for quantification of the widths of calbindin staining in Fig. 3D. D, quantification of the width of the calbindin staining derived from measurements of multiple lobes shown in Fig. 3C confirms the diffuse pattern of Purkinje neuron organization of cKO mice (n = 4). E, quantification of the width of the external granule layer (EGL) (n = 4). Values are mean ± S.E. **, p < 0.01.
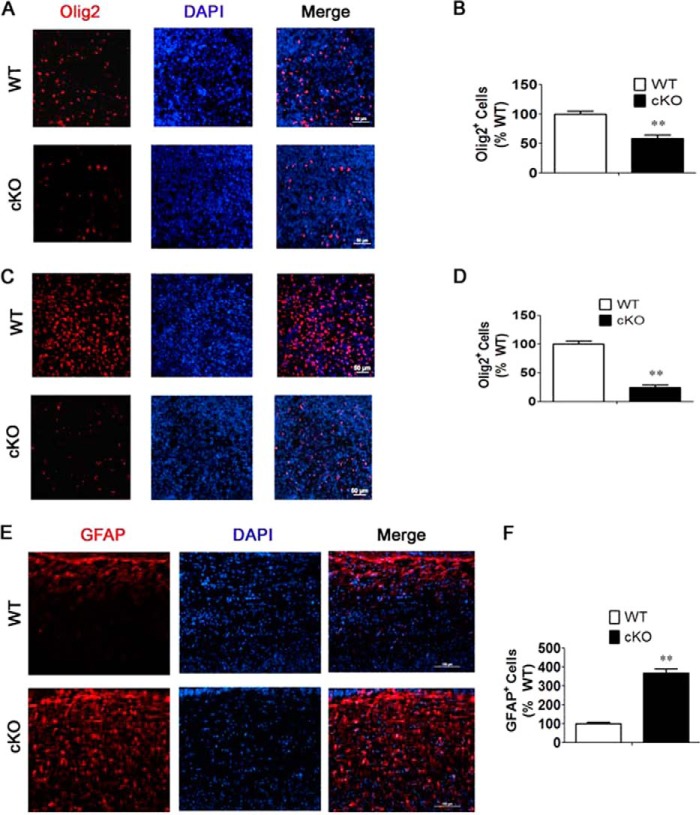
Because Nes-Cre-mediated ablation knocks out HDAC3 expression in astroglia and oligodendrocytes (but not in mesodermally derived microglia), we also examined the status of these glial cell types in the Nes-Cre/HDAC3 brain. Immunohistochemical analysis with Olig2 revealed a reduction in the proportion of oligodendrocytes both in the cortex and cerebellum (Fig. 5, A–D). GFAP is a commonly used marker for astrocytes. Although we were unable to detect significant GFAP staining in the P0 cortical plate or in the cerebellum of either wild-type or cKO mice, we observed robust staining in the medullae (Fig. 5, E and F). A comparison of staining in the medullae showed robust up-regulation in the number of astrocytes (Fig. 5, E and F). The disruption in the proportion of astrocytes and oligodendrocytes suggests a role for HDAC3 in the regulation of glial cell fate determination.
FIGURE 5.
HDAC3 ablation results in alterations in the proportion of glial cell types. An immunohistochemical analysis of sagittal brain sections from Nes-Cre/HDAC3 cKO mice and wild-type littermates at P0 was performed using antibodies against Olig2 (a marker for oligodendrocytes) and GFAP (a marker for astrocytes). A, Olig2 staining of oligodendrocytes in the anterior cortex shows a reduction in cKO mice compared with wild-type littermates. B, quantification of Olig2- and DAPI-stained cells in the anterior cortex reveals reduced proportion of Olig2-positive cells in cKO mice compared with wild-type littermates (n = 4). C, Olig2 staining in the cerebellum of cKO mice and wild-type littermates. D, quantification of Olig2- and DAPI-stained cells in the cerebellum reveals a reduction in the proportion of Olig2-positive cells in cKO mice compared with wild-type littermates (n = 4). E, GFAP staining in the brain stem shows an increase in HDAC3 cKO mice. F, quantification of GFAP and DAPI in the brain stem shows an increase in the proportion of GFAP in cKO mice compared with wild-type littermates (n = 4). Values are mean ± S.E. **, p < 0.01.
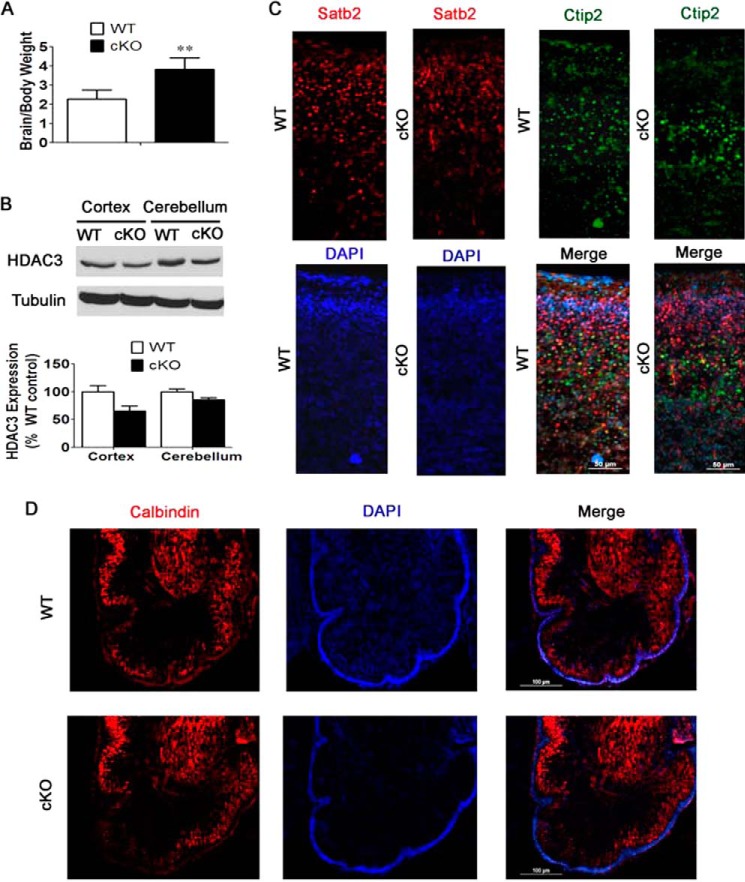
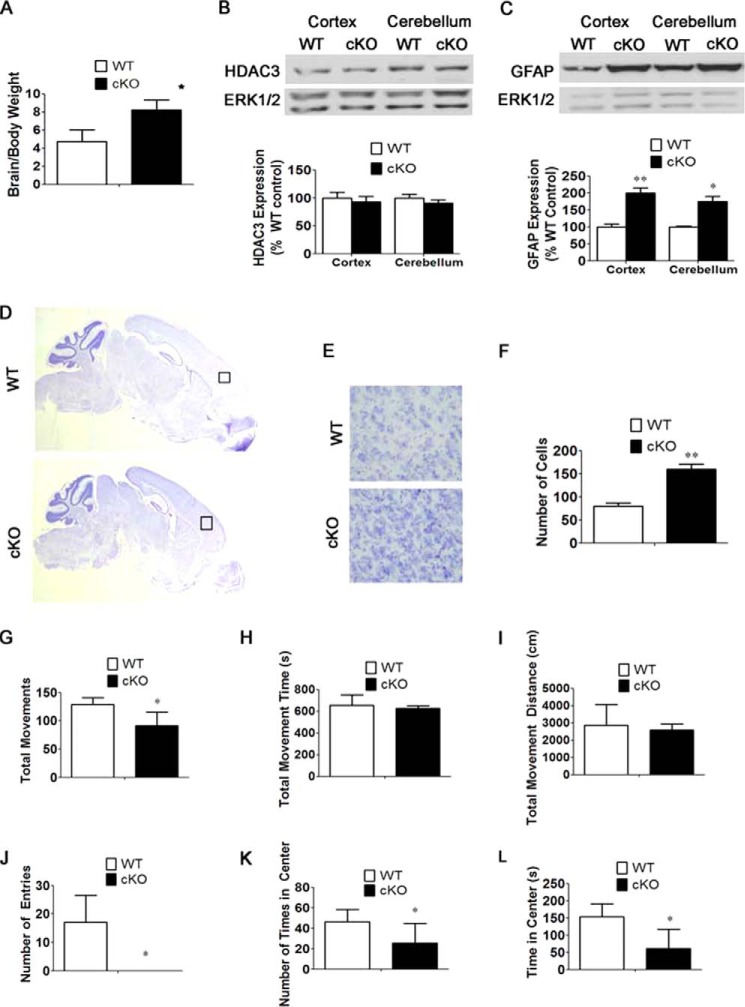
Because of the lethality of Nes-Cre/HDAC3 cKO mice immediately after birth and to focus attention on the effects of HDAC3 gene deletion in neurons, we generated HDAC3 cKO mice using the Thy1-Cre line for ablation. In Thy1-Cre mice, Cre is expressed in neurons of the forebrain prenatally and in specific neuronal populations in other brain regions, such as Purkinje neurons of the cerebellum, postnatally (15). Thy1-Cre/HDAC3 cKO mice were smaller at birth and remained smaller through the ∼6-week life span of these mice. Compared with body weight, however, the relative weight of the Thy1-Cre/HDAC3 cKO brain, lacking both HDAC3 alleles, was higher than that of wild-type littermates (Fig. 6A). Results from Western blot experiments confirmed a reduction in HDAC3 expression in the cortex and cerebellum of the mutant brain (Fig. 6B). The modest level of reduction suggests that HDAC3 is expressed highly in glial cells and that much of the expression seen in the protein lysates is derived from glia (Fig. 6B). Mice hemizygous for HDAC3 ablation did not display a discernible reduction in expression, nor did they exhibit any size or behavioral issues (data not shown).
FIGURE 6.
Preliminary characterization of Thy1-Cre/HDAC3 mice shows no obvious abnormalities in the structure or organization of cells in the cortex and cerebellum. A, brain-to-body weight ratios of 4-week-old Thy1-Cre/HDAC3 cKO mice and wild-type littermate mice. Shown are increased brain-to-body weight ratios of cKO mice compared with wild-type littermate controls (n = 4). B, Western blot analysis of Thy1-Cre/HDAC3 cKO mice confirms knockdown of HDAC3 in the cortex and cerebellum of cKO mice. Tubulin was used as a loading control (n = 4). C, immunohistochemical analysis of sagittal sections of cKO mice and wild-type littermates at P0 using antibodies against Satb2 (a marker of layers II-IV) and Ctip2 (a marker of layers V-VI) (n = 4). D, immunohistochemical analysis of sagittal sections of cerebellum in P0 cKO mice and wild-type littermate controls. Shown is similar calbindin staining of Purkinje cells in the cerebellum (n = 4). Values are mean ± S.E. **, p < 0.01.
In sharp contrast to the Nes-Cre/HDAC3 mice, in which cellular organization in the cortex is disrupted by HDAC3 ablation, the pattern of Satb2 and Ctip2 staining was normal in the cortex of Thy1-Cre/HDAC3 cKO mice at P0 (Fig. 6C). Likewise, the organization of Purkinje cells in the Thy1-Cre/HDAC3 cKO cerebellum appeared normal at P0 (Fig. 6D). Because the Thy1 promoter is turned on at around the same gestational period as the nestin promoter, this finding suggests that the cytoarchitectural abnormalities observed in the cortex and cerebellum of the Nes-Cre/HDAC3 cKO mice are a consequence of HDAC3 ablation in glial cells.
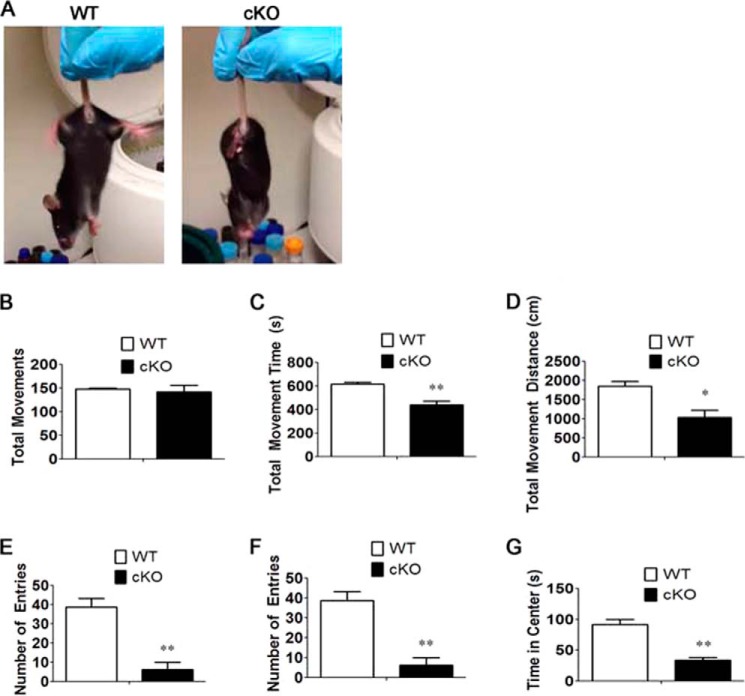
By 3 weeks of age, differences in physical appearance, such as an unkempt appearance and sunken eyes, were observed in Thy1-Cre/HDAC3 cKO mice (data not shown). Forepaw-clasping behavior was observed, suggesting neurological deficits (Fig. 7A). Open field locomotor tests confirmed motor deficits in the mutant (Fig. 7, B–G). Moreover, Thy1-Cre/HDAC3 cKO mice spent less time in the center of the field, which is generally regarded as a sign of increased anxiety (Fig. 7, F and G).
FIGURE 7.
Alteration in behavior and motor function in Thy1-Cre/HDAC3 mice. Appearance and locomotor activity were examined at 4 weeks of age and compared with wild-type littermates. A, a Thy1-Cre/HDAC3 cKO mouse and a wild-type littermate showing cKO mouse clasping behavior. B–G, quantification of the behavior observed during open field testing for 15 min. The graphs represent averages of HDAC3 cKO mice and wild-type littermate controls at 4 weeks of age (n = 4). Values are mean ± S.E. *, p < 0.05; **, p < 0.01.
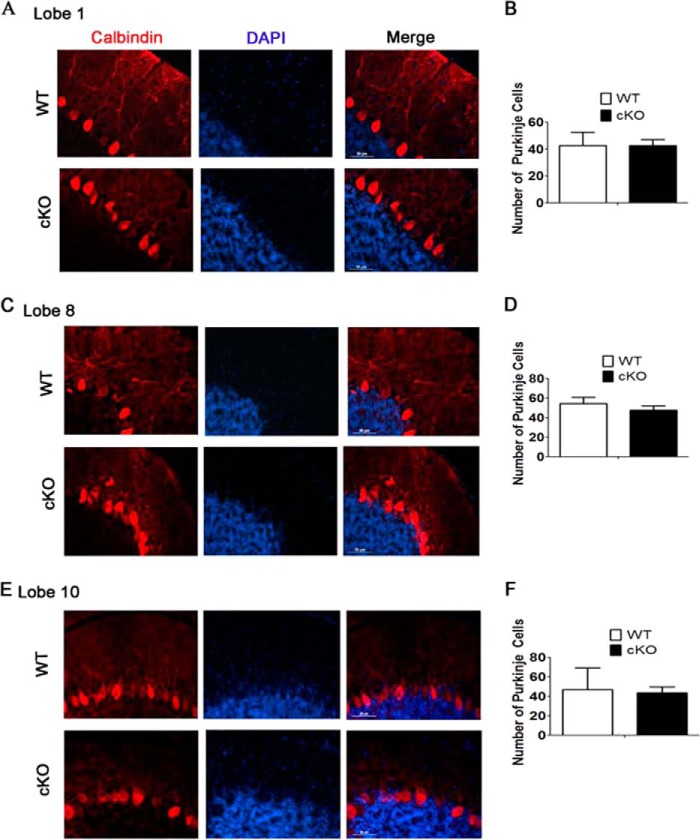
Purkinje neurons are organized in a single cell layer within the cerebellar cortex and extend highly branched dendrites by 3 weeks of age. Consistent with defects in motor function, a substantial portion of the Purkinje neurons in Thy1-Cre/HDAC3 mice displayed severely shrunken soma with stunted dendritic arborization (Fig. 8, A–F). Moreover, gaps in the Purkinje cell monolayer were observed, particularly in the posterior lobes (Fig. 8E). The atrophic soma, along with the gaps at 3 weeks in addition to the normal appearance of these cells at P0, suggested that Purkinje cells were lost in the mutant over the course of the first 3 weeks. Quantification experiments demonstrated a modest but not significant reduction in the number of Purkinje neurons in Thy1-Cre/HDAC3 cKO mice (Fig. 8, B, D, and F).
FIGURE 8.
Stunted dendritic arborization and atrophic soma in Purkinje cells in Thy1-Cre/HDAC3 mice. Results of an immunohistological analysis with calbindin and quantification of Purkinje cells at 4 weeks of age are shown. A and B, lobe 1. C and D, lobe 8. E and F, lobe 10. Values are mean ± S.E. (n = 4, not significant).
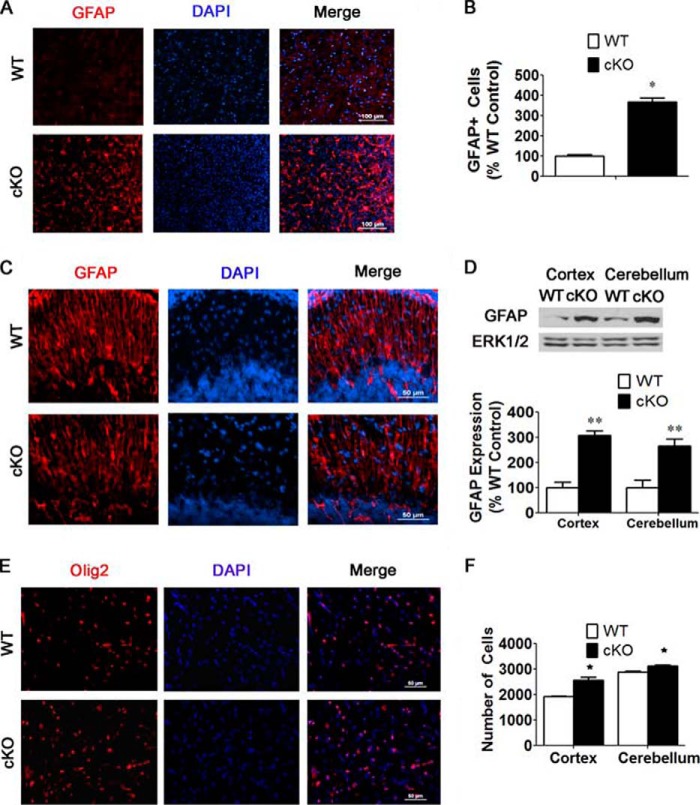
As observed in Nes-Cre/HDAC3 cKO mice, the proportion of GFAP-positive cells was higher in Thy1-Cre/HDAC3 brains both in the cortex and cerebellum (Fig. 9, A–C). Western blot analysis confirmed the increase in GFAP expression (Fig. 9D). Although increased in number, the fibers of the Bergman glial cells in the cKO cerebellum were not as smooth in appearance as those in the wild type (Fig. 9C). Immunohistochemical analysis with Olig2 revealed similar expression in the cortex (Fig. 9E). In contrast to Nes-Cre/HDAC3 mice, there was a slight increase in density of cells in both the cortex and cerebellum of Thy1-Cre/HDAC3 mice (Fig. 9F).
FIGURE 9.
Increased GFAP-positive cells in Thy1-Cre/HDAC3 mice. A, increase in GFAP staining in analogous sagittal sections of the anterior cortex of cKO mice and wild-type littermate controls at 4 weeks of age. B, quantification of GFAP-positive cells in the anterior cortex of cKO mice and wild-type littermate controls as described under “Experimental Procedures.” Shown is an increased proportion of GFAP-positive cells in cKO mice compared with wild-type littermate controls (n = 4). C, GFAP staining in analogous sagittal sections of the cerebellum of cKO mice and wild-type littermate controls. D, Western blot analysis of GFAP showing increased GFAP expression in the cortex and cerebellum of cKO mice at 4 weeks of age. ERK1/2 was used as a loading control (n = 4). E, Olig2 staining of oligodendrocytes in the cortex (n = 4). F, quantification of DAPI-stained cells as described under “Experimental Procedures.” Shown are increased numbers of DAPI cells in cKO mice compared with wild-type littermate controls (n = 4). Values are mean ± S.E. *, p < 0.05; **, p < 0.01.
The increased expression of GFAP in the Thy1-Cre/HDAC3 cKO raised the intriguing possibility that ablation of HDAC3 in neurons indirectly affected astrocytes. To confirm this result, we generated HDAC3 cKO mice using CaMKII-Cre. The CaMK promoter in this particular mouse line expresses Cre in neurons of the forebrain as well as other brain regions, including the cerebellum (23). Similar to Thy1-Cre/HDAC3 cKO mice, compared with body weight, the relative weight of the brain of the CaMKII-Cre/HDAC3 cKO mice was higher than that of wild-type littermates (Fig. 10A). Results from Western blot experiments confirmed a small reduction in HDAC3 expression in the cortex and cerebellum of mutant mice (Fig. 10B). The modest reduction in expression in both the Thy1-Cre and CaMK-Cre-driven HDAC3 cKO lines supports the conclusion that most HDAC3 in the brain is produced in glial cells. As observed in Thy1-Cre/HDAC3 cKO mice, there was an increase in GFAP expression in both the cortex and cerebellum of CaMKII-Cre/HDAC3 mice (Fig. 10C). The small increase in overall cell numbers in the cortex, as judged by DAPI staining in Thy1-Cre/HDAC3 cKO mice, was also observed in CaMKII-Cre/HDAC3 mice (Fig. 10, D–F). Similarly, other major abnormalities observed in Thy1-Cre/HDAC3 mice, including neurological deficits such as hind limb paralysis and ataxia as well as the atrophy of Purkinje cell and death at around 6 weeks of age, were also observed in CaMKII-Cre/HDAC3 mice (data not shown). Furthermore, these mice displayed motor deficits in the open field locomotor test (Fig. 10, G–L) and spent less time in the center of the field (Fig. 10, K and L).
FIGURE 10.
Effects of HDAC3 ablation in CaMK11-Cre/HDAC3 mice. A, brain-to-body weight ratios of 4-week-old CaMKII-Cre/HDAC3 cKO mice and wild-type mice. Shown are increased brain-to-body weight ratios of cKO mice compared with wild-type littermate controls (n = 4). B and C, Western blot analyses of CaMKII-Cre/HDAC3 cKO and wild-type littermate mice confirms knockdown of HDAC3 and increased GFAP expression in the cortex and cerebellum of cKO mice. ERK1/2 was used as a loading control. D, histological analysis of CaMKII-Cre/HDAC3 cKO and control wild-type littermate mice. Analogous sagittal sections from 3-week-old CaMKII-Cre/HDAC3 wild-type mice and cKO littermates were stained with cresyl violet. E, higher magnification of the brain region in D, indicated by a black box. A higher cell density was observed in cKO mice compared with wild-type littermates. F, quantification of cell density in the brain region in D (n = 4). G—L, quantification of behavior observed during open field testing. The graphs represent averages of HDAC3 cKO mice and wild-type littermate controls tested at 3 weeks of age (n = 4). Values are mean ± S.E. *, p < 0.05; **, p < 0.01.
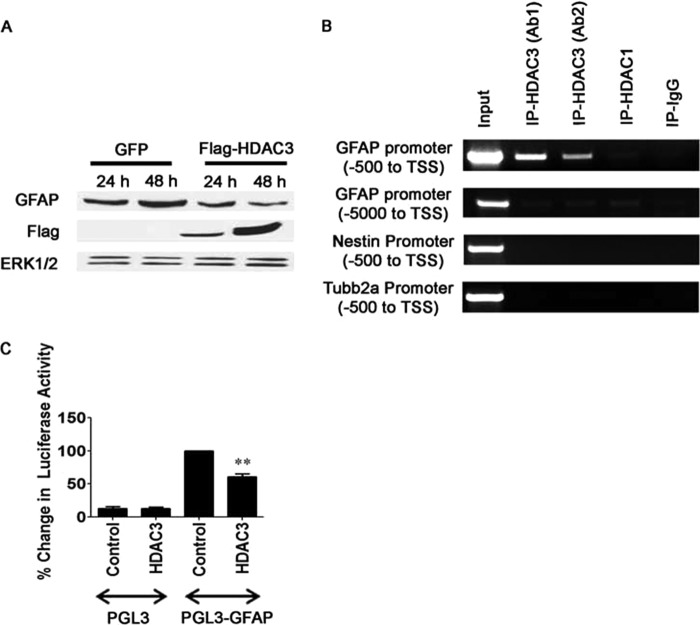
To examine whether the effect of HDAC3 on GFAP expression occurred because of HDAC3 activity in glial cells, we utilized the U251 glioblastoma line. As shown in Fig. 11A, overexpression of HDAC3 in these glial cells resulted in a suppression of GFAP expression. Furthermore, a ChIP analysis performed with two separate HDAC3 antibodies revealed the association of HDAC3 with the GFAP gene promoter, suggesting that the suppression of GFAP expression is transcriptionally mediated (Fig. 11B). Further confirming this possibility, we found that overexpression of HDAC3 significantly decreased GFAP promoter activity in HEK 293 cells (Fig. 11C).
FIGURE 11.
HDAC3 regulates GFAP expression and interacts with the GFAP promoter in glial cells. A, glioblastoma U251 cells were transfected with HDAC3-FLAG or a GFP-encoding plasmid, and expression was analyzed 24 and 48 h later by Western blotting using a GFAP antibody. ERK1/2 was used as a loading control (n = 3). B, ChIP analysis examining the binding of HDAC3 to the GFAP promoter in U251 glioblastoma cells. Primers to an upstream region of the GFAP promoter (around −5000 bp) were used as a negative control. To show the specificity of HDAC3 binding at the GFAP promoter only, primer pairs targeted against nestin and Tubb2a gene promoters were used (n = 3). C, luciferase activity assay examining the change in GFAP promoter activity when HDAC3 is overexpressed. HEK293 cells were cotransfected with the pcDNA3.1 FLAG-HDAC3 and hGFAP-Luc vectors, which contain the human GFAP promoter, for 48 h (n = 4). Values are mean ± S.E. **, p < 0.01.
DISCUSSION
In the context of the nervous system, research on HDACs has mainly focused on their role in promoting neurodegeneration. Chemical inhibitors of classical HDACs protect against neuronal death in various invertebrate and rodent models of neurodegenerative disease. Because the inhibitors used are not selective, however, the identity of the neurotoxic HDAC or HDACs targeted by these inhibitors to afford neuroprotection has been unresolved. Moreover, some HDAC proteins, including HDAC1, HDAC4, HDAC6, HDAC7, and HDRP (a truncated form of HDAC9 lacking the deacetylase domain), protect neurons against degeneration. In contrast to the neuroprotective effects of these HDACs, we recently described that HDAC3 can promote neuronal death (9). This neuronal death-promoting activity of HDAC3 is stimulated by its phosphorylation by GSK3β, disassociation from Htt, and association with HDAC1 (9).
Although neurotoxic when modified by GSK3β phosphorylation, HDAC3 is highly expressed in the developing brain, where its role is unknown. We show that HDAC3 plays an essential role in normal brain development. When deleted from neuronal progenitor cells of the CNS, the organization of cells within both the cortex and cerebellum is disrupted. Within the cortex, the localization of cells in the superficial layers is much more diffuse. Our results suggest that migration of late-developing cells is selectively disrupted by the absence of HDAC3. Although the mechanisms involved are not clear, we propose that HDAC3 affects Tbr, a protein known to be important in specifying laminar identity (21). We found a robust reduction in Tbr1 expression and a reduction of Tbr1-positive neurons in the Nes-Cre/HDAC3 cKO cortex. Whether this involves the maintenance of Tbr1 expression or the proper generation of Tbr1-positive neurons (or both) is not clear. The remaining Tbr1-positive cells show an abnormal organization with the superficial band of Tbr1 cells merging with the deeper band. The overall similarity in the laminar abnormalities between Nes-Cre/HDAC3 cKO mice and Tbr1-deficient mice is consistent with the conclusion that HDAC3 acts through Tbr1 (21).
We found that HDAC3 deletion in neural progenitor cells results in an increase in astrocytes with a reduction in the proportion of oligodendrocytes. Therefore, in addition to regulating the lamination of late-developing neurons, HDAC3 is likely to control glial cell fate. Preliminary results suggesting this possibility have been reported recently by another laboratory.4 Interestingly, overexpression of Tbr1 in the developing olfactory bulb results in an overproduction of neurons and oligodendrocytes with a reduction in the number of astrocytes (24).
Intriguingly, the increase in the production of astrocytes is also observed in Thy1-Cre/HDAC3 and CaMKII-Cre/HDAC3 cKO mice, where the ablation of HDAC3 is restricted to neurons. In contrast, there is no increase in microglia (data not shown), ruling out the possibility that the increase in astrocytes is part of an inflammatory response. Although the mechanism for how neuron-specific ablation of HDAC3 affects glia remains to be determined, we find that HDAC3 represses GFAP expression when overexpressed in glial cells. ChIP analysis reveals HDAC3 interaction with the GFAP gene promoter, and results from luciferase activity assays indicate HDAC3 can regulate the activity of the GFAP promoter, suggesting that HDAC3 acts at the transcriptional level.
In addition to the molecular and cellular abnormalities resulting from HDAC3 deletion, both the Thy1-Cre/HDAC3 and CaMKII-Cre/HDAC3 cKO lines display severe neurological deficits, including forepaw clasping, ataxia, and hind limb paralysis, and die early. These effects are not due to abnormalities in lamination within the cortex, which is normal in both Thy1-Cre/HDAC3 and CaMKII-Cre/HDAC3 cKO mice. Cerebellar abnormalities, including loss of Purkinje neurons, are likely to contribute to the neurological deficits. The effects on the maintenance of Purkinje neuron morphology and numbers well after birth suggests that the role of HDAC1 in brain development is not restricted to the prenatal period. A more detailed characterization of the cellular and molecular abnormalities in these two HDAC3 cKO lines is necessary to understand the causes of the postnatal neurological impairments.
In summary, on the basis of analyses of three separate cKO lines, we report that HDAC3 plays an essential in brain development. Our results suggest multiple roles for HDAC3, including regulation of proper neuronal lamination in the cortex, regulation of glial cell fate, and cerebellar development both prenatally and postnatally. Knockout and cKO mice lacking several other HDACs have been generated previously. To our knowledge, none of these display major neurodevelopmental abnormalities. Double knockouts lacking both the HDAC1 and HDAC2 genes do display severe neurological defects, but these can be almost completely eliminated by a single allele of one of these two HDACs (5). On the basis of these observations, it appears that HDAC3 is particularly important for brain development and that other members of the HDAC family cannot compensate for its function.
Acknowledgments
We thank Eric N. Olson and Rhonda Bassel-Duby at the University of Texas Southwestern Medical Center for the HDAC3lox/lox mice and for providing feedback on this manuscript and Lisa Monteggia at the University of Texas Southwestern Medical Center for the CaMKII-Cre mice. We also thank Lulu Wang for technical assistance.
This work was supported, in whole or in part, by National Institutes of Health Grants NS40408 and NS058462.
R. Q. Lu, Y. Yu, Y. Chen, B. Kim, and C. Zhao, poster presented at the Society for Neuroscience Meeting, New Orleans, LA (October 13–17, 2012).
- HDAC
- histone deacetylase
- cKO
- conditional knockout
- Nes-Cre
- Nestin-Cre
- CaMKII-Cre
- calcium/calmodulin-dependent protein kinase II α-Cre
- GFAP
- glial fibrillary acidic protein
- P0
- postnatal day 0
- TSS
- transcription start site.
REFERENCES
- 1. Yang X. J., Seto E. (2008) The Rpd3/Hda1 family of lysine deacetylases: from bacteria and yeast to mice and men. Nat. Rev. Mol. Cell Biol. 9, 206–218 [DOI] [PMC free article] [PubMed] [Google Scholar]
- 2. Haberland M., Montgomery R. L., Olson E. N. (2009) The many roles of histone deacetylases in development and physiology: implications for disease and therapy. Nat. Rev. Genet. 10, 32–42 [DOI] [PMC free article] [PubMed] [Google Scholar]
- 3. Broide R. S., Redwine J. M., Aftahi N., Young W., Bloom F. E., Winrow C. J. (2007) Distribution of histone deacetylases 1–11 in the rat brain. J. Mol. Neurosci. 31, 47–58 [DOI] [PubMed] [Google Scholar]
- 4. Morris M. J., Monteggia L. M. (2013) Unique functional roles for class I and class II histone deacetylases in central nervous system development and function. Int. J. Dev. Neurosci. 31, 370–381 [DOI] [PMC free article] [PubMed] [Google Scholar]
- 5. Montgomery R. L., Hsieh J., Barbosa A. C., Richardson J. A., Olson E. N. (2009) Histone deacetylases 1 and 2 control the progression of neural precursors to neurons during brain development. Proc. Natl. Acad. Sci. U.S.A. 106, 7876–7881 [DOI] [PMC free article] [PubMed] [Google Scholar]
- 6. Chen Y., Wang H., Yoon S. O., Xu X., Hottiger M. O., Svaren J., Nave K. A., Kim H. A., Olson E. N., Lu Q. R. (2011) HDAC-mediated deacetylation of NF-κB is critical for Schwann cell myelination. Nat. Neurosci. 14, 437–441 [DOI] [PMC free article] [PubMed] [Google Scholar]
- 7. Jacob C., Christen C. N., Pereira J. A., Somandin C., Baggiolini A., Lötscher P., Ozçelik M., Tricaud N., Meijer D., Yamaguchi T., Matthias P., Suter U. (2011) HDAC1 and HDAC2 control the transcriptional program of myelination and the survival of Schwann cells. Nat. Neurosci. 14, 429–436 [DOI] [PubMed] [Google Scholar]
- 8. Ye F., Chen Y., Hoang T., Montgomery R. L., Zhao X. H., Bu H., Hu T., Taketo M. M., van Es J. H., Clevers H., Hsieh J., Bassel-Duby R., Olson E. N., Lu Q. R. (2009) HDAC1 and HDAC2 regulate oligodendrocyte differentiation by disrupting the β-catenin-TCF interaction. Nat. Neurosci. 12, 829–838 [DOI] [PMC free article] [PubMed] [Google Scholar]
- 9. Bardai F. H., D'Mello S. R. (2011) Selective toxicity by HDAC3 in neurons: regulation by Akt and GSK3β. J. Neurosci. 31, 1746–1751 [DOI] [PMC free article] [PubMed] [Google Scholar]
- 10. Bardai F. H., Price V., Zaayman M., Wang L., D'Mello S. R. (2012) Histone deacetylase-1 (HDAC1) is a molecular switch between neuronal survival and death. J. Biol. Chem. 287, 35444–35453 [DOI] [PMC free article] [PubMed] [Google Scholar]
- 11. Bardai F. H., Verma P., Smith C., Rawat V., Wang L., D'Mello S. R. (2013) Disassociation of histone deacetylase-3 from normal huntingtin underlies mutant huntingtin neurotoxicity. J. Neurosci. 33, 11833–11838 [DOI] [PMC free article] [PubMed] [Google Scholar]
- 12. Montgomery R. L., Potthoff M. J., Haberland M., Qi X., Matsuzaki S., Humphries K. M., Richardson J. A., Bassel-Duby R., Olson E. N. (2008) Maintenance of cardiac energy metabolism by histone deacetylase 3 in mice. J. Clin. Invest. 118, 3588–3597 [DOI] [PMC free article] [PubMed] [Google Scholar]
- 13. Kim M. S., Akhtar M. W., Adachi M., Mahgoub M., Bassel-Duby R., Kavalali E. T., Olson E. N., Monteggia L. M. (2012) An essential role for histone deacetylase 4 in synaptic plasticity and memory formation. J. Neurosci. 32, 10879–10886 [DOI] [PMC free article] [PubMed] [Google Scholar]
- 14. Tronche F., Kellendonk C., Kretz O., Gass P., Anlag K., Orban P. C., Bock R., Klein R., Schütz G. (1999) Disruption of the glucocorticoid receptor gene in the nervous system results in reduced anxiety. Nat. Genet. 23, 99–103 [DOI] [PubMed] [Google Scholar]
- 15. Dewachter I., Reversé D., Caluwaerts N., Ris L., Kuipéri C., Van den Haute C., Spittaels K., Umans L., Serneels L., Thiry E., Moechars D., Mercken M., Godaux E., Van Leuven F. (2002) Neuronal deficiency of presenilin 1 inhibits amyloid plaque formation and corrects hippocampal long-term potentiation but not a cognitive defect of amyloid precursor protein [V717I] transgenic mice. J. Neurosci. 22, 3445–3453 [DOI] [PMC free article] [PubMed] [Google Scholar]
- 16. Chin P. C., Liu L., Morrison B. E., Siddiq A., Ratan R. R., Bottiglieri T., D'Mello S. R. (2004) The c-Raf inhibitor GW5074 provides neuroprotection in vitro and in an animal model of neurodegeneration through a MEK-ERK and Akt-independent mechanism. J. Neurochem. 90, 595–608 [DOI] [PubMed] [Google Scholar]
- 17. Price V., Wang L., D'Mello S. R. (2013) Conditional deletion of histone deacetylase-4 in the central nervous system has no major effect on brain architecture or neuronal viability. J. Neurosci. Res. 91, 407–415 [DOI] [PMC free article] [PubMed] [Google Scholar]
- 18. Cvetanovic M., Patel J. M., Marti H. H., Kini A. R., Opal P. (2011) Vascular endothelial growth factor ameliorates the ataxic phenotype in a mouse model of spinocerebellar ataxia type 1. Nat. Med. 17, 1445–1447 [DOI] [PMC free article] [PubMed] [Google Scholar]
- 19. Hevner R. F. (2007) Layer-specific markers as probes for neuron type identity in human neocortex and malformations of cortical development. J. Neuropathol. Exp. Neurol. 66, 101–109 [DOI] [PubMed] [Google Scholar]
- 20. Arnold S. J., Huang G. J., Cheung A. F., Era T., Nishikawa S., Bikoff E. K., Molnár Z., Robertson E. J., Groszer M. (2008) The T-box transcription factor Eomes/Tbr2 regulates neurogenesis in the cortical subventricular zone. Genes Dev. 22, 2479–2484 [DOI] [PMC free article] [PubMed] [Google Scholar]
- 21. Kwan K. Y., Sestan N., Anton E. S. (2012) Transcriptional co-regulation of neuronal migration and laminar identity in the neocortex. Development 139, 1535–1546 [DOI] [PMC free article] [PubMed] [Google Scholar]
- 22. Hevner R. F., Shi L., Justice N., Hsueh Y., Sheng M., Smiga S., Bulfone A., Goffinet A. M., Campagnoni A. T., Rubenstein J. L. (2001) Tbr1 regulates differentiation of the preplate and layer 6. Neuron. 29, 353–366 [DOI] [PubMed] [Google Scholar]
- 23. Luikart B. W., Nef S., Virmani T., Lush M. E., Liu Y., Kavalali E. T., Parada L. F. (2005) TrkB has a cell-autonomous role in the establishment of hippocampal Schaffer collateral synapses. J. Neurosci. 25, 3774–3786 [DOI] [PMC free article] [PubMed] [Google Scholar]
- 24. Méndez-Gómez H. R., Vergaño-Vera E., Abad J. L., Bulfone A., Moratalla R., de Pablo F., Vicario-Abejón C. (2011) The T-box brain 1 (Tbr1) transcription factor inhibits astrocyte formation in the olfactory bulb and regulates neural stem cell fate. Mol. Cell Neurosci. 46, 108–121 [DOI] [PubMed] [Google Scholar]


