

Background: NPM1 is a nucleolar histone chaperone mutated in cancer.
Results: NPM1-deficient cells display rearrangement of perinucleolar heterochromatin, and simultaneous knockdown of NPM1 and DNMT3A enhances transcription of ribosomal DNA.
Conclusion: NPM1 loss disrupts heterochromatin organization around the nucleolus.
Significance: Rearrangement of heterochromatin in NPM1-deficient cells may be of importance in tumor development.
Keywords: DNA Methyltransferase, Heterochromatin, Histone, Histone Chaperone, Histone Modification, Nucleolus, p53, Ribosome Assembly
Abstract
Nucleoli are prominent nuclear structures assembled and organized around actively transcribed ribosomal DNA (rDNA). The nucleolus has emerged as a platform for the organization of chromatin enriched for repressive histone modifications associated with repetitive DNA. NPM1 is a nucleolar protein required for the maintenance of genome stability. However, the role of NPM1 in nucleolar chromatin dynamics and ribosome biogenesis remains unclear. We found that normal fibroblasts and cancer cells depleted of NPM1 displayed deformed nucleoli and a striking rearrangement of perinucleolar heterochromatin, as identified by immunofluorescence staining of trimethylated H3K9, trimethylated H3K27, and heterochromatin protein 1γ (HP1γ/CBX3). By co-immunoprecipitation we found NPM1 associated with HP1γ and core and linker histones. Moreover, NPM1 was required for efficient tethering of HP1γ-enriched chromatin to the nucleolus. We next tested whether the alterations in perinucleolar heterochromatin architecture correlated with a difference in the regulation of rDNA. U1242MG glioma cells depleted of NPM1 presented with altered silver staining of nucleolar organizer regions, coupled to a modest decrease in H3K9 di- and trimethylation at the rDNA promoter. rDNA transcription and cell proliferation were sustained in these cells, indicating that altered organization of heterochromatin was not secondary to inhibition of rDNA transcription. Furthermore, knockdown of DNA methyltransferase DNMT3A markedly enhanced rDNA transcription in NPM1-depleted U1242MG cells. In summary, this study highlights a function of NPM1 in the spatial organization of nucleolus-associated heterochromatin.
Introduction
Nucleoli are the non-membrane-surrounded intranuclear sites of ribosome biogenesis that harbor copies of the ribosomal RNA (rRNA) gene. The ribosomal DNA (rDNA) is arranged in the form of tandemly arranged repeats at the chromosomal nucleolar organizer regions (NORs)3 located on the short p arms of the five acrocentric chromosomes in humans, chromosomes 13, 14, 15, 21, and 22. The diploid human genome contains around 300–400 copies of the 43-kb rDNA unit (1). Each rDNA unit consists of ∼13.3 kb of sequence encoding the 28S, 5.8S, and 18S rRNAs, and a non-coding intergenic spacer that harbors an enhancer, a spacer promoter, and the core promoter of the rDNA unit (2). Not all rDNA units are active, and up to 50% remain epigenetically silenced in normal human cells (1, 2). Upon initiation of rDNA transcription by RNA pol I, additional proteins and RNA molecules are rapidly recruited to the growing nucleolus. The fully mature nucleolus can be subdivided into three distinct compartments known as the fibrillar center (FC), the dense fibrillar component (DFC), and the granular component (GC). Although still a matter of debate, the prevailing view is that pre-rRNA is transcribed from rDNA at the border between the FC and the DFC. The FC is enriched in components of the RNA pol I machinery, such as the transcription factor UBF, whereas the DFC harbors various RNA-modifying enzymes and pre-rRNA processing factors including fibrillarin (3, 4). Surrounding the FC and the DFC is the GC, where pre-ribosome subunit assembly takes place (3, 4). Immediately juxtaposed to the GC is a shell of perinucleolar heterochromatin composed of silent rDNA, repetitive satellite DNA on centric or pericentric chromatin, and heterochromatic regions from non-NOR-bearing chromosomes (5). The formation and spatial organization of heterochromatin around the nucleolus is of importance for the overall stability of the genome (5–9). It is therefore vital to understand the processes involved in structural maintenance of the nucleoli in relation to the organization of chromatin and vice versa.
An abundant nucleolar protein enriched in the GC is NPM1 (also known as B23 or nucleophosmin). NPM1 is essential for the normal development of the mouse embryo and for the stability of the genome (10, 11). Npm1−/− mice display aberrant organogenesis and die between embryonic day E11.5 and E16.5 due to anemia. Npm1 is haplo-insufficient for tumor suppression in hematopoietic cells, and allelic loss results in aneuploidy, increased centrosome numbers, and DNA damage checkpoint activation in these cells (11–13). NPM1 is involved in various cellular processes including centrosome duplication, mRNA splicing, ribosome biogenesis, and apoptosis (14). NPM1 interacts directly with many cellular proteins including the p53 tumor suppressor, MDM2, and ARF (15–17). p53 is normally active in the nucleus as a transcription factor and is polyubiquitinated by the MDM2 ubiquitin E3 ligase, a modification that triggers its proteasome-dependent degradation (18). ARF is a nucleolar protein that binds and antagonizes MDM2 ubiquitin ligase activity for p53 (19, 20). In turn, NPM1 binds and co-localizes with ARF and protects it from degradation (21). Thus, in the absence of NPM1, ARF is unstable and is less effective in activating p53 (10, 22). NPM1 may promote oncogenesis by interfering with the activation of p53 by ARF (10, 22). On the other hand, NPM1 regulates turnover of c-Myc by acting on the F-box protein Fbw7γ, a component of the E3 ligase complex involved in the ubiquitination and proteasome degradation of c-Myc (23) with the consequence that loss of NPM1 stabilizes c-Myc.
NPM1 may act as a histone chaperone in the nucleolus, as it binds histones and assembles nucleosomes in vitro (24, 25), but the role of NPM1 in chromatin dynamics and ribosome biogenesis remains poorly understood. We designed a series of experiments to better understand the role of NPM1 in the nucleolus, in particular, how altered levels of NPM1 may affect the nucleolar chromatin including the rRNA genes. We found that cells lacking NPM1 displayed one important difference with respect to wild type cells: a profound alteration in the architecture of perinucleolar heterochromatin. In support, we could show that NPM1 associated with components of chromatin including linker histone H1.5 and heterochromatin protein HP1γ. Moreover, NPM1 was required for perinucleolar tethering of HP1γ-stained chromatin foci. In this context, NPM1 was dispensable for ribosome biogenesis. Only minor changes in rDNA transcription were detected in NPM1-depleted cells, but silencing of the DNA methyltransferase DNMT3A synergized with loss of NPM1 to drive rDNA transcription.
EXPERIMENTAL PROCEDURES
Cell Cultures
Osteosarcoma cell line U2OS (wild type, WT p53) was purchased from ATCC (Manassas, VA). Glioma cell line U1242MG (mutant p53) was maintained in our laboratory and has been described (26). Glioma cell line U343MGa Cl2:6 (WT p53) has also been described and characterized (27). Normal human diploid dermal fibroblasts (NHDF-c, lot 1×0083002.2) derived from juvenile foreskin were purchased from Promocell (Heidelberg, Germany). p53−/− and p53−/−,Npm1−/− mouse embryo fibroblasts were provided by O. Sangfelt (Karolinska Institutet, Stockholm) and were originally a gift from E. Colombo (10). WT mouse embryo fibroblasts (PMEF-CFL, lot 2137256-1) were from Millipore (Billerica, MA). Cells were cultured in Iscove's modified Dulbecco's medium containing 10% fetal bovine serum, antibiotics (100 μg of penicillin and 50 μg of streptomycin sulfate/ml), and 2 mm glutamine at 37 °C, 5% CO2.
Cell Proliferation Assay
U2OS and U1242MG cells were transfected with siRNAs at day 0 (0 h) and day 4 (96 h) with a split of cells at day 3 (72 h). At day 6 the cells were split again and seeded in 6-well cell culture dishes in triplicates at a density of 20,000 cells/well in 2 ml of complete medium. Cells were counted using a hemocytometer, and cell numbers were determined at the indicated time points. The mean and standard deviation at each time point were obtained from a triplicate experiment. In the case of normal human diploid fibroblasts (HDFs) we determined the cell numbers at days 4 (96 h), 7, and 10 following siRNA transfection at day 0 (0 h). The number of cells in control siRNA (siCtrl) cultures was set to 100% in each case, and the percentage of cells in siNPM1-treated cultures relative to siCtrl is given.
Chemicals
Chemicals were purchased from Sigma-Aldrich. The drugs and their respective stock solutions, stored at −20 °C, were as follows: actinomycin D (1 mm in DMSO), Nutlin-3 (10 mm, DMSO), and 5-fluorouracil (25 mm, DMSO). The final working concentrations of the drugs are given in Figure 1 legend.
FIGURE 1.

NPM1 depletion alters nucleolar morphology. A, phase-contrast (P.C) images of U1242MG cells reveal the morphology of nucleoli in cells transfected with different siRNAs that target NPM1. A number of validated NPM1 siRNAs were used including siNPM1-1 and siNPM1-2. The On-Target SMARTpool NPM1 siRNA was denoted siNPM1. Depletion of NPM1 resulted in deformation of the normally round and phase-dense nucleoli into nonsymmetrical nucleoli with reduced phase contrast. The white arrowheads point at nucleoli in some selected cells. Magnification, ×20. B, U2OS cells were transfected with siCtrl or siNPM1 for 3 and 9 days and subsequently subjected to double immunofluorescence staining for NPM1 (green) and fibrillarin (red). Nuclei were identified by DAPI. Scale bar: 10 μm. C, zoom-in images of representative cells in B. In siCtrl-treated cells, NPM1 preferentially stained the periphery of the nucleolus, whereas the fibrillarin antibody stained the internal regions of the nucleolus (left image). In siNPM1-treated cells, fibrillarin was more concentrated to the smaller foci, and the nucleolar structure was distorted (middle image). D, whole cell protein extracts from U2OS and U1242MG cells treated with siNPM1 or siCtrl were resolved by SDS-PAGE. The levels of NPM1, UBF1, and fibrillarin were determined by IB (4d, 4 days; 6d, 6 days). β-Actin served as a loading control on each of the two separate blotting membranes used, denoted I and II. E, estimation of nascent protein synthesis by [35S]methionine/cysteine labeling in U2OS and U1242MG cells transfected with siNPM1 or siCtrl. The labeling was conducted for 3 h at 6 days after the first siRNA transfection occasion. F, the effect of NPM1 depletion on cell proliferation was analyzed in U2OS and U1242MG cells that had been depleted of NPM1 (siNPM1) or mock-treated (siCtrl) for 6 days. To obtain cell proliferation curves, 20,000 cells/treatment were seeded in each well of the 6-well plate. Shown is the mean ± S.D. from a triplicate experiment (*, p < 0.05). G, NPM1 depletion in U2OS cells affects the p53 response. U2OS cells were transfected with siNPM1 or siCtrl for 6 days followed by exposure to DMSO (control), actinomycin D (Act-D, 5 nm), 5-fluorouracil (5-FU, 50 μm), and Nutlin-3 (10 μm) for 18 h. Protein extracts were made from the cells and resolved by SDS-PAGE. Relative levels of NPM1, p53, WIG1 (also known as ZMAT3 or PAG608), PUMA, and p21 were determined by IB. β-Actin and GAPDH served as loading controls. Note that WIG1, PUMA, and GAPDH were developed on a separate blotting membrane.
siRNA Transfection
To transfect cells in 6-well plates with siRNA we used Oligofectamine according to the manufacturer's instructions (Invitrogen). The dynamics and efficiency of NPM1 depletion by siRNA were tested by the use of a number of different oligonucleotides. To reduce the NPM1 protein level and to eliminate the nucleolar staining, it was necessary to conduct two rounds of siRNA transfections 4 days apart. siCtrl oligonucleotides were purchased from Invitrogen and Dharmacon. A number of NPM1 siRNAs were used, including two separate siRNAs purchased from Applied Biosystems: siNPM1-1 (5′-CCAAAUUCAUCAAUUAUGU-3′) and siNPM1-2 (5′-UGAUGAAAAUGAGCACCAG-3′).
Mostly, we used an On-Target SMARTpool NPM1 siRNA set (Dharmacon), simply denoted as siNPM1, based on the following set of NPM1 siRNA target sequences: 5′-UAAAGGCCGACAAAGAUUA-3′, 5′-ACAAGAAUCCUUCAAGAAA-3′, 5′-AAUGCAAGCAAGUAUAGAA-3′, and 5′-GUAGAAGACAUUAAAGCAA-3′. To deplete human DNMT3A we used Stealth siRNA1 DNMT3AHSS176225 (Invitrogen) and Silencer Select DNMT3A siRNA2 S200426 (Invitrogen). The final concentration of siRNA was kept to no more than 40 nm.
Plasmid DNA Transfection
Plasmids were transfected using Lipofectamine 2000 reagent (Invitrogen). Myc-tagged WT NPM1-(1–294) and mutated Myc-NPM1-(117–294) in the pCDNA3 vector were a gift from Yanping Zhang (28). Expression vectors pEGFP-C1-HP1α, -HP1β, and -HP1γ wild type and HP1γ C59R mutant were a gift from Peter Hemmerich and have been characterized previously (29). Empty pEGFP-C1 vector was purchased from Clontech.
Immunoblotting
For analysis of detergent-soluble proteins we used the Nonidet P-40 lysis buffer composed of 50 mm Tris-HCl, pH 7.5, 150 mm NaCl, 0.5% Nonidet P-40, 50 mm NaF, 1 mm NaVO3, 1 mm dithiothreitol, 1× protease inhibitor mixture (Roche), and 1 mm phenylmethylsulfonyl fluoride (Sigma-Aldrich). To analyze total NPM1, histones, and histone modifications, we prepared whole cell extracts by scraping cells directly into SDS-containing sample buffer (2% SDS). The cell lysates were sheered through 18-gauge needles and boiled in order to solubilize the chromatin. Chromatin isolation by small-scale biochemical fractionation was carried out as described (30). Protein concentration in Nonidet P-40 lysis buffer extract was determined by Bradford assay (Bio-Rad). In the case of the whole cell extracts, we ran pilot gels and stained them with Ponceau S or Coomassie Brilliant Blue (CBB) to verify equal loading. Proteins were separated by SDS-PAGE. Transfer of proteins from the gels onto nitrocellulose membranes was conducted on a Bio-Rad Turbo transfer machine. For immunoblotting, the PVDF membranes were incubated in blocking solution (5% milk in PBS) with primary antibodies overnight followed by three washes in PBS and subsequent incubation with secondary horseradish peroxidase-conjugated antibody at room temperature for 2 h. After three additional washes in PBS, the proteins were visualized by using ECL reagent (Amersham Biosciences) or West Pico (Pierce).
Nuclear Complex Co-immunoprecipitation and Mass Spectrometry
For small-scale co-immunoprecipitation (co-IP), cells were harvested in 0.5% Nonidet P-40 lysis buffer, and the cleared supernatants were transferred to a new tube. Antibodies were added to the lysates and samples incubated overnight at 4 °C with rotation. Protein A/G beads were added for another 2 h, and then the samples with beads were washed three times with cold lysis buffer. Pelleted beads were dissolved in SDS-containing sample buffer and boiled, and the supernatant was analyzed by SDS-PAGE. In the case of large-scale co-IP followed by mass spectrometry, the cells were harvested and prepared according to the nuclear complex co-IP kit instructions using the high stringency buffer option (Active Motif). Immunoprecipitates were separated by SDS-PAGE, and gels were stained with colloidal CBB kit according to the manufacturer's instructions (Invitrogen). The stained bands unique to the NPM1 antibody lane were cut out and subsequently identified by mass spectrometry (LC-MS/MS) bought as an external service from Alphalyse A/S (Denmark). In brief, the protein samples were reduced and alkylated with iodoacetamide (i.e. carbamidomethylated) and subsequently digested with trypsin. The resulting peptides were concentrated on a ZipTip micropurification column and eluted onto an AnchorChip target for analysis on a Bruker Autoflex III MALDI TOF/TOF instrument. The peptide mixture was analyzed in positive reflector mode for accurate peptide mass determination. MALDI MS/MS was performed on 15 peptides for peptide fragmentation analysis (partial sequencing). Peptide tolerance was set to 60 ppm with up to one miscleavage allowed. The MS and MS/MS spectra were combined and used for database searching using Mascot software, version 2.2.03. Proteins were identified in NRDB1 database. Accession numbers listed in Table 1 are linked to the UniProt database.
TABLE 1.
Proteins identified by mass spectrometry in nuclear NPM1 co-immunoprecipitates
| Protein | UniProtKBa accession No. | Molecular mass | Mascot scoreb | Sequence coverc | Unique peptidesd |
|---|---|---|---|---|---|
| Da | % | ||||
| MAGED2 | Q9UNF1 | 59,660 | 99 | 26 | 16 |
| NPM1 | P06748 | 31,090 | 130 | 42 | 11 |
| Annexin A2 | P07355 | 36,631 | 90 | 27 | 7 |
| HNRNPA2B1 | P22626 | 36,041 | 194 | 44 | 11 |
| HNRNPD1 | Q14103 | 27,346 | 117 | 19 | 6 |
| HNRNPA1 | P09651 | 34,273 | 99 | 33 | 9 |
| Histone H1.5 | P16401 | 22,566 | 149 | 24 | 6 |
| RPL23 | P62829 | 16,730 | 182 | 51 | 10 |
| RPS7 | P62081 | 22,113 | 67 | 16 | 6 |
| Histone H2B.1 | P33778 | 13,950 | 199 | 50 | 13 |
| RPL35 | P42766 | 14,543 | 105 | 30 | 6 |
| RPS20 | P60866 | 13,478 | 203 | 46 | 8 |
| Histone H2A type 1-A | Q96V6 | 14,225 | 92 | 44 | 5 |
a UniProt Knowledgebase.
b Mascot scores of 95 or greater are considered significant.
c Coverage of the protein by identified and matching peptides (%).
d Number of peptides that match the theoretical digest of the primary protein identified.
RNA Isolation and qRT-PCR
Total cellular RNA was extracted with TRIzol reagent (Invitrogen). Real-time quantitative reverse transcriptase-polymerase chain reaction (qRT-PCR) was performed to determine the expression of 47S pre-rRNA transcript. The Power SYBR® Green RNA-to-CTTM One-Step kit (Invitrogen) was used together with an Applied Biosystems 7500 real-time PCR system. 47S pre-rRNA was amplified using the following primers: forward, 5′-TGTCAGGCGTTCTCGTCTC3-′; and reverse, 5′-GAGAGCACGACGTCACCAC3-′. GAPDH was used as the internal standard and amplified using the following primers: forward, 5′-CGACCACTTTGTCAAGCTCA3-′; reverse, 5′-AGGGGAGATTCAGTGTGGTG3-′.
Immunofluorescence Staining and Microscopy
Immunofluorescence staining was carried out as described (31). Immunostained cells were analyzed by using a Zeiss Axioplan II microscope equipped with Plan-Apochromat 63×/1.4 and Plan-Neofluar ×100/1.30 objectives controlled by AxioVision 3.1 software. Images were assembled in Adobe Photoshop CS5 or Adobe Illustrator CS5. For analysis of the number, size, and Ag-NOR area of nucleoli, we used the ImageJ program.
Antibodies
The following antibodies were used: NPM1 (mouse IgG1, Sigma-Aldrich clone FC82291), p53 (mouse, Sigma-Aldrich clone DO1), p21 (rabbit, Abcam), β-actin (mouse IgG1, Sigma-Aldrich clone AC-15), WIG1/ZMAT3 (rabbit, Sigma-Aldrich AV50793), PUMA (rabbit, Abcam ab9643), fibrillarin (rabbit, Abcam ab5821), nucleolin (mouse, Abcam ab13541), RPL11 (mouse IgG1, Invitrogen clone 3a4a7), PCNA (mouse IgG, Santa Cruz Biotechnology clone PC10), α-tubulin (mouse IgM, Santa Cruz Biotechnology clone 10D8), DNMT3A (mouse, Abcam ab13888), DNMT3A (rabbit, Santa Cruz Biotechnology sc-20703), UBF1 (rabbit, Sigma-Aldrich 4503056), BrdU (mouse IgG1, Sigma-Aldrich clone BU33), GFP (mouse IgG1, Roche clone s7.1 and 13.1), GFP (rabbit IgG, Abcam), c-Myc (mouse IgG1, Sigma-Aldrich clone 9E10); H3K9ac (rabbit IgG, Abcam ab4441), H3 (rabbit IgG, Abcam ab1791), H1 (mouse IgG2a, Santa Cruz Biotechnology sc-8030), H1.5 (rabbit IgG, Abcam ab24175), phospho-histone H2A.X Ser-139 (rabbit, Cell Signaling 2577), phospho-ATM/ATR substrates (rabbit, Cell Signaling 2851), phospho-ATM Ser-1981 (rabbit, Cell Signaling 13050), and CENPA (mouse, Abcam ab13939). The following antibodies were obtained from Active Motif: H3K9me3 (rabbit serum, 39162), H3K9me2 (rabbit IgG, 39240), H4K20me1 (rabbit serum, 39176), H3K27me3 (rabbit IgG, 39157), H3K4me3 (rabbit IgG, 39915), H3K9ac (rabbit IgG, 39917), H3 (rabbit serum, 39164), H4 (rabbit serum, 39270), H3 pan-Ac (rabbit serum, 39140), H4 pan-Ac (rabbit serum, 39244), HP1γ (mouse IgG1, clone 1MOD-1A9), HP1α (mouse IgG1, clone 2MOD-1G6), and HP1β (mouse IgG1, clone 2HP-1H5).
Silver Staining of Nucleolus Organizer Regions and Acidic Toluidine Blue O Staining
Silver staining of NORs (Ag-NOR staining) was conducted as described (32). Cells grown on coverslips were fixed in 2% glutaraldehyde in PBS for 10 min at room temperature, rinsed with PBS and water followed by fixation for 5 min with methanol:acetic acid at a 3:1 ratio, rinsed in water again, and stained (for 45 min) with a mixture of solution A and solution B at a 1:2 ratio, where solution A is composed of 2% gelatin in 1% formic acid and solution B is 50% silver nitrate in ultrapure water. Reactions were terminated by washing the coverslips in ultrapure water and mounting the coverslips onto glass slides. Acidic toluidine blue O staining of air-dried unfixed cells was carried out as described (32). A solution of 0.5% toluidine blue O was prepared in 10% ethanol, diluted 1:50 with MacIlvaines's buffer (0.1 m citric acid, 0.2 m Na2HPO4) at pH 5.5. An Olympus microscope equipped with a Leica DFC320 camera and a PlanApo ×40 objective was dedicated to the analysis and documentation of Ag-NOR and toluidine blue O-stained cells.
5-Fluorouridine Labeling
5-Fluorouridine (5-FUrd) is incorporated into mRNA and rRNA. For labeling with 5-FUrd, cells on coverslips were incubated in 2 mm 5-FUrd for 10 min at 37 °C as described (33). Reactions were stopped by washing in ice-cold PBS followed by fixation of cells in 3.7% formaldehyde in PBS for 15 min and subsequent permeabilization in 0.2% Triton X-100. Cells were incubated with primary antibody against BrdU for 1 h followed by three washes and incubation with secondary antibody for 30 min, three additional washes, and mounting of the coverslips onto glass slides.
Ribosomal DNA FISH
The rRNA genes are clustered repeats found close to the centromeres of human chromosomes 13–15, 21, and 22, and these repeats form the NORs. A FISH probe for the NOR was purchased from Chrombios (Nussdorf, Germany). This probe identifies the NOR on each NOR bearing human chromosome. rDNA FISH using cells growing on coverslips was performed as suggested by the manufacturer.
Chromatin Immunoprecipitation and qPCR
Chromatin immunoprecipitation (ChIP) was performed using a ChIP kit according to manufacturer's protocol (Abcam Ltd., ab500). ChIP DNA samples were analyzed using Power SYBR® Green PCR Master Mix (Invitrogen 4367659) on an Applied Biosystems 7500 real-time PCR system using the standard SYBR® Green 90-min cycling mode. ChIP data were analyzed using the percent input method. Cells were trypsinized, collected, and fixed for 10 min in 1.1% formaldehyde. Samples were sonicated in a buffer containing protease inhibitors for 10 cycles (30 s on/30 s off) on the high setting using the Diagenode Bioruptor® Plus UCD-300 sonication system according to the manufacturer's recommendation for chromatin sonication. Samples were kept at 4 °C during sonication. A DNA fragment size of around 200–100 base pairs was confirmed using agarose (1.5%) gel electrophoresis. The samples were diluted in ChIP buffer, and an aliquot was stored at −20 °C as input reference. The following antibodies and quantities were used for immunoprecipitation: H3 (5 μg rabbit polyclonal, Abcam ab1791); H3K9me3 (2 μg rabbit polyclonal, Active Motif 39162); H3K9me2 (10 μg rabbit polyclonal Active Motif 39239); and H3K9ac (10 μg rabbit polyclonal Active Motif 39917). Samples were incubated overnight at 4 °C with rotation. Antibody-chromatin complexes were isolated using protein A beads for 60 min with rotation at 4 °C. We used a chromatin sample incubated with protein A beads-only as the negative control. To purify DNA from the samples, a DNA-purifying slurry was added, and the samples were incubated at 98 °C for 10 min, left to cool, incubated with proteinase K at 55 °C for 30 min, and then incubated at 98 °C for 10 min. The samples were resuspended in PCR-grade water and stored at −20 °C for later analysis with quantitative PCR. The following primers (P) were used corresponding to primer pairs A–C: A, P3 forward, AGGTGTCCGTGTCCGTGT; A, P3 reverse, GGACAGCGTGTCAGCAATAA; B, P4 forward, TGTCAGGCGTTCTCGTCTC; B, P4 reverse, GAGAGCACGACGTCACCAC; C, P5 forward, GGATGCGTGCATTTATCAGA; and C, P5 reverse, GTTGATAGGGCAGACGTTCG. As control, we used a ChIP primer pair for the γ-actin promoter (ab85783) purchased from Abcam.
Labeling of Newly Synthesized RNA and Protein
rRNA synthesis and processing were analyzed by l-[methyl-3H]methionine (PerkinElmer Life Sciences) labeling (50 μCi/ml) for 2 h. Total RNA was isolated using TRIzol. Isolated RNA was loaded onto 1% agarose-formaldehyde gels, blotted onto Hybond N+ membranes (Amersham Biosciences), sprayed with En3Hance spray (PerkinElmer Life Sciences), and subjected to fluorography for 1–3 days using Biomax MS-1 film and a Biomax transcreen LE (PerkinElmer Life Sciences). To visualize total protein synthesis, cells were cultured in methionine/cysteine-free medium supplemented with 10% (v/v) dialyzed FCS (Invitrogen) for 30 min followed by a 3-h pulse with 50 μCi/ml [35S]methionine/cysteine (PerkinElmer Life Sciences). Whole cell extracts were prepared, and part of the material was resolved by 12% SDS-PAGE followed by autoradiography.
Statistical Analysis
Experiments were usually conducted in three independent experiments, each in triplicate, and the results are presented as the mean ± S.D. Student's t test was used to evaluate the differences in the data between two groups. Mean, S.D., and t test were calculated in Microsoft Excel. Statistical probability (p) was set at p < 0.05, p < 0.01, and p < 0.001. Means were considered significantly different at p < 0.05.
RESULTS
NPM1 Knockdown Alters the Morphology of Nucleoli
The efficiency and dynamics of NPM1 silencing were evaluated by using a number of different siRNA oligonucleotides that target NPM1. We initially chose to work with the U2OS osteosarcoma and the U1242MG glioma cell lines in which a robust depletion of NPM1 was achieved. Upon visual inspection of cells transfected with NPM1 siRNA, we observed that nucleoli were no longer as phase-dense and compact; they instead appeared distorted and had lost their round shape (Fig. 1A). This nucleolar phenotype occurred in cells transfected with three different siRNA oligonucleotides able to reduce NPM1, but it was not observed in siCtrl-treated cells. Round and compact nucleoli were much less frequent in siNPM1-treated U2OS cells (U2OS: 87.3 ± 3.4% in control versus 12.5 ± 2.4% in siNPM1-treated cells, p < 0.001). This was the case also for U1242MG cells, which presented with 78.4 ± 5.5% round and compact nucleoli in cultures transfected with siCtrl but only 9.1 ± 3.4% round nucleoli in siNPM1-treated cells (p < 0.001). The estimation of nucleolar numbers in NPM1-depleted cells was complicated by the tendency of the elongated nucleoli to not be clearly separated from each other. Nevertheless, counting revealed that there were no significant changes in the number of nucleoli in U2OS and U1242MG cells. The average number of nucleoli in siCtrl-treated U2OS cells was 3.5 ± 1.04/cell, with 3.27 ± 0.90/cell in cells depleted of NPM1, which was not a significant difference (p = 0.35, >50 cells evaluated). In U1242MG cells, the nucleolar number was 4.0 ± 1.31 in siCtrl and 4.4 ± 1.44 after siNPM1 treatment (p = 0.28, >40 cells evaluated). Thus, NPM1 depletion induced deformation of nucleoli but not their disassembly. In support of these findings, distortion of nucleoli in HeLa cells depleted of NPM1 has been reported previously (34).
Nucleoli in NPM1-depleted cells were visualized by immunofluorescence staining for fibrillarin, which served as a marker for nucleolar DFC regions (4, 32). In siCtrl cells, NPM1 accumulated in the periphery of the nucleolus, whereas the fibrillarin antibody stained the internal regions of the nucleolus. NPM1 also localized throughout the nucleoplasm (Fig. 1B). Following 3 days of NPM1 knockdown, the nucleoplasmic staining in these cells was eliminated, but the protein was still observed in the nucleoli (Fig. 1, B and C). Despite the presence of residual NPM1, the nucleoli had now adopted a distorted phenotype in which fibrillarin was concentrated to smaller irregular foci (Fig. 1C). At day 6 and onward we obtained a relatively homogenous cell population with very little or no NPM1. Interestingly, nucleoli in these cells were morphologically distorted but seemed intact (Fig. 1C). Depletion of NPM1 did not affect the cellular levels of the nucleolar UBF1 proteins and fibrillarin (Fig. 1D).
We assessed the effect of NPM1 depletion on global protein synthesis by taking the approach of [35S]methionine/cysteine labeling of nascent protein. Silencing of NPM1 did not visibly alter the incorporation of [35S]methionine/cysteine into nascent protein in either U2OS or U1242MG cells during a 3-h pulse labeling (Fig. 1E). We next investigated the cell proliferation rate. We used U2OS and U1242MG cells that had been depleted of NPM1 for 6 days (144 h). We found that proliferation of U2OS cells was significantly decreased (p < 0.05), whereas the proliferation rate of U1242MG cells was not significantly altered when the cells were depleted of NPM1 (Fig. 1F).
Silencing of NPM1 Impairs the p53-dependent Response following Nucleolar Stress
Inhibition of rDNA transcription or defects in rRNA processing induces nucleolar stress and activation of the p53 tumor suppressor (35). Because nucleoli in NPM1-depleted cells displayed a dramatic change in morphology, we tested whether this may have caused nucleolar stress and p53 activation. Interestingly, depletion of NPM1 did not activate p53, and there was no induction of the p53 downstream targets p21, PUMA, and WIG1 (also known as ZMAT3) (Fig. 1G). This lack of p53 stabilization or activation of p53 targets in response to NPM1 depletion in U2OS cells suggests that deformation of nucleoli does not necessarily trigger nucleolar stress and p53 stabilization. U2OS cells transfected with siNPM1 were also incubated in a low concentration of actinomycin D (5 nm) or 5-fluorouracil (50 μm). Actinomycin D will at this concentration mainly act on RNA pol I, thus inhibiting rDNA transcription and triggering a nucleolar stress response, whereas 5-fluorouracil interferes with rRNA processing (35). Additionally, cells were treated with Nutlin-3 (10 μm), which induces p53 by preventing p53-MDM2 interaction, as a control for p53 induction not relying on the nucleolar stress pathway (36). The results showed a clear increase in p53 levels in siNPM1-treated cells just as in siCtrl-treated cells after incubation with actinomycin D, 5-fluorouracil, and Nutlin-3 (Fig. 1G). A deficiency in NPM1 is however known to negatively affect the transcriptional activity of p53 (37, 38). Following stabilization of p53, we detected elevated levels of p21, PUMA, and WIG1. Induction of these proteins was attenuated in siNPM1-treated cells, although the p21 level was relatively unaffected in the case of NPM1-depleted cells treated with Nutlin-3. This result led us to conclude that NPM1 was not required for p53 stabilization in response to nucleolar stress, but still the induction of p21, PUMA and WIG1 was decreased in NPM1 knockdown cells.
Altered Subcellular Distribution of rDNA upon NPM1 Depletion
Given that the change in nucleolar phenotype was an obvious and common alteration in cells with reduced levels of NPM1, we decided to carry out additional structural and functional analyses of the nucleolus. Indirect immunofluorescence staining of nucleolin confirmed the more irregular shape of nucleoli but also confirmed that the nucleolar GC remained intact (Fig. 2A). The NORs are composed of 50–100 rRNA gene copies each. Active NORs include decondensed rDNA at which associated proteins stain intensively with silver (Ag-NORs) and where rDNA transcription is thought to occur, but some NORs remain silent (1, 32). Staining of Ag-NOR proteins with silver nitrate in NPM1-depleted U2OS and U1242MG cells showed that the silver staining was different, and the round nucleolar structure seen in siCtrl-treated cells was lost (Fig. 2B). NPM1 is one among a handful of silver-reactive Ag-NOR proteins (39). A probable explanation for the retained Ag-NOR staining in NPM1-depleted cells could be that it is compensated for by an overall increase in one or several other Ag-NOR proteins and, in combination with the deformed nucleoli, masks any potential loss of NPM1 reactivity with silver. However, the actual contribution of NPM1 to the Ag-NOR signal in situ has not been fully resolved and it is possibly minor. We also found that the Ag-NOR staining was retained in Npm1−/−,p53−/− versus p53−/− mouse embryonic fibroblasts (MEFs) as well (Fig. 5, A and B).
FIGURE 2.

Changes in Ag-NOR staining patterns and altered localization of rDNA in NPM1-depleted cells. A, nucleolin immunolocalization (red) in NPM1-depleted and control U2OS cells. Scale bar: 10 μm. B, representative micrographs of Ag-NOR-stained NPM1-depleted U2OS and U1242MG cells. Magnification, ×40. C, Toluidine blue O staining of U2OS cells depleted of NPM1 versus siCtrl. Insets illustrate the perinucleolar white halo in siCtrl cells, lost in siNPM1-treated cells. Magnification, ×40. D, rDNA localization in cells depleted of NPM1. Interphase U2OS cells were subjected to fluorescent in situ hybridization to visualize the localization of the rDNA. The rDNA was hybridized to a probe specific for the NOR region (red), and nuclei were stained with DAPI (blue).
FIGURE 5.

Altered nucleolar morphology and disrupted heterochromatin organization in p53−/−,Npm1−/− mouse embryonic fibroblasts. A, phase-contrast images of Ag-NOR-stained WT, p53−/−, and p53−/−,Npm1−/− MEFs. Three cells for each genotype are shown. B, average Ag-NOR area representing analysis of 30 cells/genotype (mean ± S.D.; *, p < 0.05). n.s, non-significant. C, whole cell extracts from p53−/−,Npm1−/− and p53−/− MEFs were resolved by SDS-PAGE and transferred to membranes followed by IB with anti-H3, anti-H3K9ac, and anti-H3K9me3 antibodies. D, images of WT, p53−/−, and p53−/−,Npm1−/− MEF nuclei stained with a mouse monoclonal anti-NPM1 antibody. E, representative images of WT, p53−/−, and p53−/−,Npm1−/− MEF nuclei stained with a rabbit anti-fibrillarin antibody. F, WT, p53−/−, and p53−/−,Npm1−/− MEFs were double stained for HP1γ and fibrillarin. Scale bar: 10 μm. G, immunofluorescence staining for H3K9me3 in WT, p53−/−,and p53−/−,Npm1−/− MEFs. Cells in D--G were counterstained with DAPI.
Because the nucleoli in NPM1-depleted cells were no longer clearly seen in the light microscope as phase-dense nuclear bodies, we stained the cells with acidic toluidine blue O. At acidic pH this dye stains RNA and results in prominent nucleolar staining due to the high content of ribosomal RNA in the nucleolus (32). Nucleoli in NPM1-depleted cells could be visualized by this staining, and they clearly remained intact, although their shape was altered (Fig. 2C). Notably, the white rim corresponding to the shell of condensed DNA normally surrounding the nucleolus was missing in NPM1-depleted cells (Fig. 2C, inset). To visualize directly the effect of NPM1 depletion on the localization of the rDNA, in situ hybridization was performed using a fluorescent probe covering the rDNA loci. In control cells, the rDNA was localized within the round nucleoli, whereas in cells depleted of NPM1 the rDNA was unraveled and formed thinner strands extending throughout the nucleus, resembling the fibrillarin and Ag-NOR staining patterns (Fig. 2D).
Rearrangement of Perinucleolar Heterochromatin in NPM1-depleted Human Cancer Cells
Nucleoli usually surround themselves with a shell of perinucleolar heterochromatin (1, 5). Nucleoli stain poorly with the fluorescent dye DAPI, whereas perinucleolar heterochromatin stains intensely (1). Depletion of NPM1 led to a loss of dense perinucleolar heterochromatin around the distorted nucleoli as detected by DAPI staining. The chromatin appeared diffuse with no continuous condensation around the nucleoli in U2OS and U1242MG cells depleted of NPM1 (Fig. 3A). Trimethylated H3K9 (H3K9me3) and trimethylated H3K27 (H3K27me3) are considered markers of condensed transcriptionally inactive chromatin, and antibodies to these histone modifications usually stain perinucleolar heterochromatin (7). In NPM1-depleted U2OS cells the H3K9me3/H3K27me3-enriched perinucleolar chromatin had collapsed and was instead redistributed within the nucleus and formed irregular foci (Fig. 3B). Trimethylated H3K4 (H3K4me3) and acetylated H3K9 (H3K9ac) are considered markers of transcriptionally active chromatin regions. Nucleoli in U2OS and U1242MG cells were largely devoid of immunofluorescence staining for H3K4me3 and H3K9ac (Fig. 3B). Trimethylation of H3K9 and binding to heterochromatin protein 1 (HP1) are critical events in heterochromatin formation (40). HP1γ isoform localizes to perinucleolar heterochromatin regions surrounding the nucleolus (29), so we evaluated the localization of HP1γ in cells depleted of NPM1. Strikingly, the distinct perinucleolar enrichment of HP1γ was disrupted, and the protein accumulated in irregular foci throughout the nucleus (Fig. 3C). Irregular clusters or clumps of condensed chromatin were also found in the nucleoplasm (Fig. 3C). Given the association of NPM1 with histones (24) and the redistribution of H3K9me3 in cells depleted of NPM1, we decided to analyze the total cellular levels of H3 and common posttranslational modifications on H3 as well as H4. By immunofluorescence staining and immunoblotting, we found no evidence of major changes in the total cellular levels of H1, H3, H4, H3K9me3, H3K9ac, H3K27me3, H4K20me1, H4-PanAc, and H3K4me3 following NPM1 depletion in U1242MG cells, despite the fact that the cellular distribution of H3K9me3 and H3K27me3 was changed (Fig. 3, B, D, and E). In line with the results in U1242MG cells, neither were there any differences seen in the total cellular levels of H3K9me3, H3K9ac, H3K4me3, and H4K20me1 in U2OS cells depleted of NPM1 (Fig. 3F).
FIGURE 3.

Redistribution of perinucleolar heterochromatin in NPM1 knockdown cells. A, DAPI staining of representative cell nuclei from NPM1-depleted U2OS and U1242MG cell cultures indicates loss of the condensed and brightly stained perinucleolar chromatin. The darker DAPI-negative regions correspond to nucleoli. B, U2OS and U1242MG cell cultures transfected with NPM1 siRNA or siCtrl were subjected to immunofluorescence staining for H3K27me3, H3K9me3, H3K4me3, and H3K9ac. NPM1-depleted cells display redistribution of perinucleolar heterochromatin as revealed by H3K27me3 and H3K9me3 staining. The altered structure of nucleoli was easily seen in the case of H3K4me3 and H3K9ac, whereas these histone modifications were very sparse in the nucleoli, as seen by immunofluorescence. The white arrowheads point at nucleoli in selected images. Scale bar: 5 μm. C, U2OS cells depleted of NPM1 were subjected to immunofluorescence staining for HP1γ. Dispersed localization of the normally perinucleolar HP1γ was observed. Cells were counterstained with DAPI. The white arrowheads point at nucleoli. Scale bar: 5 μm. D, U1242MG cells were transfected with siCtrl or siNPM1. Whole cell extracts were made from cell cultures at day 10 and were separated by SDS-PAGE, transferred to membranes followed by IB with anti-H3, anti-H4, anti-H3K9ac, anti-H3K9me3, anti-H3K4me3, anti-H4K20me, and anti-H4panAc antibodies. E, same cell extracts as in D, analyzed by IB for NPM1, β-actin, and H1 (using the AE-4 antibody). CBB staining of total protein is shown as an additional control for loading and equal total histone levels. F, U2OS cells were transfected with siCtrl or siNPM1. Whole cell extracts made from cell cultures at day 6 were separated by SDS-PAGE and transferred to membranes followed by IB with anti-H3K9ac, anti-H3K9me3, anti-H3K4me3, and anti-H4K20me antibodies. Ponceau S staining (Ponc S) of the core histones served as a loading control.
Disruption of Perinucleolar Heterochromatin in NPM1-depleted Human Diploid Fibroblasts
Changes in nucleolar morphology identical to those in U2OS and U1242MG cells were detected in NPM1-depleted normal HDFs. The cells were depleted of NPM1 for 8 days (192 h) prior to analysis by immunofluorescence and immunoblotting. The changes included reduced phase contrast and absence of distinct perinucleolar chromatin (Fig. 4, A–C). H3K9me3 and HP1γ-enriched perinucleolar chromatin was redistributed within the nucleus, forming irregular and scattered foci or clumps in NPM1-depleted HDFs (Fig. 4, D and E). We estimated cell proliferation rates in HDF cultures depleted of NPM1. During the first 4 days, no significant difference in cell number was seen. NPM1 silencing did not significantly impair cell proliferation until 1 week after starting siRNA transfection. On average 25% less cells were found in siNPM1-treated HDF cultures than in siCtrl-treated cultures when measured at day 7 (p < 0.05) as well as at day 10 (p < 0.05) (Fig. 4, F and G). Interestingly, we did not detect an increase in p53 and p21, despite efficient silencing of NPM1 in HDFs as measured at day 8 (Fig. 4B). We monitored NPM1-depleted HDFs for potential DNA damage by immunofluorescence staining of the cells for DNA damage markers including γ-H2AX, p-ATM, and phosphorylated ATM/ATR substrates but did not detect any increased staining or foci formation in HDFs kept for 2 weeks with reduced NPM1 (data not shown).
FIGURE 4.

NPM1 depletion alters the structure of nucleoli in normal human diploid fibroblasts. A, phase-contrast images of a representative HDF from siCtrl and siNPM1-treated cultures. The white arrowheads point at nucleoli. Magnification, ×20. B, verification of NPM1 knockdown in HDFs. Levels of NPM1, p53, and p21 were determined by IB at day 8 after the first siRNA transfection occasion (day 0). C, detection of NPM1 by immunofluorescence staining in HDF cultures transfected with siCtrl or siNPM1. Nuclei were stained with DAPI. Scale bar: 20 μm. D, HDFs depleted of NPM1 were subjected to double immunofluorescence staining for HP1γ and fibrillarin. Insets are zoom-in images of representative nucleoli. Scale bar: 10 μm. E, HDFs depleted of NPM1 were double stained for H3K9me3 and NPM1. Insets are zoom-in images of representative nucleoli. F, morphology of HDFs transfected with siNPM1 or siCtrl indicated no overt changes in gross cell morphology at early time point (day 4). At day 15 the HDF cultures treated with siNPM1 appeared less cell-dense. Magnification, ×20. G, reduced numbers of HDFs were consistently seen in cultures treated with siRNA at days 7 and 10. Shown is the relative cell number at days 4, 7, and 10. The number of cells in siCtrl cultures was set to 100% in each case, and the percentage of cells in siNPM1-treated cultures relative to siCtrl is given. Shown is one representative experiment in triplicate (*, p < 0.05).
Altered Nucleolar Morphology and Scattering of Chromocenters in Npm1-deficient Mouse Embryonic Fibroblasts
Similar to human cells, nucleoli were altered in p53−/−,Npm1−/− MEFs when compared with WT and p53−/− MEFs. It was not possible to generate Npm1−/− MEFs on a WT p53 background. Importantly, a distorted but more extensive Ag-NOR staining pattern was also observed in p53−/−,Npm1−/− MEFs compared with WT or p53−/− MEFs (Fig. 5A). The mean values for Ag-NOR area per nucleus were 26.2 ± 3.3 μm2 for WT MEFs and 38.1 ± 3.0 μm2 in the case of p53−/−,Npm1−/− MEFs (p < 0.05, 30 cells evaluated for each genotype) (Fig. 5B). Thus, the Ag-NOR area was significantly expanded in p53−/−,Npm1−/− cells compared with WT MEFs, whereas the difference in mean Ag-NOR area per nucleus comparing WT MEFs and p53−/− MEFs was not statistically significant (Fig. 5B). Given the findings in NPM1-depleted human cells, we analyzed the heterochromatin and the nucleoli in WT, p53−/−, and p53−/−,Npm1−/− MEFs by DAPI, fibrillarin, HP1γ, and H3K9me3 immunofluorescence staining. Analysis of heterochromatin is facilitated in mouse cells in which the satellite repeats are organized in chromocenters, and these chromocenters are often juxtaposed to the nucleolus. First, we were able to determine that the total cellular levels of H3K9me3 and H3K9ac remained unchanged in p53−/−,Npm1−/− MEFs when compared with p53−/− MEFs according to immunoblotting (Fig. 5C). Second, we noticed dramatic differences in the nuclear DAPI staining pattern of p53−/−,Npm1−/− MEFs compared with WT and p53−/− MEFs. The chromocenters as identified by DAPI, H3K9me3, and HP1γ appeared irregular and smaller, but also more numerous, in the absence of Npm1 (Fig. 5, E–G). Npm1 protein itself was not enriched in chromocenters but was restricted to nucleoli and was most distinct in the nucleolar periphery (Fig. 5D). The shell of thin perinucleolar heterochromatin, especially prominent around nucleoli in p53−/− MEFs, was absent around nucleoli in p53−/−,Npm1−/− MEFs (Fig. 5, D and E). Similar to findings human cells, we found that the perinucleolar enrichment of HP1γ was disrupted. Instead, HP1γ was concentrated in irregular smaller structures in contrast to the more symmetrical, round, chromocenters present in WT cells (Fig. 5F). Thus, the loss of Npm1 in mouse cells alters the organization of nucleoli and its associated heterochromatin, matching the findings in human cells.
NPM1 Levels Dictate the Structure of the Nucleolus and Its Surrounding Chromatin
We next overexpressed WT and mutant NPM1 in U2OS cells to see whether we could detect an opposite phenotype to that in cells with reduced NPM1. The NPM1 mutant Myc-NPM1-(117–294) lacks the oligomerization domain, is predominantly nucleoplasmic, and is defective in histone binding (41, 42). Overexpression of WT NPM1, but not mutant NPM1, enhanced the features of the already round and compact nucleoli in U2OS cells, in that the surrounding rim of condensed DNA enriched for H3K9me3 and stained intensely with DAPI became much more accentuated (Fig. 6A). This enhancement of the rounded nucleolar structure was not seen in cells transfected with mutant NPM1 or in non-transfected cells serving as internal controls. The effect of additional ectopic NPM1 in U2OS cells was somewhat ambiguous given the abundance of endogenous NPM1 in these cells. Therefore, NPM1 was also ectopically introduced by transfection of the Myc-NPM1 (WT) plasmid into p53−/−,Npm1−/− MEFs. This resulted in the emergence of rounded nucleoli that were encircled by perinucleolar chromatin marked by H3K9me3 and more concentrated DAPI staining (Fig. 6C) as well as more concentrated and distinct fibrillarin staining (Fig. 6B). The effect of ectopic NPM1 was dependent on the protein level. Low levels of NPM1, similar to that obtained by knockdown of NPM1 by siRNA in WT cells, failed to restore the disrupted nucleolar morphology to wild type (Fig. 6, B and C). The NPM1 mutant (Myc-NPM1(117–294)) failed to restore nucleolar morphology in p53−/−,Npm1−/− MEFs (Fig. 6D). Hence, the structure of the nucleolus correlates closely with NPM1 levels.
FIGURE 6.

NPM1 levels dictate the structure of the nucleolus. A, U2OS cells were transfected with WT NPM1 (Myc-NPM1) and mutant NPM1 (Myc-NPM1-(117–294)). Two days post-transfection, the cells were fixed and immunofluorescence-stained for the Myc tag using the 9E10 mAb and H3K9me3 by using a rabbit polyclonal antibody. Nuclei were stained with DAPI. The DAPI and H3K9me3 staining of representative cell nuclei indicated that the perinucleolar heterochromatin had become more dense and accentuated in wild type Myc-NPM1-expressing cells than in cells transfected with mutant Myc-NPM1-(117–294). B and C, exogenous expression of WT Myc-NPM1 in p53−/−,Npm1−/− MEFs restored nucleolar morphology to WT. p53−/−,Npm1−/− MEFs were transfected with Myc-NPM1, and after 2 days the cells were fixed and stained for NPM1 and fibrillarin (B) or NPM1 and H3K9me3 (C). D, failure of mutant NPM1 to restore nucleolar morphology in p53−/−,Npm1−/− MEFs to WT. Cells were transfected with Myc-NPM1-(117–294) mutant and stained for the Myc tag and H3K9me3.
NPM1 Associates with Core and Linker Histones
Given that the perinucleolar rim of condensed DNA was disorganized in NPM1-depleted cells, we sought to gain further insights into the cause of this phenotype. We first determined the amount of NPM1 in the chromatin fraction. A high level of NPM1 was present in the chromatin fraction (Fig. 7A). Analysis of the distribution of α-tubulin, β-actin, p53, and histone H3 confirmed the accuracy of the chromatin fractionation. We had previously identified numerous ribosomal proteins and different RNA helicases as NPM1-associated proteins in the Nonidet-P40 (detergent)-soluble fraction (43). To identify proteins that associate with endogenous NPM1 in the nucleus, including chromatin, we isolated U1242MG cell nuclei and digested the chromatin with Benzonase. The nuclear lysate was used for co-IP with a highly specific mouse monoclonal NPM1 antibody. The nuclear complex co-immunoprecipitates were then resolved by SDS-PAGE, and gels were stained with silver or CBB followed by identification of the proteins by LC-MS/MS (Fig. 7B). We identified several proteins associated with endogenous NPM1 (Table 1). These included core histones H2A and H2B as well as linker histone H1.5. We confirmed that the histone H1.5 isoform was the predominant H1 isoform co-precipitated with NPM1 in U1242MG cells by using an antibody specific for H1.5 (Fig. 7C). A number of ribosomal proteins co-purified with NPM1 including RPS20, RPS7, RPL23, and RPL35 (Table 1). Other proteins associated with NPM1 were identified including heterogeneous nuclear ribonucleoproteins A2B1 (HNRNPA2B1), HNRNPA1, and HNRNPD1. The protein HNRNPA1 was identified previously as an NPM1-binding protein (44). HNRNPD1 has been implicated as a binding partner of the NPM1-ALK fusion protein (45). Additionally, HNRNPC1/C2 binds chromatin following DNA damage in a complex together with NPM1 (46). Taken together, several chromatin proteins were identified as associated with NPM1.
FIGURE 7.
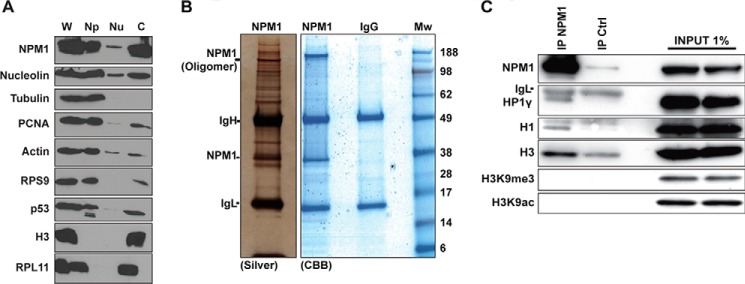
Identification of linker histone H1.5 isoform and HP1γ as NPM1-associated proteins. A, biochemical fractionation of proteins revealed that NPM1 is abundant in the chromatin fraction. Protein content in whole cell extracts (W) was compared with that obtained in a biochemical fractionation procedure using the same number of cells. Detergent-soluble proteins (Np), low-salt extracted nucleoplasmic proteins (Nu), and remaining chromatin (c)-bound proteins were separated. Histone H3 served as a marker for the chromatin fraction, and α-tubulin was used for the detergent-soluble protein fraction. B, U1242MG cells corresponding to 10 subconfluent p100 plates were subjected to nuclear complex co-IP. The immunoprecipitates were separated by SDS-PAGE, and the gels were subsequently stained with silver or CBB. IgH, immunoglobulin heavy chain; IgL, immunoglobulin light chain; Mw, molecular weight (kDa). Positions of IgH, IgL, and NPM1 are indicated. C, proteins extracted using the nuclear complex co-IP kit were immunoprecipitated with mouse monoclonal anti-NPM1 antibody overnight or an isotype IgG control antibody (IP Ctrl), and the material bound to beads was analyzed by SDS-PAGE followed by immunoblotting using anti-NPM1, anti-H3, anti-H3K9me3, anti-H3K9ac, anti-H1.5, and anti-HP1γ.
NPM1 Is Required for Efficient Nucleolar Tethering of HP1γ-enriched Foci
By testing the NPM1 nuclear complex co-immunoprecipitate for additional interacting proteins, we found that NPM1 associated with histone H3. Importantly, the pool of H3 bound to NPM1 was not modified at residue Lys-9 with me-3 or monoacetyl groups (Fig. 7C). Trimethylation of H3K9 and binding to HP1 is a critical event in heterochromatin formation (40). NPM1 also associated with HP1γ (CBX3) (Fig. 7C). The association appeared specific to HP1γ, as no binding to HP1α and HP1β was detected (Fig. 8A and data not shown). To further investigate the NPM1-HP1γ association, we conducted co-localization and co-IP experiments. Transfected EGFP-tagged HP1γ localized throughout the nucleoplasm but was also detected at perinucleolar heterochromatin regions surrounding the nucleolus as shown previously (29) (Fig. 8B). This localization pattern of ectopic EGFP-HP1γ was similar to that of endogenous HP1γ. The EGFP-HP1γC59R mutant does not accumulate in heterochromatin-rich regions, due to its failure to bind H3K9me3 and DNA (29). EGFP-HP1γ partially co-localized with NPM1, but transfected EGFP-HP1γC59R failed to bind endogenous NPM1 and did not co-localize with endogenous NPM1 in perinucleolar areas (Fig. 8, A and B). Recall that in cells devoid of NPM1, the distinct perinucleolar enrichment of HP1γ was disrupted and HP1γ was instead dispersed from the nucleolar periphery. We next sought to determine how the absence of NPM1 would influence the localization of exogenously introduced EGFP-HP1γ. We also addressed whether exogenously introduced NPM1 could affect localization of EGFP-HP1γ. To this end, we transfected EGFP-HP1γ and Myc-NPM1 into WT, p53−/−, and p53−/−,Npm1−/− MEFs. Fluorescence microscopy revealed that there was a striking difference in the localization of EGFP-HP1γ depending on the status of NPM1 (Fig. 8C). EGFP-HP1γ displayed a striking enrichment in perinucleolar foci in p53−/− MEFs, but this pattern was disrupted in p53−/−, Npm1−/− MEFs (Fig. 8, C and D). In contrast, co-expression of NPM1 and EGFP-HP1γ promoted the localization of EGFP-HP1γ into round perinucleolar foci (Fig. 8, C and D). We concluded that NPM1 is required for efficient tethering of HP1γ to the nucleolus. Whether NPM1 can tether HP1γ to nucleoli independently of other nucleolar components remains to be determined.
FIGURE 8.

NPM1 is required for nucleolar tethering of HP1γ-enriched foci. A, U2OS cells were transfected singly with plasmids encoding EGFP alone, EGFP-HP1α, EGFP-HP1β, EGFP-HP1γ, and EGFP-HP1γ-mut (C59R) as indicated. Twenty-four hours after transfection, cell lysates were prepared, and co-IP was conducted with a rabbit anti-GFP antibody. The precipitates were resolved by SDS-PAGE, transferred to a nitrocellulose membrane, and blotted with a mouse anti-NPM1 antibody or a mouse anti-GFP antibody, respectively. Approximately 5% of the cell lysate is shown as loading control. IP, immunoprecipitation. B, U2OS cells were transfected with plasmids encoding wild type EGFP-HP1γ or EGFP-HP1γ mutant. After 2 days (48 h) the cells were fixed, immunofluorescence-stained for NPM1 (red), and overlaid with the green GFP signal. WT EGFP-HP1γ, but not the C59R mutant, co-localized with NPM1 in the perinucleolar regions as indicated by arrowheads. C, p53−/−,Npm1−/− MEFs were transfected with plasmids encoding EGFP-HP1γ, Myc-NPM1, or empty pCDNA3 vector. Cells were stained for NPM1 (red) and fibrillarin (blue), which were merged with the green EGFP signal. D, cells from the experiment shown in C were evaluated for perinucleolar association of rounded HP1γ foci. Shown are the percentages of WT, p53−/−, and p53−/−,Npm1−/− cells that displayed nucleolus-associated round HP1γ foci. Data were determined from three independent experiments, and 200 cells were evaluated for EGFP-HP1γ and EGFP-HP1γ + Myc-NPM1 plasmid combinations, respectively. Shown is mean ± S.D. *, p < 0.05.
Reduced Levels of Repressive Histone H3 Modifications in the rDNA Promoter Region following NPM1 Depletion
Next we addressed whether the altered organization of nucleolar chromatin was accompanied by changes at the rDNA. We performed ChIP analysis aimed at determining changes in histone modifications at rDNA chromatin. A schematic representation of the rDNA locus in humans is shown in Fig. 9A. Using U1242MG cells that had been depleted of NPM1 for 6 days, we analyzed H3K9ac and two modifications generally associated with transcriptional repression (H3K9me2 and H3K9me3) at the rDNA. As a comparison we used the RNA pol II-transcribed nuclear γ-actin gene promoter region. We detected H3K9ac at the rRNA gene promoter, although this mark was 7-fold more abundant on the γ-actin gene promoter (Fig. 9B). In contrast, the basal levels of H3K9me3 and H3K9me2 were higher at the rRNA genes than at the γ-actin gene promoter region. Depletion of NPM1 led to a modest decrease in the levels of H3K9me3 and H3K9me2 at rDNA, and the reduction in H3K9me2 was most robust in the promoter region, whereas these marks remained relatively unchanged at the γ-actin promoter. There were relatively minor changes in the low levels of H3K9ac at the rDNA; however a reduction was seen at the γ-actin promoter. The reduction in H3K9me2 in the promoter region was significant (p < 0.05), whereas the changes in H3K9me3 and H3K9ac did not reach a significance level. Taken together, the silencing of NPM1 resulted in a modest reduction of repressive histone H3 modifications at the rDNA.
FIGURE 9.

Reduced silencing of rDNA in NPM1-depleted U1242MG glioma cells. A, schematic representation of the rRNA gene locus in human. Each rDNA repeat unit consists of a conserved rRNA coding sequence transcribed by pol I and a divergent intergenic spacer region. The mature 18S, 5.8S, and 28S rRNAs are derived from a polycistronic rRNA precursor transcript (47S pre-rRNA) by separation from externally and internally transcribed spacers. The rRNA gene was targeted with three different primer pairs, A, B, and C, binding to different regions of the gene. Primer pair A binds the upstream promoter, B binds in the initial promoter segment, and C binds the 18S region. B, quantitative ChIP analysis of the rDNA in cross-linked chromatin from U1242MG cells depleted of NPM1 and precipitated with anti-H3K9me2, anti-H3K9me3, and anti-H3K9ac antibodies. The γ-actin gene promoter region served as an internal control. Protein A beads alone were used as a negative control. Shown is the mean ± S.D. from three independent experiments (biological replicates), each performed in triplicate (*, p < 0.05).
We next sought to explore whether NPM1 depletion would result in a defective ribosome biogenesis that in turn may have affected the organization of perinucleolar chromatin. To investigate rDNA transcription, we first used fluorine-conjugated UTP (FUrd) labeling as a method of semiquantitative analysis of RNA pol I/RNA pol II transcription (33). Here, FUrd was efficiently incorporated in NPM1-depleted U1242MG cells (siNPM1 96% versus siCtrl 97% +.ve cells, 200 cells counted/siRNA and cell type) (Fig. 10A). FUrd was also efficiently incorporated in NPM1-depleted U2OS cells after a FUrd pulse of 10 min (Fig. 10A). Actinomycin D is a potent inhibitor of RNA pol I in the range of 2 to 10 nm and at higher concentrations (>100 nm) also of RNA pol II (47). When U2OS cells were exposed to the drug at a concentration of 10 nm for 2 h, it resulted in efficient inhibition of FUrd incorporation in U2OS cells (3% +.ve cells, 200 cells counted) (Fig. 10B). No major difference in FUrd labeling was observed when comparing p53−/− and p53−/−,Npm1−/− MEFs (Fig. 10C). Double immunofluorescence staining confirmed that the strongest FUrd signals were seen within nucleoli as evidenced by co-localization with fibrillarin (Fig. 10C).
FIGURE 10.

rDNA transcription and processing in NPM1-depleted cells. A, 5-FUrd incorporation in NPM1-depleted U1242MG and U2OS cells. The cells were incubated in 2 mm 5-FUrd for 10 min. Scale bar: 20 μm. B, control reactions for 5-FUrd labeling included no primary antibody control and 5-FUrd labeling in actinomycin D-treated U2OS cells (10 nm actinomycin D (Act D) for 2 h) resulting in a much reduced signal. As a comparison, 5-FUrd labeling is also shown in siNPM1- and siCtrl-treated U2OS cells. Scale bar: 10 μm. C, 5-FUrd incorporation in p53−/− and p53−/−,Npm1−/− cells. The cells were incubated in 2 mm 5-FUrd for 10 min. Incorporation of 5-FUrd into newly made RNA in A–C was detected by a primary antibody against BrdU followed by a secondary FITC-conjugated anti-mouse antibody. In C, cells were also stained for fibrillarin, revealing co-localization of 5-FUrd and fibrillarin in nucleoli. Scale bar: 10 μm. D, synthesis and processing of rRNA. U2OS cells (lanes 7–10) or U343MGa Cl2:6 cells (lanes 1–6) were transfected with siRNA oligonucleotides as indicated. Lanes 4–6 are a replicate experiment of lanes 1–3. Knockdown and control cells were labeled with [methyl-3H]methionine for 2 h. Ribosomal protein S9 (RPS9) siRNA served as a positive control for disrupted processing of rRNA (31). Newly synthesized 47S, 28S, and 18S rRNA species are indicated (upper panel), and the total 28S and 18S rRNA transferred to the membrane was visualized by methylene blue (lower panel).
To investigate the role of NPM1 in rRNA processing, U2OS cells transfected with siCtrl or siNPM1 were incubated with l-[methyl-3H]methionine to label newly synthesized and processed rRNA. Knockdown of NPM1 using two different siRNAs revealed that the production of 47S pre-rRNA was maintained and that the processing of 18S and 28S rRNA remained intact (Fig. 10D). Similar results were obtained in another cell line, glioma U343MGa Cl2:6, indicating no major differences between siNPM1 and siCtrl-treated cells in terms of rRNA synthesis and processing (Fig. 10D). In contrast, the depletion of ribosomal protein S9 (RPS9) in U2OS cells severely impaired the processing of 47S into mature 18S rRNA. In summary, NPM1 silencing had only minor effects on rRNA synthesis in the present experimental settings.
Down-regulation of DNMT3A and NPM1 Enhances rDNA Transcription
DNA methyltransferases DNMT3A and DNMT3B are the key enzymes for de novo DNA methylation. They play important roles in epigenetic control of gene expression patterns. Among the pairwise relationships between gene mutations in acute myeloid leukemia, one of the most striking was the co-occurrence of mutations in DNMT3A and NPM1 (48). DNMT3A may play a dynamic role in the epigenetic regulation of cancer cell genomes (49–51). DNMT3A localizes to nucleolar foci in resting fibroblasts, indicating a role for de novo DNA methylation in rDNA silencing (52). Biochemical fractionation showed that DNMT3A is associated with inactive rDNA in the nucleolus (53). We hypothesized that reduced levels of both NPM1 and DNMT3A may affect the regulation of rDNA transcription directly or indirectly. Expression and knockdown of DNMT3A in U1242MG cells were confirmed by immunoblotting (Fig. 11A). To better estimate rDNA transcription in these cells, we performed qRT-PCR for human 47S pre-rRNA transcript levels. The level of 47S was marginally reduced in cells depleted of NPM1 (Fig. 11B). Actinomycin D efficiently prevented RNA pol I transcription and dramatically reduced the levels of 47S. Although depletion of DNMT3A alone had a tendency toward increasing the levels of 47S pre-rRNA, it was not a significant difference compared with siCtrl or untreated cells. In contrast, the levels of 47S pre-rRNA were elevated in DNMT3A and NPM1 co-depleted U1242MG cells (∼2-fold increase in the case of siDNMT3A-1/siNPM1 versus siNPM1 alone, p < 0.05). Thus, depletion of both NPM1 and DNMT3A enhanced rDNA transcription. In agreement with the increase in rDNA transcription, we noted that nucleoli in glioma cells co-depleted of DNMT3A and NPM1 had become more phase-dense and rounded compared with NPM1-depleted cells (Fig. 11C). Note also that the nucleolar morphology in DNMT3A single knockdown cells appeared similar to the control (Fig. 11C). Furthermore, the expression and knockdown of DNMT3A were also confirmed in U2OS cells by immunoblotting (data not shown). Immunofluorescence staining revealed that the fibrillarin signal appeared more intense when DNMT3A was co-depleted with NPM1 in U2OS cells (Fig. 11D). Corresponding DAPI images showed that in DNMT3A/NPM1 co-depleted cells, distinct and condensed heterochromatin was partially missing around the majority of the nucleoli. We concluded that although DNMT3A depletion enhanced rDNA transcription in the context of reduced NPM1, it failed to restore the architecture of perinucleolar chromatin to that observed in siCtrl transfected cells.
FIGURE 11.

Knockdown of NPM1 and DNMT3A enhances rDNA transcription. A, U1242MG cells were transfected with siCtrl, siNPM1, siDNMT3A-1, siDNMT3A-2, or combinations thereof. Protein extracts were made from the cells and resolved by SDS-PAGE. Relative levels of NPM1 and DNMT3A were determined by IB. β-Actin served as a loading control. B, real-time qRT-PCR was used to measure the levels of 47S pre-rRNA in U1242MG cells depleted of NPM1, DNMT3A, or both NPM1 and DNMT3A. Shown is the mean ± S.D. of a triplicate experiment (biological replicates) in which the untreated cell population was set to 1 (arbitrary units). Actinomycin D (Act D), included as a control, was used at a concentration of 5 nm. The difference between siNPM1-depleted cells and cells co-depleted of NPM1 and DNMT3A was significant (p < 0.05). C, phase-contrast (P.C) images of U1242MG cells reveal the morphology of nucleoli in cells transfected with different siRNAs that target NPM1 or DNMT3A. The arrows point at nucleoli. D, U2OS cells were transfected with siCtrl, siNPM1, siDNMT3A-2, or a combination of siNPM1 and siDNMT3A-2 and subsequently were subjected to immunostaining for fibrillarin (red) after 6 days. Nuclei, identified by DAPI, are visualized in black-and-white mode. Scale bar: 10 μm.
DISCUSSION
NPM1 is the most diversified member of the nucleoplasmin family of histone chaperones, which also includes mammalian NPM2 and NPM3, Drosophila nucleoplasmin-like protein (dNLP), and the founding member nucleoplasmin, expressed only in the oocytes of amphibians and homologous to NPM2 (54). We found that even a partial reduction in NPM1 levels resulted in a distortion of the rounded nucleolar structure both in normal and cancer cells. Moreover, we found that perinucleolar heterochromatin was rearranged in NPM1-deficient cells, which may have contributed to the structural changes of nucleoli (Fig. 12). Interestingly, the nucleolar phenotype in NPM1-depleted human cells and Trp53−/−,Npm1−/− MEFs was similar to that observed in oocytes from Npm2−/− mice. Nucleoli in Npm2−/− oocytes lack the surrounding heterochromatin, and fibrillarin staining revealed dispersed nucleolar-like bodies, whereas usually only one single round nucleolus is seen in wild type oocytes (55). Thus, loss of NPM1, similar to the loss of NPM2, affects the organization of the perinucleolar chromatin. We compared the phenotype of NPM1-depleted cells with cells depleted of nucleolin, a major nucleolar protein. We found that nucleolin depletion resulted in much smaller, slightly deformed nucleoli with retained phase contrast and distinct perinucleolar chromatin (data not shown). The reduced nucleolar size seen in nucleolin-depleted cells would be consistent with a role of nucleolin in RNA pol I transcription (56, 57).
FIGURE 12.

Effects of NPM1 on nucleolar structure. This is a schematic illustration of the effects of NPM1 loss or NPM1 overexpression on nucleolar structure.
In principle, (i) the effect on perinucleolar chromatin could be attributed to a possible role of NPM1 in the establishment and maintenance of nucleolus-chromatin domain interactions (5), (ii) but it may also reflect a complex integration of the ribosome biogenesis machinery with the surrounding chromatin, indirectly affecting the heterochromatin; (iii) inhibition of heterochromatin formation per se may also contribute to the phenotype observed in NPM1-deficient cells. Below we present these different options in more detail, and we discuss our data that supports the first model (i), that is, a role of NPM1 in tethering of heterochromatin to the nucleolus.
NPM1 interacts with a number of different proteins that may be involved in the organization of chromatin. In addition to the core histones, we identified linker histone H1.5 as bound to NPM1, confirming previous studies (58, 59). Linker histone H1 isoforms are best known for their ability to stabilize condensed, higher order chromatin structures. Recently, H1 was shown to interact with a large network of nucleolar proteins (60). In Drosophila salivary gland polytene chromosomes, H1 is required for the structural integrity of heterochromatin and the maintenance of pericentric heterochromatin-associated histone marks including H3K9me2 (61). Herein, we also identified HP1γ as a novel NPM1-associated protein. HP1γ is localized to both euchromatin and heterochromatin and is enriched in perinucleolar chromatin (29). We observed HP1γ-NPM1 co-localization in the perinucleolar region, and interestingly, NPM1 was required for the efficient tethering of HP1γ to the nucleolus. It should be pointed out that loss of HP1γ function may negatively affect centromere clustering and cohesion processes (62–64). In fact, the loss of HP1γ in Drosophila resulted in nucleolar deformation and fragmentation.
It is conceivable that other NPM1-binding partners also contribute to the organization of perinucleolar heterochromatin. One interaction partner of NPM1 is CTCF, a sequence-specific DNA-binding protein that delimits the juxtaposed domains of active and inactive chromatin (65, 66). CTCF loss resulted in nucleolar fragmentation and reduced rDNA silencing in HeLa cells (67) as well as in Drosophila (68). Importantly, CTCF associates with NPM1, and both proteins are present at insulator sites in HeLa cells (65). The nucleoplasmin homolog dNLP mediates centromere clustering by binding to CENPA and anchoring to the nucleolus in a complex together with CTCF and nucleolin in Drosophila (9, 69). In the cell lines that we investigated, centromeres were not truly clustered around nucleoli, meaning that CENPA staining was not very useful for describing the rearrangement of perinucleolar chromatin (data not shown).
The morphology of NPM1-depleted nucleoli could potentially also be explained by changes in the formation of heterochromatin. In fact, the formation of heterochromatin is crucial for maintaining nucleolar structure and the integrity of rDNA (70). For example, H3K9 methylation and RNA interference regulate nucleolar stability, and the loss of H3K9 methylation induces fragmentation of the nucleolus due to illegitimate recombination of repetitive DNA sequences (8). A review of the literature revealed that depletion of a number of proteins involved in rDNA silencing and/or heterochromatin formation induces alterations in the nucleolar structure similar to those observed in the case of NPM1 depletion. Among these proteins have been reported DNMT1, HP1, SIRT1, and the histone H3K9 methyltransferase SUV39H1 (8, 71–73). For example, human cells with mutated DNA methyltransferase 1 (DNMT1) presented with a severe decrease in rDNA methylation concomitant with abnormal transcription of rDNA copies and disorganized nucleoli (71). Interestingly, NPM1 is not localized to the fibrillarin-rich regions of nucleoli, where active rDNA transcription and rRNA processing take place. NPM1 is enriched, and juxtaposed, to heterochromatin in the nucleolar periphery marked by H3K9me3/HP1γ (this study). We found that NPM1 depletion led to a decrease in the levels of H3K9me3 and H3K9me2 at the rDNA promoter. Importantly, however, the reduction was relatively modest, and the total cellular levels of these heterochromatin markers remained similar in NPM1-deficient versus control cells. We therefore consider it less likely that changes in heterochromatin formation contributed to the altered nucleolar morphology seen in NPM1-deficient cells.
Disruption or altered organization of the heterochromatin that surrounds nucleoli has been described in cells depleted of ribosomal proteins, indicating the existence of molecular connections among rRNA processing, pre-ribosome export, and nucleolar chromatin organization (74). Any defects in ribosome biogenesis in NPM1-depleted cells may therefore potentially alter the nucleolar chromatin structure. NPM1 has been found to be critical for rDNA transcription in HeLa cells (75), in contradiction to reports of increased rDNA transcription upon acute depletion of NPM1 in Arf−/− MEFs (76) and in HeLa cells (77, 78). We concluded, on the basis of our siRNA experiments in U1242MG cells, that NPM1 was not essential for rDNA transcription in this cell line, a finding thus in agreement with previous studies (10, 77). Given the results in U1242MG cells and the absence of a nucleolar stress response in NPM1-depleted U2OS cells and HDFs, we considered it less likely that the observed disruption of perinucleolar chromatin was caused by a deficiency in ribosome biogenesis. Importantly, the loss of Npm2 affected neither ribosome content nor protein synthesis, despite dramatic effects on the nucleolus in oocytes (55), but we do not rule out that loss of NPM1 may negatively affect ribosome biogenesis in other cell types. For instance, deregulated heterochromatin and/or loss of rDNA silencing may lead to synthesis of cryptic rRNA species that block the formation of 28S rRNA, which could lead to cell death (79). Nevertheless, depletion of NPM1 did not trigger activation of p53 in U2OS cells or HDFs, and NPM1 was dispensable for p53 stabilization in response to nucleolar stress. This result is in agreement with the critical function of ribosomal proteins RPL11 and RPL5 in mediating p53 stabilization following nucleolar stress (80–82). However, knockdown of NPM1 partially abrogated the p53-dependent increase in p21, WIG1, and PUMA in response to actinomycin D or 5-fluorouracil treatment. This result, taken together with previous reports, suggests that NPM1 is essential for the full p53 response to different types of stress (37, 38).
Because loss of NPM1 stabilizes c-Myc, we cannot exclude the possibility that the sustained rDNA transcription in U1242MG cells is caused by c-Myc (23). Another factor to be considered is the ARF tumor suppressor, which acts as a suppressor of ribosome biogenesis and rDNA transcription (76, 83). U2OS cells do not express detectable p14ARF and the U1242MG glioma line has a homozygous deletion of CDKN2A/ARF. Therefore, the observed changes in nucleolar structure and the effects on rDNA transcription are not caused by changes in p14ARF expression or localization. However, the absence of ARF in these cells may make them more sensitive to NPM1 depletion and facilitate changes in the nucleolus induced by the loss of NPM1.
Finally, we reasoned that reduced levels of NPM1 might create a permissive environment allowing for additional epigenetic changes. Here we showed that co-depletion of NPM1 and DNMT3A synergized to enhance rDNA transcription. In support of this, the rRNA primary transcript level was significantly elevated in DNMT1−/− and DNMT3B−/− human colon carcinoma HCT116 cells, as reported previously (53). Our result warrants further investigation into the dynamic interplay between DNMT3A and NPM1 and the mechanisms involved.
NPM1 is highly expressed in a number of cancers, but the functional consequences remain unclear (84). We propose that the high levels of NPM1 as seen in cancer may help to conserve the structural integrity of nucleolar chromatin. Disruption of the heterochromatin organization and blunting of the p53 cell stress response may in turn contribute to genome instability in cells with reduced levels of nucleolar NPM1 or in cells with mutant NPM1. In other words, a deficiency in NPM1 may create a permissive environment allowing for additional epigenetic or genetic changes.
Acknowledgments
We thank Klas Wiman, Olle Sangfelt, and Emmanuela Colombo for providing cell lines, Yanping Zhang for sharing NPM1 plasmids, Peter Hemmerich for HP1 constructs, and Kaveh Moazemi Goudarzi for critical reading of the manuscript.
This work was supported by the Karolinska Institutet, the Åke Wiberg Foundation, the Magnus Bergvall Foundation, and VR-MH Project K2012-99X-21969-01-3 from the Swedish Research Council (to M. S. L.).
- NOR
- nucleolar organizer region
- CBB
- Coomassie Brilliant Blue
- co-IP
- co-immunoprecipitation
- DFC
- dense fibrillar center
- DMSO
- dimethyl sulfoxide
- FC
- fibrillar center
- 5-FUrd
- 5-fluorouridine
- GC
- granular component
- HDF
- human diploid fibroblast
- IB
- immunoblot
- MEF
- mouse embryonic fibroblast
- pol I
- polymerase I
- qRT-PCR
- quantitative RT-PCR
- siCtrl
- control siRNA
- CENPA
- centromere protein A
- CTCF
- CCCTC-binding factor.
REFERENCES
- 1. McStay B., Grummt I. (2008) The epigenetics of rRNA genes: from molecular to chromosome biology. Annu. Rev. Cell Dev. Biol. 24, 131–157 [DOI] [PubMed] [Google Scholar]
- 2. Hamperl S., Wittner M., Babl V., Perez-Fernandez J., Tschochner H., Griesenbeck J. (2013) Chromatin states at ribosomal DNA loci. Biochim. Biophys. Acta 1829, 405–417 [DOI] [PubMed] [Google Scholar]
- 3. Boisvert F. M., van Koningsbruggen S., Navascués J., Lamond A. I. (2007) The multifunctional nucleolus. Nat. Rev. Mol. Cell. Biol. 8, 574–585 [DOI] [PubMed] [Google Scholar]
- 4. Boulon S., Westman B. J., Hutten S., Boisvert F. M., Lamond A. I. (2010) The nucleolus under stress. Mol. Cell 40, 216–227 [DOI] [PMC free article] [PubMed] [Google Scholar]
- 5. Németh A., Längst G. (2011) Genome organization in and around the nucleolus. Trends Genet. 27, 149–156 [DOI] [PubMed] [Google Scholar]
- 6. McKeown P. C., Shaw P. J. (2009) Chromatin: linking structure and function in the nucleolus. Chromosoma 118, 11–23 [DOI] [PubMed] [Google Scholar]
- 7. Bártová E., Horáková A. H., Uhlírová R., Raska I., Galiová G., Orlova D., Kozubek S. (2010) Structure and epigenetics of nucleoli in comparison with non-nucleolar compartments. J. Histochem. Cytochem. 58, 391–403 [DOI] [PMC free article] [PubMed] [Google Scholar]
- 8. Peng J. C., Karpen G. H. (2007) H3K9 methylation and RNA interference regulate nucleolar organization and repeated DNA stability. Nat. Cell Biol. 9, 25–35 [DOI] [PMC free article] [PubMed] [Google Scholar]
- 9. Padeken J., Mendiburo M. J., Chlamydas S., Schwarz H. J., Kremmer E., Heun P. (2013) The nucleoplasmin homolog NLP mediates centromere clustering and anchoring to the nucleolus. Mol. Cell 50, 236–249 [DOI] [PubMed] [Google Scholar]
- 10. Colombo E., Bonetti P., Lazzerini Denchi E., Martinelli P., Zamponi R., Marine J. C., Helin K., Falini B., Pelicci P. G. (2005) Nucleophosmin is required for DNA integrity and p19Arf protein stability. Mol. Cell. Biol. 25, 8874–8886 [DOI] [PMC free article] [PubMed] [Google Scholar]
- 11. Grisendi S., Bernardi R., Rossi M., Cheng K., Khandker L., Manova K., Pandolfi P. P. (2005) Role of nucleophosmin in embryonic development and tumorigenesis. Nature 437, 147–153 [DOI] [PubMed] [Google Scholar]
- 12. Cheng K., Grisendi S., Clohessy J. G., Majid S., Bernardi R., Sportoletti P., Pandolfi P. P. (2007) The leukemia-associated cytoplasmic nucleophosmin mutant is an oncogene with paradoxical functions: Arf inactivation and induction of cellular senescence. Oncogene 26, 7391–7400 [DOI] [PubMed] [Google Scholar]
- 13. Sportoletti P., Grisendi S., Majid S. M., Cheng K., Clohessy J. G., Viale A., Teruya-Feldstein J., Pandolfi P. P. (2008) Npm1 is a haploinsufficient suppressor of myeloid and lymphoid malignancies in the mouse. Blood 111, 3859–3862 [DOI] [PMC free article] [PubMed] [Google Scholar]
- 14. Lindström M. S. (2011) NPM1/B23: A multifunctional chaperone in ribosome biogenesis and chromatin remodeling. Biochem. Res. Int. 2011, 195209. [DOI] [PMC free article] [PubMed] [Google Scholar]
- 15. Grisendi S., Mecucci C., Falini B., Pandolfi P. P. (2006) Nucleophosmin and cancer. Nat. Rev. Cancer 6, 493–505 [DOI] [PubMed] [Google Scholar]
- 16. Lindström M. S., Zhang Y. (2006) B23 and ARF: friends or foes? Cell Biochem. Biophys. 46, 79–90 [DOI] [PubMed] [Google Scholar]
- 17. Okuwaki M. (2008) The structure and functions of NPM1/nucleophsmin/B23, a multifunctional nucleolar acidic protein. J. Biochem. 143, 441–448 [DOI] [PubMed] [Google Scholar]
- 18. Vousden K. H., Prives C. (2009) Blinded by the light: the growing complexity of p53. Cell 137, 413–431 [DOI] [PubMed] [Google Scholar]
- 19. Pomerantz J., Schreiber-Agus N., Liégeois N. J., Silverman A., Alland L., Chin L., Potes J., Chen K., Orlow I., Lee H. W., Cordon-Cardo C., DePinho R. A. (1998) The Ink4a tumor suppressor gene product, p19Arf, interacts with MDM2 and neutralizes MDM2's inhibition of p53. Cell 92, 713–723 [DOI] [PubMed] [Google Scholar]
- 20. Zhang Y., Xiong Y., Yarbrough W. G. (1998) ARF promotes MDM2 degradation and stabilizes p53: ARF-INK4a locus deletion impairs both the Rb and p53 tumor suppression pathways. Cell 92, 725–734 [DOI] [PubMed] [Google Scholar]
- 21. Korgaonkar C., Hagen J., Tompkins V., Frazier A. A., Allamargot C., Quelle F. W., Quelle D. E. (2005) Nucleophosmin (B23) targets ARF to nucleoli and inhibits its function. Mol. Cell. Biol. 25, 1258–1271 [DOI] [PMC free article] [PubMed] [Google Scholar]
- 22. Colombo E., Martinelli P., Zamponi R., Shing D. C., Bonetti P., Luzi L., Volorio S., Bernard L., Pruneri G., Alcalay M., Pelicci P. G. (2006) Delocalization and destabilization of the Arf tumor suppressor by the leukemia-associated NPM mutant. Cancer Res. 66, 3044–3050 [DOI] [PubMed] [Google Scholar]
- 23. Bonetti P., Davoli T., Sironi C., Amati B., Pelicci P. G., Colombo E. (2008) Nucleophosmin and its AML-associated mutant regulate c-Myc turnover through Fbw7γ. J. Cell Biol. 182, 19–26 [DOI] [PMC free article] [PubMed] [Google Scholar]
- 24. Namboodiri V. M., Akey I. V., Schmidt-Zachmann M. S., Head J. F., Akey C. W. (2004) The structure and function of Xenopus NO38-core, a histone chaperone in the nucleolus. Structure 12, 2149–2160 [DOI] [PubMed] [Google Scholar]
- 25. Okuwaki M., Matsumoto K., Tsujimoto M., Nagata K. (2001) Function of nucleophosmin/B23, a nucleolar acidic protein, as a histone chaperone. FEBS Lett. 506, 272–276 [DOI] [PubMed] [Google Scholar]
- 26. Lubitz W., Westermark B., Peterson P. A. (1980) Surface glycoproteins of normal and neoplastic glia cells in culture. Int. J. Cancer 25, 53–58 [DOI] [PubMed] [Google Scholar]
- 27. Nistér M., Heldin C. H., Westermark B. (1986) Clonal variation in the production of a platelet-derived growth factor-like protein and expression of corresponding receptors in a human malignant glioma. Cancer Res. 46, 332–340 [PubMed] [Google Scholar]
- 28. Itahana K., Bhat K. P., Jin A., Itahana Y., Hawke D., Kobayashi R., Zhang Y. (2003) Tumor suppressor ARF degrades B23, a nucleolar protein involved in ribosome biogenesis and cell proliferation. Mol. Cell 12, 1151–1164 [DOI] [PubMed] [Google Scholar]
- 29. Schmiedeberg L., Weisshart K., Diekmann S., Meyer Zu Hoerste G., Hemmerich P. (2004) High- and low-mobility populations of HP1 in heterochromatin of mammalian cells. Mol. Biol. Cell 15, 2819–2833 [DOI] [PMC free article] [PubMed] [Google Scholar]
- 30. Wysocka J., Reilly P. T., Herr W. (2001) Loss of HCF-1-chromatin association precedes temperature-induced growth arrest of tsBN67 cells. Mol. Cell. Biol. 21, 3820–3829 [DOI] [PMC free article] [PubMed] [Google Scholar]
- 31. Lindström M. S., Nistér M. (2010) Silencing of ribosomal protein S9 elicits a multitude of cellular responses inhibiting the growth of cancer cells subsequent to p53 activation. PLoS One 5, e9578. [DOI] [PMC free article] [PubMed] [Google Scholar]
- 32. Ochs R. L. (1998) Methods used to study structure and function of the nucleolus. Methods Cell Biol. 53, 303–321 [DOI] [PubMed] [Google Scholar]
- 33. Percipalle P., Louvet E. (2012) In vivo run-on assays to monitor nascent precursor RNA transcripts. Methods Mol. Biol. 809, 519–533 [DOI] [PubMed] [Google Scholar]
- 34. Amin M. A., Matsunaga S., Uchiyama S., Fukui K. (2008) Depletion of nucleophosmin leads to distortion of nucleolar and nuclear structures in HeLa cells. Biochem. J. 415, 345–351 [DOI] [PMC free article] [PubMed] [Google Scholar]
- 35. Burger K., Mühl B., Harasim T., Rohrmoser M., Malamoussi A., Orban M., Kellner M., Gruber-Eber A., Kremmer E., Hölzel M., Eick D. (2010) Chemotherapeutic drugs inhibit ribosome biogenesis at various levels. J. Biol. Chem. 285, 12416–12425 [DOI] [PMC free article] [PubMed] [Google Scholar]
- 36. Choong M. L., Yang H., Lee M. A., Lane D. P. (2009) Specific activation of the p53 pathway by low dose actinomycin D: a new route to p53-based cyclotherapy. Cell Cycle 8, 2810–2818 [DOI] [PubMed] [Google Scholar]
- 37. Colombo E., Marine J. C., Danovi D., Falini B., Pelicci P. G. (2002) Nucleophosmin regulates the stability and transcriptional activity of p53. Nat. Cell Biol. 4, 529–533 [DOI] [PubMed] [Google Scholar]
- 38. Kurki S., Peltonen K., Latonen L., Kiviharju T. M., Ojala P. M., Meek D., Laiho M. (2004) Nucleolar protein NPM interacts with HDM2 and protects tumor suppressor protein p53 from HDM2-mediated degradation. Cancer Cell 5, 465–475 [DOI] [PubMed] [Google Scholar]
- 39. Roussel P., Hernandez-Verdun D. (1994) Identification of Ag-NOR proteins, markers of proliferation related to ribosomal gene activity. Exp. Cell Res. 214, 465–472 [DOI] [PubMed] [Google Scholar]
- 40. Kwon S. H., Workman J. L. (2008) The heterochromatin protein 1 (HP1) family: put away a bias toward HP1. Mol. Cells 26, 217–227 [PubMed] [Google Scholar]
- 41. Enomoto T., Lindström M. S., Jin A., Ke H., Zhang Y. (2006) Essential role of the B23/NPM core domain in regulating ARF binding and B23 stability. J. Biol. Chem. 281, 18463–18472 [DOI] [PubMed] [Google Scholar]
- 42. Hingorani K., Szebeni A., Olson M. O. (2000) Mapping the functional domains of nucleolar protein B23. J. Biol. Chem. 275, 24451–24457 [DOI] [PubMed] [Google Scholar]
- 43. Lindström M. S., Zhang Y. (2008) Ribosomal protein S9 is a novel B23/NPM-binding protein required for normal cell proliferation. J. Biol. Chem. 283, 15568–15576 [DOI] [PMC free article] [PubMed] [Google Scholar]
- 44. Yao Z., Duan S., Hou D., Wang W., Wang G., Liu Y., Wen L., Wu M. (2010) B23 acts as a nucleolar stress sensor and promotes cell survival through its dynamic interaction with hnRNPU and hnRNPA1. Oncogene 29, 1821–1834 [DOI] [PubMed] [Google Scholar]
- 45. Fawal M., Armstrong F., Ollier S., Dupont H., Touriol C., Monsarrat B., Delsol G., Payrastre B., Morello D. (2006) A “liaison dangereuse” between AUF1/hnRNPD and the oncogenic tyrosine kinase NPM-ALK. Blood 108, 2780–2788 [DOI] [PubMed] [Google Scholar]
- 46. Lee S. Y., Park J. H., Kim S., Park E. J., Yun Y., Kwon J. (2005) A proteomics approach for the identification of nucleophosmin and heterogeneous nuclear ribonucleoprotein C1/C2 as chromatin-binding proteins in response to DNA double-strand breaks. Biochem. J. 388, 7–15 [DOI] [PMC free article] [PubMed] [Google Scholar]
- 47. Perry R. P., Kelley D. E. (1970) Inhibition of RNA synthesis by actinomycin D: characteristic dose-response of different RNA species. J. Cell. Physiol. 76, 127–139 [DOI] [PubMed] [Google Scholar]
- 48. Cancer Genome Atlas Research Network (2013) Genomic and epigenomic landscapes of adult de novo acute myeloid leukemia. N. Engl. J. Med. 368, 2059–2074 [DOI] [PMC free article] [PubMed] [Google Scholar]
- 49. Gao Q., Steine E. J., Barrasa M. I., Hockemeyer D., Pawlak M., Fu D., Reddy S., Bell G. W., Jaenisch R. (2011) Deletion of the de novo DNA methyltransferase Dnmt3a promotes lung tumor progression. Proc. Natl. Acad. Sci. U.S.A. 108, 18061–18066 [DOI] [PMC free article] [PubMed] [Google Scholar]
- 50. Li K. K., Luo L. F., Shen Y., Xu J., Chen Z., Chen S. J. (2013) DNA methyltransferases in hematologic malignancies. Semin. Hematol. 50, 48–60 [DOI] [PubMed] [Google Scholar]
- 51. Roy D. M., Walsh L. A., Chan T. A. (2014) Driver mutations of cancer epigenomes. Protein Cell 5, 265–296 [DOI] [PMC free article] [PubMed] [Google Scholar]
- 52. Galetzka D., Tralau T., Stein R., Haaf T. (2006) Expression of DNMT3A transcripts and nucleolar localization of DNMT3A protein in human testicular and fibroblast cells suggest a role for de novo DNA methylation in nucleolar inactivation. J. Cell Biochem. 98, 885–894 [DOI] [PubMed] [Google Scholar]
- 53. Majumder S., Ghoshal K., Datta J., Smith D. S., Bai S., Jacob S. T. (2006) Role of DNA methyltransferases in regulation of human ribosomal RNA gene transcription. J. Biol. Chem. 281, 22062–22072 [DOI] [PMC free article] [PubMed] [Google Scholar] [Retracted]
- 54. Frehlick L. J., Eirín-López J. M., Ausió J. (2007) New insights into the nucleophosmin/nucleoplasmin family of nuclear chaperones. Bioessays 29, 49–59 [DOI] [PubMed] [Google Scholar]
- 55. Burns K. H., Viveiros M. M., Ren Y., Wang P., DeMayo F. J., Frail D. E., Eppig J. J., Matzuk M. M. (2003) Roles of NPM2 in chromatin and nucleolar organization in oocytes and embryos. Science 300, 633–636 [DOI] [PubMed] [Google Scholar]
- 56. Cong R., Das S., Ugrinova I., Kumar S., Mongelard F., Wong J., Bouvet P. (2012) Interaction of nucleolin with ribosomal RNA genes and its role in RNA polymerase I transcription. Nucleic Acids Res. 40, 9441–9454 [DOI] [PMC free article] [PubMed] [Google Scholar]
- 57. Rickards B., Flint S. J., Cole M. D., LeRoy G. (2007) Nucleolin is required for RNA polymerase I transcription in vivo. Mol. Cell. Biol. 27, 937–948 [DOI] [PMC free article] [PubMed] [Google Scholar]
- 58. Gadad S. S., Senapati P., Syed S. H., Rajan R. E., Shandilya J., Swaminathan V., Chatterjee S., Colombo E., Dimitrov S., Pelicci P. G., Ranga U., Kundu T. K. (2011) The multifunctional protein nucleophosmin (NPM1) is a human linker histone H1 chaperone. Biochemistry 50, 2780–2789 [DOI] [PubMed] [Google Scholar]
- 59. Park G., Gong Z., Chen J., Kim J. E. (2010) Characterization of the DOT1L network: implications of diverse roles for DOT1L. Protein J. 29, 213–223 [DOI] [PubMed] [Google Scholar]
- 60. Kalashnikova A. A., Winkler D. D., McBryant S. J., Henderson R. K., Herman J. A., DeLuca J. G., Luger K., Prenni J. E., Hansen J. C. (2013) Linker histone H1.0 interacts with an extensive network of proteins found in the nucleolus. Nucleic Acids Res. 41, 4026–4035 [DOI] [PMC free article] [PubMed] [Google Scholar]
- 61. Lu X., Wontakal S. N., Emelyanov A. V., Morcillo P., Konev A. Y., Fyodorov D. V., Skoultchi A. I. (2009) Linker histone H1 is essential for Drosophila development, the establishment of pericentric heterochromatin, and a normal polytene chromosome structure. Genes Dev. 23, 452–465 [DOI] [PMC free article] [PubMed] [Google Scholar]
- 62. Canudas S., Houghtaling B. R., Bhanot M., Sasa G., Savage S. A., Bertuch A. A., Smith S. (2011) A role for heterochromatin protein 1γ at human telomeres. Genes Dev. 25, 1807–1819 [DOI] [PMC free article] [PubMed] [Google Scholar]
- 63. Larson K., Yan S. J., Tsurumi A., Liu J., Zhou J., Gaur K., Guo D., Eickbush T. H., Li W. X. (2012) Heterochromatin formation promotes longevity and represses ribosomal RNA synthesis. PLoS Genet 8, e1002473. [DOI] [PMC free article] [PubMed] [Google Scholar]
- 64. Takada Y., Naruse C., Costa Y., Shirakawa T., Tachibana M., Sharif J., Kezuka-Shiotani F., Kakiuchi D., Masumoto H., Shinkai Y., Ohbo K., Peters A. H., Turner J. M., Asano M., Koseki H. (2011) HP1γ links histone methylation marks to meiotic synapsis in mice. Development 138, 4207–4217 [DOI] [PubMed] [Google Scholar]
- 65. Yusufzai T. M., Tagami H., Nakatani Y., Felsenfeld G. (2004) CTCF tethers an insulator to subnuclear sites, suggesting shared insulator mechanisms across species. Mol. Cell 13, 291–298 [DOI] [PubMed] [Google Scholar]
- 66. Zlatanova J., Caiafa P. (2009) CTCF and its protein partners: divide and rule? J. Cell Sci. 122, 1275–1284 [DOI] [PubMed] [Google Scholar]
- 67. Hernández-Hernández A., Soto-Reyes E., Ortiz R., Arriaga-Canon C., Echeverría-Martinez O. M., Vázquez-Nin G. H., Recillas-Targa F. (2012) Changes of the nucleolus architecture in absence of the nuclear factor CTCF. Cytogenet. Genome Res. 136, 89–96 [DOI] [PubMed] [Google Scholar]
- 68. Guerrero P. A., Maggert K. A. (2011) The CCCTC-binding factor (CTCF) of Drosophila contributes to the regulation of the ribosomal DNA and nucleolar stability. PLoS One 6, e16401. [DOI] [PMC free article] [PubMed] [Google Scholar]
- 69. Padeken J., Heun P. (2013) Centromeres in nuclear architecture. Cell Cycle 12, 3455–3456 [DOI] [PMC free article] [PubMed] [Google Scholar]
- 70. Guetg C., Santoro R. (2012) Formation of nuclear heterochromatin: the nucleolar point of view. Epigenetics 7, 811–814 [DOI] [PMC free article] [PubMed] [Google Scholar]
- 71. Espada J., Ballestar E., Santoro R., Fraga M. F., Villar-Garea A., Németh A., Lopez-Serra L., Ropero S., Aranda A., Orozco H., Moreno V., Juarranz A., Stockert J. C., Längst G., Grummt I., Bickmore W., Esteller M. (2007) Epigenetic disruption of ribosomal RNA genes and nucleolar architecture in DNA methyltransferase 1 (Dnmt1) deficient cells. Nucleic Acids Res. 35, 2191–2198 [DOI] [PMC free article] [PubMed] [Google Scholar]
- 72. Salminen A., Kaarniranta K. (2009) SIRT1 regulates the ribosomal DNA locus: epigenetic candles twinkle longevity in the Christmas tree. Biochem. Biophys. Res. Commun. 378, 6–9 [DOI] [PubMed] [Google Scholar]
- 73. Horáková A. H., Bártová E., Galiová G., Uhlírová R., Matula P., Kozubek S. (2010) SUV39h-independent association of HP1β with fibrillarin-positive nucleolar regions. Chromosoma 119, 227–241 [DOI] [PubMed] [Google Scholar]
- 74. O'Donohue M. F., Choesmel V., Faubladier M., Fichant G., Gleizes P. E. (2010) Functional dichotomy of ribosomal proteins during the synthesis of mammalian 40S ribosomal subunits. J. Cell Biol. 190, 853–866 [DOI] [PMC free article] [PubMed] [Google Scholar]
- 75. Murano K., Okuwaki M., Hisaoka M., Nagata K. (2008) Transcription regulation of the rRNA gene by a multifunctional nucleolar protein, B23/nucleophosmin, through its histone chaperone activity. Mol. Cell. Biol. 28, 3114–3126 [DOI] [PMC free article] [PubMed] [Google Scholar]
- 76. Apicelli A. J., Maggi L. B., Jr., Hirbe A. C., Miceli A. P., Olanich M. E., Schulte-Winkeler C. L., Saporita A. J., Kuchenreuther M., Sanchez J., Weilbaecher K., Weber J. D. (2008) A non-tumor suppressor role for basal p19ARF in maintaining nucleolar structure and function. Mol. Cell. Biol. 28, 1068–1080 [DOI] [PMC free article] [PubMed] [Google Scholar]
- 77. Maggi L. B., Jr., Kuchenruether M., Dadey D. Y., Schwope R. M., Grisendi S., Townsend R. R., Pandolfi P. P., Weber J. D. (2008) Nucleophosmin serves as a rate-limiting nuclear export chaperone for the mammalian ribosome. Mol. Cell. Biol. 28, 7050–7065 [DOI] [PMC free article] [PubMed] [Google Scholar]
- 78. Tafforeau L., Zorbas C., Langhendries J. L., Mullineux S. T., Stamatopoulou V., Mullier R., Wacheul L., Lafontaine D. L. (2013) The complexity of human ribosome biogenesis revealed by systematic nucleolar screening of pre-rRNA processing factors. Mol. Cell 51, 539–551 [DOI] [PubMed] [Google Scholar]
- 79. Gagnon-Kugler T., Langlois F., Stefanovsky V., Lessard F., Moss T. (2009) Loss of human ribosomal gene CpG methylation enhances cryptic RNA polymerase II transcription and disrupts ribosomal RNA processing. Mol. Cell 35, 414–425 [DOI] [PubMed] [Google Scholar]
- 80. Lindström M. S., Deisenroth C., Zhang Y. (2007) Putting a finger on growth surveillance: insight into MDM2 zinc finger-ribosomal protein interactions. Cell Cycle 6, 434–437 [DOI] [PubMed] [Google Scholar]
- 81. Macias E., Jin A., Deisenroth C., Bhat K., Mao H., Lindström M. S., Zhang Y. (2010) An ARF-independent c-MYC-activated tumor suppression pathway mediated by ribosomal protein-Mdm2 interaction. Cancer Cell 18, 231–243 [DOI] [PMC free article] [PubMed] [Google Scholar]
- 82. Zhou X., Liao J. M., Liao W. J., Lu H. (2012) Scission of the p53-MDM2 loop by ribosomal proteins. Genes Cancer 3, 298–310 [DOI] [PMC free article] [PubMed] [Google Scholar]
- 83. Ayrault O., Andrique L., Fauvin D., Eymin B., Gazzeri S., Séité P. (2006) Human tumor suppressor p14ARF negatively regulates rRNA transcription and inhibits UBF1 transcription factor phosphorylation. Oncogene 25, 7577–7586 [DOI] [PubMed] [Google Scholar]
- 84. Colombo E., Alcalay M., Pelicci P. G. (2011) Nucleophosmin and its complex network: a possible therapeutic target in hematological diseases. Oncogene 30, 2595–2609 [DOI] [PubMed] [Google Scholar]