Background: Extracellular loops of the transmembrane domain of the relaxin receptor RXFP1 are predicted to interact with relaxin.
Results: RXFP1 extracellular loops displayed on a scaffold protein enabled investigation of ligand interactions.
Conclusion: RXFP1 activation involves interactions between the extracellular loops with relaxin and the receptor LDLa module.
Significance: Understanding the molecular mechanisms of RXFP1 activation will aid drug design at this receptor.
Keywords: G Protein-coupled Receptor (GPCR), Nuclear Magnetic Resonance (NMR), Peptide Hormone, Protein Engineering, Receptor Structure-Function, RXFP1, Relaxin, Serelaxin
Abstract
Relaxin, an emerging pharmaceutical treatment for acute heart failure, activates the relaxin family peptide receptor (RXFP1), which is a class A G-protein-coupled receptor. In addition to the classic transmembrane (TM) domain, RXFP1 possesses a large extracellular domain consisting of 10 leucine-rich repeats and an N-terminal low density lipoprotein class A (LDLa) module. Relaxin-mediated activation of RXFP1 requires multiple coordinated interactions between the ligand and various receptor domains including a high affinity interaction involving the leucine-rich repeats and a predicted lower affinity interaction involving the extracellular loops (ELs). The LDLa is essential for signal activation; therefore the ELs/TM may additionally present an interaction site to facilitate this LDLa-mediated signaling. To overcome the many challenges of investigating relaxin and the LDLa module interactions with the ELs, we engineered the EL1 and EL2 loops onto a soluble protein scaffold, mapping specific ligand and loop interactions using nuclear magnetic resonance spectroscopy. Key EL residues were subsequently mutated in RXFP1, and changes in function and relaxin binding were assessed alongside the RXFP1 agonist ML290 to monitor the functional integrity of the TM domain of these mutant receptors. The outcomes of this work make an important contribution to understanding the mechanism of RXFP1 activation and will aid future development of small molecule RXFP1 agonists/antagonists.
Introduction
Relaxin is a two-chain peptide hormone, structurally similar to insulin, that binds and activates the class A GPCR,4 relaxin family peptide receptor 1 (RXFP1). Its downstream actions play important roles in mediating a wide variety of physiologies (1), and recently its positive cardiovascular effects have led to the successful use of serelaxin, the recombinant form of the human gene-2 relaxin peptide (H2 relaxin), in a phase 3 clinical trial for the treatment of acute heart failure (2). With this therapeutic potential, the design of smaller relaxin analogues with oral bioavailability would be beneficial. To achieve this, understanding the molecular mechanisms of relaxin-mediated activation of RXFP1 is essential.
The seven transmembrane (TM) helix domain of RXFP1 contains the hallmarks of class A rhodopsin-like GPCRs. However, RXFP1 additionally possesses a large extracellular domain comprising 10 leucine-rich repeats (LRRs), which classifies it as a LRR-containing GPCR (LGRs). Other LGRs include the follicle-stimulating hormone receptor and the luteinizing hormone receptor, which belong to type A LGRs, and the recently deorphaned R-spondin receptors (LGR4, LGR5, and LGR6) (3), which belong to the type B LGRs. Distinct from the other LGRs and indeed all other mammalian GPCRs, RXFP1 and the structurally related INSL3 receptor RXFP2 belong to type C LGRs because of the presence of an N-terminal low density lipoprotein class A (LDLa) module (4).
Relaxin-mediated activation of RXFP1 appears to be multistep. Its high affinity binding to the LRRs has been characterized via reciprocal mutagenesis studies on both the receptor and the peptide (5, 6). Additionally, chimeric receptor data suggest that relaxin binds to the extracellular loops (ELs) of the TM domain (7); however, the affinity of relaxin to the full-length receptor is similar to an extracellular domain alone construct, which lacks the TM domain, suggesting that any binding to this region is likely to be much weaker than at the primary binding site (8).
Additionally, the LDLa module has an essential role in receptor activation. Its removal does not affect relaxin binding; however, the receptor does not signal, suggesting that relaxin binding alone is not sufficient to initiate signaling. Mutagenesis studies of the LDLa reveal that residues within the N-terminal region of the module are involved in receptor activation highlighting the possibility that the LDLa module is able to make activating contacts with the TM domain (9, 10). Molecular characterization of relaxin and LDLa interactions at the ELs of RXFP1 has been limited because of the inherent difficulties in studying membrane-associated GPCRs. Also, more in depth analysis of the interactions involving the ELs of these receptors is limited by the presence of the high affinity ligand binding site within the LRRs, which masks the weak interactions at the ELs.
A novel approach to investigate the interactions occurring at the ELs of the chemokine receptor utilized a protein engineering strategy to develop a small, soluble scaffold protein that had the ability to display the ELs of interest (11). The ELs were transferred onto a thermostabilized version of the B1 immunoglobulin binding domain of streptococcal protein G (GB1), enabling the characterization of a specific interaction with the endogenous receptor ligand. We have reported previously the design, expression, and purification of a scaffold protein (thermostabilized GB1) displaying RXFP1 EL1 and EL2, including the structurally important disulfide bond (EL1/EL2-GB1) (12). In this study, we further characterize this construct in comparison with thermostabilized GB1 and a disulfide deficient EL1/EL2-GB1cs. These proteins were then used to probe interactions with the cognate ligand relaxin and a soluble version of the LDLa module (9). Residues and regions highlighted from these studies further informed site-directed mutagenesis on the full-length receptor that confirmed the conclusions, derived from use of the loop-displaying scaffold. The recently described RXFP1 agonist ML290 (13) binds RXFP1 at an allosteric site within EL3 of the TM domain and thus was used as a tool in this study to confirm the functional integrity of the mutated TM domain enabling the discrimination between residues that perturbs the structure of the receptor rather than contributing to ligand binding. These findings will help to shed light on the complex molecular mechanism of the activation of RXFP1, which is emerging as an important clinical target.
EXPERIMENTAL PROCEDURES
Scaffold Design
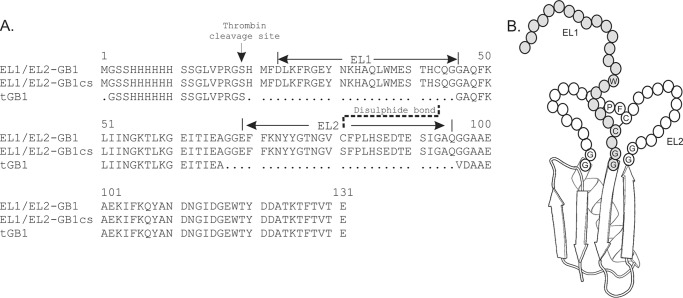
A thermostabilized GB1 (tGB1) construct (11, 14) (a gift from Dr. Martin Stone, Monash University) was used as a scaffold for designing the insertions of EL1 and EL2 of RXFP1 (EL1/EL2-GB1) as previously described (12). As controls, GB1 without loops inserted and a construct lacking the cysteines (EL1/EL2-GB1cs) that form a disulfide between EL1 and EL2 were produced. A schematic of these proteins and their sequences are represented in Fig. 1.
FIGURE 1.
Schematic for the design of EL1/EL2-GB1. A, alignment of the sequence of tGB1 with the EL1/EL2-GB1 constructs showing the positions for the insertions of the EL1 and EL2 loops and the disulfide between EL1 and EL2. The loops are flanked by Gly-Gly sequences to enable flexibility. B, a schematic of model of the EL1/EL2-GB1 construct showing the putative positions of the disulfide, Trp37 in EL1, and Phe82 and Pro83 in EL2. Trp37, Phe82, and Pro83 are equivalent to Trp479, Phe564, and Pro565 in full-length receptor.
Site-directed Mutagenesis of RXFP1
PCR-based site-directed mutagenesis was used to generate the EL1/EL2-GB1 F82A and F82Y mutants in addition to the full-length RXFP1 mutants. Although the scaffold constructs described above were used for introducing mutants, the RXFP1 sequence with an N-terminal FLAG tag (which has been shown previously not to alter ligand binding or expression (7, 15)) in the pdDNA3.1/zeo mammalian expression vector (15) was used as the template for site-directed mutagenesis of full-length RXFP1. Briefly, a pair of complementary primers were designed for each mutation according to the guidelines previously outlined (16). Mutants were generated using site-directed mutagenesis using PrimeStar DNA Taq polymerase (Clontech) following the manufacturer's protocol. The reactions were incubated with 1 μl of Dpn1 (Promega) for 2 h before transformation into competent DH5α Escherichia coli cells that were grown overnight on LB agar (Amp) plates at 37 °C. Colonies were then selected, and DNA was extracted (Promega Wizard Plus SV mini prep kit) and sequenced over the region of the mutation. Successful mutants were verified via sequencing.
Protein Expression and Purification
The expression of EL1/EL2-GB1 has been previously described (12). Briefly, the genes for EL1/EL2-GB1, EL1/EL2-GB1 F82A, EL1/EL2-GB1 F82Y, and EL1/EL2-GB1cs were subcloned into the expression vector pET15b (Novagen Inc.). Scaffolds were expressed as N-terminal His6 tag fusions in BL21 (DE3) E. coli via induction with 0.5 mm isopropyl β-d-1-thiogalactopyranoside, 16 °C for 24 h (12). 15N labeling of proteins was achieved using a previously described method (17) where 2 liters of Luria broth was inoculated with overnight culture and grown until an A600 of 0.5 was achieved. Cultured cells were collected and washed in an M9 minimal medium prior to incubation in 500 ml of minimal medium, allowing recovery for 1 h at 16 °C in the presence of 15NH4Cl prior to overnight induction at 16 °C using 0.5 mm isopropyl β-d-1-thiogalactopyranoside (17).
EL1/EL2-GB1, EL1/EL2-GB1 F82A, and EL1/EL2-GB1 F82Y were extracted from inclusion bodies by cell lysis and four washes (50 mm Tris, pH 8, 100 mm NaCl, 1 mm EDTA, 0.5% Triton X-100, 1 mm DTT) before solubilization in 8 m urea at 4 °C and purified with nickel-Sepharose Fast Flow resin (GE Healthcare) under denaturing conditions (8 m urea, 1 m NaH2PO4, 10 mm Tris, pH 8, followed by a wash at pH 6.3 and elution at pH 4). Proteins were refolded stepwise in 3 m urea (500 mm NaCl, 50 mm Tris, 50 mm glycine, 100 mm glucose, 4 mm reduced glutathione, 0.4 mm oxidized glutathione, pH 8) and then 1 m urea (500 mm NaCl, 50 mm Tris, 50 mm glycine, 100 mm glucose, 4 mm reduced glutathione, 0.4 mm oxidized glutathione, pH 8) at room temperature prior to overnight dialysis in 20 mm Tris, pH 8. The protein was purified on DEAE beads (GE Healthcare) using a NaCl gradient in 20 mm Tris, pH 8, prior to final purification on a Hiload 16/60 Superdex 75 gel filtration column (GE Healthcare) in 50 mm NaH2PO4, pH 7. Yields of 5 mg/liter culture were routinely obtained, and protein identity and disulfide bond formation were confirmed by electrospray ionization-TOF mass spectrometry.
The tGB1 and EL1/EL2-GB1cs proteins were similarly expressed, but purified from the soluble fraction of lysed cell pellets using Ni-Sepharose Fast Flow resin (GE Healthcare) with proteins eluted with 200–300 mm imidazole, 20 mm Tris, 150 mm NaCl, pH 8 prior to final purification on a Hiload 16/60 Superdex 75 gel filtration column (GE Healthcare), 50 mm NaH2PO4, pH 7. Yields of 10 mg/L culture were routinely obtained and protein identity was confirmed by electrospray ionization-TOF mass spectrometry.
CD Spectrophotometry
CD measurements were made on an AVIV model 410SF spectropolarimeter with temperature control. Wavelength scans were acquired at the far UV range (250–190 nm) at 0.5-nm resolution in a cell with a 1-mm path length at 25 °C. Raw CD data had the background (buffer only) subtracted and was expressed as mean residue elipticity [θ]. All data used were below the Dynode range of 500 V. Samples were degassed for 20 min prior to analysis and were at 0.15 mg/ml in 50 mm NaH2PO4, pH 7.5. The proportion of secondary structure was determined using CDPro (18), whereby Continll and reference set 6 were the favored comparison data set, generally giving the lowest normalized root mean square deviation values as an assessment of fit.
In thermal denaturation experiments, protein elipticity was monitored at 222 nm, whereas the temperature was increased from 20 to 90 °C at 1 °C intervals with a 4-s averaging time and 0.2 min of temperature equilibration time at each temperature step. Experiments were repeated three times, with each generating comparable results.
Biotinylated H2 Relaxin
The biotinylated H2 relaxin analogue (relaxin-b) was chemically synthesized using regioselectively S-protected A- and B-chains followed by sequential disulfide bond formation (19, 20). The biotin moiety was attached to the N terminus of the A chain with a 4× polyethylene glycol linker. The purified final product obtained from this chemical synthesis was 3.1 mg with a good overall yield (∼15% starting from the B-chain) given the complexity of this peptide.
Streptavidin-based Relaxin Pulldown Assay
A pulldown assay was used to detect whether a complex formed between a biotinylated H2 relaxin construct and the scaffolds. The complexes were detected by Western blot using anti-His antibodies. Initial binding reactions contained 0.01 mg/ml of scaffold protein, 2× molar ratio of relaxin-b and at least 20- molar ratio of competitor H2 relaxin (no biotin tag; recombinant H2 relaxin kindly provided by Corthera) in 20 mm NaH2PO4, pH 7.5, 150 mm NaCl. 30 μl of streptavidin-Sepharose (GE Healthcare) resin was washed in 20 mm NaH2PO4, pH 7.5, 150 mm NaCl at 4 °C for 20 min prior to collection by centrifugation at 2000 rpm for 30 s and resuspended in 100 μl of peptide containing reactions. Each reaction was incubated overnight on slow rotation at 4 °C. Resin was washed with 20 mm NaH2PO4, pH 7.5, 150 mm NaCl three times prior to analysis by Western blot using His tag (27E8) mouse monoclonal antibody (Cell Signaling Technologies), 1:1000, made up in 50 mm Tris, pH 7.4, 150 mm NaCl, 0.1% Tween, 0.05% skim milk as the primary antibody and anti-mouse IgG, HRP-linked antibody (Cell Signaling Technologies), 1:5000, made up in the same buffer, for the secondary antibody. Westerns were developed using Amersham Biosciences ECL prime (GE Healthcare) and imaged on a LAS 3000 IDX4 gel imager (Fugi photo film Co.).
For assays, where the interaction of the scaffold with the LDLa module was being interrogated, LDLa was expressed and purified as previously described (9, 21), and buffers of 100 mm Tris, 150 mm NaCl, and 10 mm CaCl2, pH 7.5, were used as the structural integrity of the LDLa module requires Ca2+ ligation (21). All pulldown experiments were repeated at least three times on individual protein batches.
15N HSQC NMR of EL1/EL2-GB1 Titrations
The binding of H2 relaxin to EL1/EL2-GB1 and other scaffold proteins was monitored by using two-dimensional 1H,15N heteronuclear single quantum coherence spectroscopy (15N HSQC) for each titration point of increasing H2 relaxin: 1, 5, 10, 50, and 100 μm. The initial concentration of protein was 150 μm and did not vary more than 10% over the course of the titration. The proteins and H2 relaxin were assayed in 50 mm NaH2PO4, pH 6.8, and titrations were carried out at 40 °C on a Bruker 800 MHz Avance II spectrometer equipped with a 1H, 15N, and 13C cryoprobe. Titrations with the LDLa module used protein expressed and purified as previously described (9) and conducted in 100 mm Tris, 10 mm CaCl2, 150 mm NaCl, pH 6.8, because of a structural requirement for calcium (21) with 150 μm EL1/EL2-GB1 and increasing concentrations of LDLa: 10, 50, 100, and 200 μm. In the reverse experiment, the 15N LDLa module was expressed and purified, and a 100 μm sample was titrated against unlabeled EL1/EL2-GB1 of increasing concentrations at 25, 50, and 100 μm in 100 mm Tris, 10 mm CaCl2, 150 mm NaCl, pH 7.5. For all titration experiments, the titrant and titrand were prepared by dialyzing in the same buffer within the same vessel.
NMR data were processed in NMRPipe (22) using a Lorentz-Gauss window function in the 1H dimension and a cosine bell in the 15N dimension, and each dimension was zero filled once prior to Fourier transform. Data were analyzed in NMRView (23). The Kd values were calculated by fitting the intensity changes to the peaks to a single site saturation binding curve using the formula: Y = (L)/(Kd + L), where Y is the peak intensity, and L is the concentration of ligand.
Receptor Expression on HEK 293T Cells
HEK-293T cells were transfected with mutant receptor plasmids using LipofectamineTM 2000 (Invitrogen) according to the manufacturer's instructions. Mutant receptor expressing cells were then selected for semistable expression by Zeocin selection followed by FACS using a fluorescently tagged FLAG antibody 1 week later as previously described (24). HEK293T cells stably expressing WT RXFP1 were used as a positive control in the FACS sort, and only the top 10% of cells with fluorescence levels significantly higher than the background fluorescence in nontransfected HEK293T control cells were collected. The sorted cells were grown in complete DMEM in the presence of 200 μg/ml Zeocin until confluent. The semistable expression of the mutant receptors was maintained with weekly Zeocin treatment.
Eu-labeled H2 Relaxin Binding Assays
Saturation binding assays were performed on whole cells as described previously, using Europium labeled H2 relaxin (Eu-H2 relaxin) (25). Increasing concentrations of Eu-H2 relaxin (0.1–50 nm) were utilized for saturation binding, and nonspecific binding was determined in presence of 1 μm of unlabeled H2 relaxin. Readings were taken in triplicate and read on a BMG plate reader (Omega) in clear-bottomed, opaque-walled 96-well plates (PerkinElmer Life Sciences). The data were analyzed using GraphPad PRISM 5 and presented as mean percentage specific binding ± S.E. of at least three independent experiments. A nonlinear regression one-site binding curve was then fitted and resulting pKd and Bmax values were subjected to one-way analysis of variance and uncorrected Fisher's least square difference comparison test.
cAMP Activity Assays
The ability for WT and mutant RXFP1 variants to signal in response to stimulation with H2 relaxin or the RXFP1 small molecule allosteric modulator ML290 (13) was assessed using a cAMP reporter gene assay as previously described (26). HEK-293T cells stably expressing RXFP1 or the mutant receptors were seeded into poly-l-lysine-coated 96-well plates (40,000 cells/well). 24 h later, the cells were treated with 100 μl of differing concentration of H2 relaxin (0.0001–10 nm) or 5 μm forskolin and allowed to incubate for 6 h at 37 °C, 5% CO2. The medium was then removed, and the cells were frozen at −80 °C overnight. Cells were lysed by incubation with 25 μl/well 100 mm NaH2PO4, 2 mm MgSO4, 0.1 mm MnCl2, pH 8, for 10 min and then 100 μl/well 100 mm NaH2PO4, 2 mm MgSO4, 0.1 mm MnCl2, 0.5% Triton X-100, 40 mm β-mercaptoethanol, pH 8, for 10 min. 25 μl of β-galactosidase substrate was added (1 mg/ml chlorophenolred-β-d-galactopyranoside (Roche Diagnostics) in 100 mm NaH2PO4, 2 mm MgSO4, 0.1 mm MnCl2, pH 8), and the absorbance was read at 570 nm on Benchmark Plus (Bio-Rad) microplate spectrophotometer. Experiments were completed in triplicate and repeated three times. The data were analyzed in GraphPad Prism 5 with the amount of β-galactosidase activity calculated as a percentage forskolin response plotted as means ± S.E. A nonlinear regression dose-response curve was then fitted, and the resulting pEC50 and Emax values were subjected to one-way analysis of variance and uncorrected Fisher's least square difference comparison test.
RESULTS
Design of a RXFP1 EL1/EL2 Displaying Scaffold
The design of the loop-displaying scaffold required careful consideration of the loop boundaries and insertion tolerable sites. A thermostabilized variant of the B1 immunoglobulin binding domain of streptococcal protein G (tGB1) was chosen as the backbone for this loop scaffold because of its size, solubility, extensive characterization using NMR, and successful use in a similar application (11, 12). In a previous report, two tGB1 loops were replaced by GPCR extracellular loops of CCR3, which were well tolerated (11). Based on this design, the tGB1 loops were likewise replaced by RXFP1 EL1 and EL2 sequences (Fig. 1). RXFP1 boundaries for the extracellular loop sequences were selected based on predictions of putative loop-transmembrane helix boundaries using TMHMM (27), TMPredict (28), and Mobyle (29). Because EL2 had been implicated in the secondary site using receptor chimeras (7, 15), it was incorporated into the second insertion site where both ends would be tethered (Fig. 1). To permit flexibility, two glycine residue linkers flanked EL2. EL1 was positioned at the N terminus of the scaffold such that the C-terminal cysteine of EL1 should be able to form a disulfide with the mid-loop cysteine of EL2 (Fig. 1). This disulfide is conserved in the majority of GPCRs and is known to be important for receptor function (30). The construct containing EL1 and EL2 with an intact disulfide was designated EL1/EL2-GB1. As a negative control, a disulfide-less scaffold was generated where the cysteine residues in EL1/EL2-GB1 were mutated to serine and was designated EL1/EL2-GB1cs (Fig. 1). This construct was predicted not to be able to interact with H2 relaxin because of the loss of structure within the loops caused by the loss of the disulfide bond. An additional control of tGB1 without loops was also prepared.
Characterization of tGB1, EL1/EL2-GB1, and EL1/EL2-GB1cs
We initially tested the integrity of the control proteins tGB1 and EL1/EL2-GB1cs as well as EL1/EL2-GB1 using CD spectrophotometry. The proportion of secondary structure was determined using CDPro (18).
The CD spectra of tGB1, EL1/EL2-GB1, and EL1/EL2-GB1cs suggest that the proteins are folded with tGB1 having mixed α/β structure consistent with the literature (14). Analysis of EL1/EL2-GB1 compared with tGB1 by CD shows a marked increase in the proportion of β-sheet and decrease in α-helix (Fig. 2 and Table 1). An increase in undefined structure was also observed. The latter change likely reflects the presence of the loops grafted into the protein; however, the ∼4% increase in undefined structure is modest considering the large loop insertions. The increased proportion of β sheet suggests that part of the loops may form a β sheet conformation. EL1/EL2-GB1cs has similar secondary structure compared with EL1/EL2-GB1 (Fig. 2A and Table 1); however, the small reduction in helix and the increase in β-sheet may infer that some of the secondary structure of the loops involves the disulfide bond, which was not unexpected.
FIGURE 2.
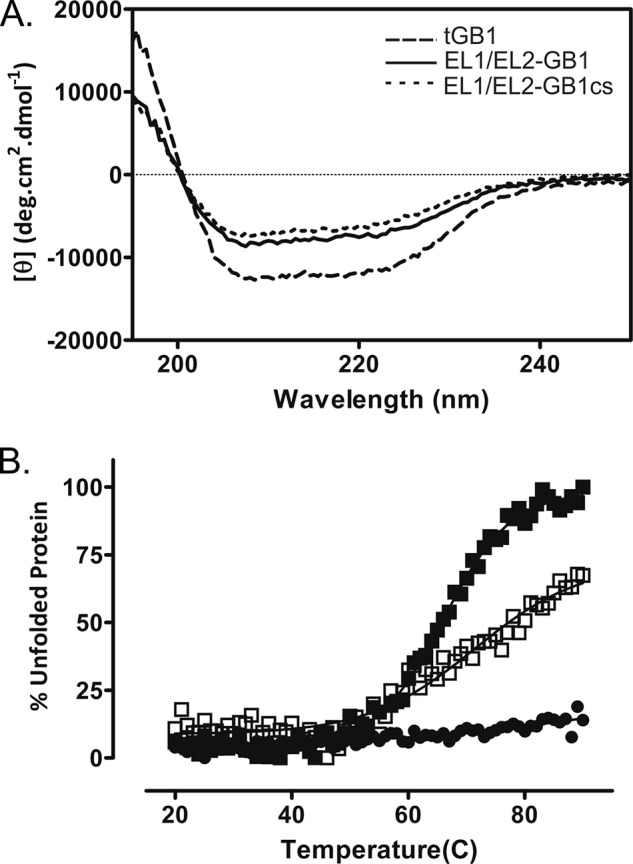
A, CD spectra of EL1/EL2-GB1 (solid line) and EL1/EL2-GB1cs (dotted line) exhibit less secondary structure compared with tGB1 (dashed line), which is consistent with the addition of unstructured loops. B, protein unfolding was measured by CD measurement at 222 nm at temperatures ranging from 20 to 90 °C. The control tGB1 (■) did not unfold over this temperature range; however, EL1/EL2-GB1 (●) and EL1/EL2-GB1cs (○) unfolded with Tm values of 65 °C and >70 °C, respectively.
TABLE 1.
Proportions of secondary structure predicted by CDPro for the soluble scaffold proteins determined by CD
| α helix | β sheet | Turn | Unstructured | Tm | |
|---|---|---|---|---|---|
| % | % | % | % | °C | |
| tGB1 | 35.5 | 14.7 | 20.3 | 29.5 | <90 |
| EL1/EL2-GB1 | 21.7 | 24.6 | 20.3 | 33.4 | 65 |
| EL1/EL2-GB1cs | 18.3 | 27.5 | 19.9 | 34.3 | >70 |
| EL1/EL2-GB1 F82A | 17.2 | 26.7 | 19.7 | 36.3 | 65 |
| EL1/EL2-GB1 F82Y | 21.9 | 26.1 | 20.7 | 31.3 | 68 |
The thermal stability of the purified proteins was assessed using CD (Fig. 2B and Table 1). As expected (14), tGB1 did not unfold over the range of 20–90 °C and retained its secondary structure compared with an unmelted protein. The addition of the loops to the scaffold was destabilizing, which is reflected in both EL1/EL2-GB1 and EL1/EL2-GB1cs where the Tm values were determined to be 65 and >70 °C, respectively (Fig. 2 and Table 1). The Tm of EL1/EL2-GB1cs is also higher than EL1/EL2-GB1, indicating that the restriction of the disulfide bond is also destabilizing. Detecting EL1/EL2-GB1-relaxin complexes using streptavidin pulldown assays reveals that the EL disulfide bond is essential.
A streptavidin pulldown assay was developed to determine whether EL1/EL2-GB1 was able to bind H2 relaxin. Fig. 3 shows that in the presence of biotinylated H2 relaxin (relaxin-b), EL1/EL2-GB1 is captured on the streptavidin beads in the bound fraction as determined by Western blot detecting the N-terminal His6 tag on EL1/EL2-GB1. Relaxin-b was unable to pulldown unmodified tGB1 (Fig. 3), suggesting that the interaction is specific for the loop sequences inserted in EL1/EL2-GB1. Additionally EL1/EL2-GB1cs was also unable to interact with relaxin-b because it was detected in the unbound fraction, suggesting that the structure and conformation of the loops constrained by the disulfide bond on this scaffold are essential for interactions with relaxin-b.
FIGURE 3.
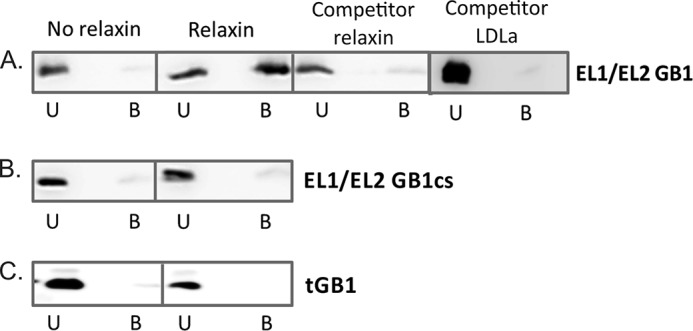
Streptavidin pulldown assay to determine relaxin binding. A, the first panel shows that EL1/EL2-GB1 does not interact with streptavidin resin. In the second panel, EL1/EL2-GB1 is efficiently pulled down by biotinylated H2 relaxin. This interaction was disrupted with the addition of excess competitor of either unbiotinylated H2 relaxin (third panel) or the LDLa module (fourth panel). B and C, control proteins EL1/EL2-GB1cs (B) and GB1 (C) were unable to bind biotinylated H2 relaxin. U, unbound fraction; B, bound fraction to streptavidin beads. The data are from one representative experiment from three independent experiments.
To confirm the specificity of the interaction between EL1/EL2-GB1 and H2 relaxin, the complex was mixed with excess unbiotinylated H2 relaxin to outcompete binding of the scaffold to the streptavidin bound relaxin-b. Fig. 3 shows that unbiotinylated H2 relaxin alone does not promote EL1/EL2-GB1 binding to naked streptavidin beads. However, when added in excess to the relaxin-b/EL1/EL2-GB1 complex, the unbiotinylated H2 relaxin is able to compete with relaxin-b, resulting in less EL1/EL2-GB1 bound to the streptavidin, demonstrating a specific interaction. Detecting EL1/EL2-GB1-LDLa complexes using streptavidin pulldown assays reveals that the LDLa module can also interact with RXFP1 extracellular loops.
Because the N-terminal RXFP1 LDLa module has been shown to be essential for receptor activation, we hypothesized that it may interact with the ELs displayed on the EL1/EL2-GB1. To test this, we repeated the pulldown assay, this time using an excess of recombinant LDLa module to compete with EL1/EL2-GB1. This resulted in EL1/EL2-GB1 being detected in the unbound fraction (Fig. 3).
Taken together, these results show that the H2 relaxin interaction with the ELs displayed on our scaffold is dependent on the structural constraints driven by the disulfide bond. These results also suggest that LDLa binds to these ELs, and its ability to outcompete the relaxin-b/EL1/EL2-GB1 complex suggests the possibility of an overlap in the binding sites.
H2 Relaxin Binding EL1/EL2-GB1 Observed by 15N HSQC Confirms Findings from the Pulldown Assays
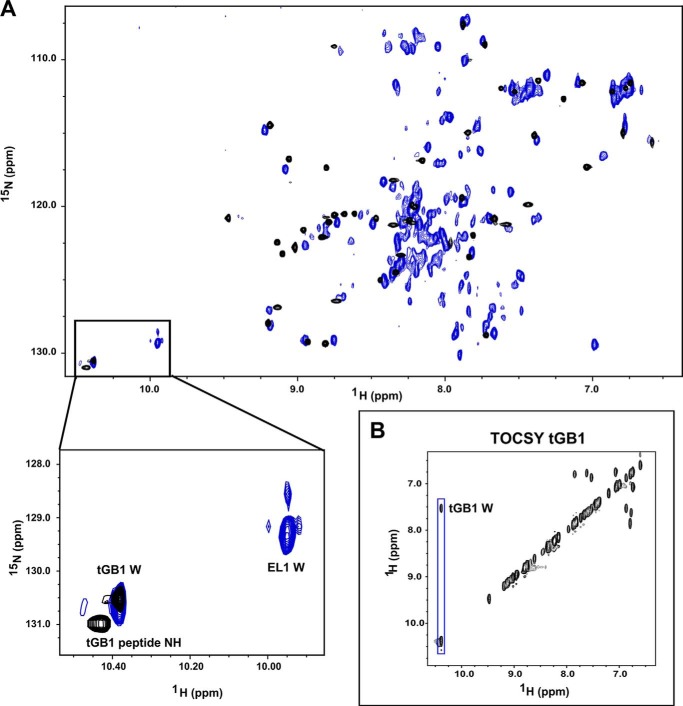
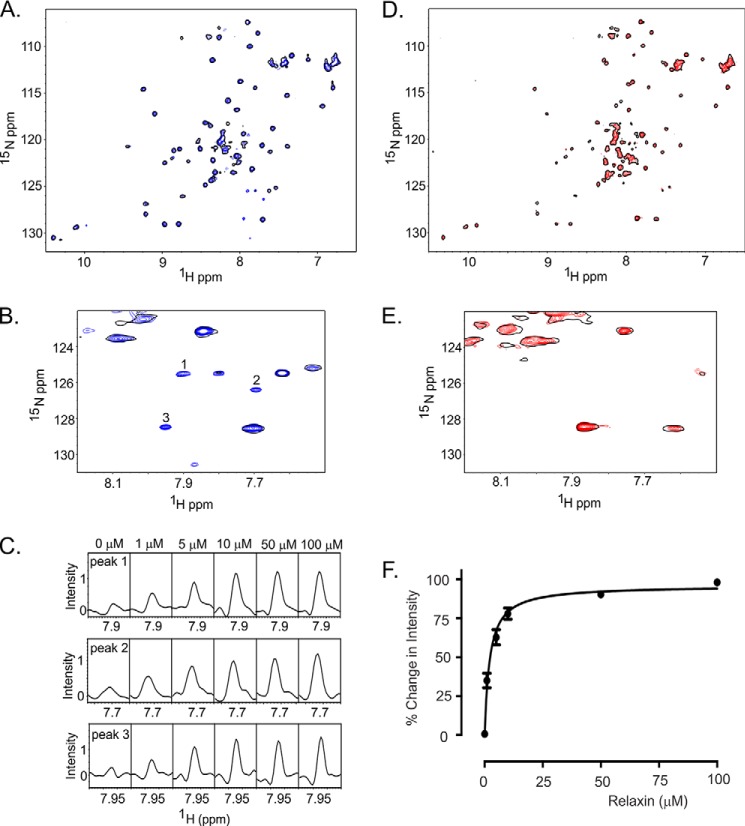
Extending from the pulldown assays described above, we used NMR experiments to probe the interaction of EL1/EL2-GB1 with H2 relaxin and the LDLa module, as well as EL1/EL2-GB1cs with H2 relaxin. Two-dimensional 1H,15N HSQC spectra were initially collected on both EL1/EL2-GB1 and EL1/EL2-GB1cs in the apo form. We assessed the quality of NMR spectra at pH 6 and 6.8 over temperatures ranging from 10 to 40 °C and found the spectrum of EL1/EL2-GB1 at pH 6.8 and 40 °C showed the largest number of well dispersed resonances, indicative of a folded protein. However, overlay with the spectrum of tGB1 reveals that most of the dispersed resonances belong to the scaffold itself (Fig. 4). Compared with the spectrum of tGB1, there are a large number of additional, albeit weak, resonances in EL1/EL2-GB1 between 7.5 and 8.5 ppm (1H) that likely belong to the EL1 and EL2 insertions. The chemical shifts of these resonances suggest a lack of structural order, whereas the weak intensities suggest motion on an intermediate time scale. An additional complexity was revealed by a simple peak count that showed there were seven more resonances observed than expected, indicating structural heterogeneity. Although this heterogeneity and the large number of weak peaks limited resonance assignment, it was trivial to assign the EL1 side chain tryptophan resonance at 9.90 ppm (Fig. 4). Acquiring spectra of EL1/EL2-GB1cs (Fig. 5D) showed both an increase in heterogeneity, with additional resonances being observed (of tGB1 or loops) and a general increase in resonance intensity. The increase in resonance intensity suggests that the loss of the disulfide results in the EL2 loop becoming mobile on a fast time scale. In EL1/EL2-GB1cs, the resonance attributed to the EL1 side chain tryptophan has split into two resonances of 2:1 intensity (Fig. 5D), suggesting that the additional heterogeneity in this construct could be due to cis-trans isomerism of proline. There is one proline in these proteins, in EL2; therefore, it is tempting to speculate that the tryptophan in EL1 is in close proximity to this proline in EL2.
FIGURE 4.
15N HSQC spectra of tGB1 (black) overlaid with EL1/EL2-GB1 (blue). A, the spectra show that the majority of dispersed peaks are most likely residues of the tGB1 scaffold with obvious glycine peptide and the tryptophan side chain resonances visibly unique to EL1/EL2-GB1. The inset highlights the tGB1 and EL1 tryptophan side chain resonances. B, TOCSY of tGB1 confirmed the identity of tGB1 tryptophan in the spectra. The additional resonance near 10.4 ppm (1H) and 131 ppm (15N) in the tGB1 spectra belongs to a peptide group. Experiments were conducted on protein at 150 μm in 50 mm phosphate buffer, pH 6.8, at 40 °C.
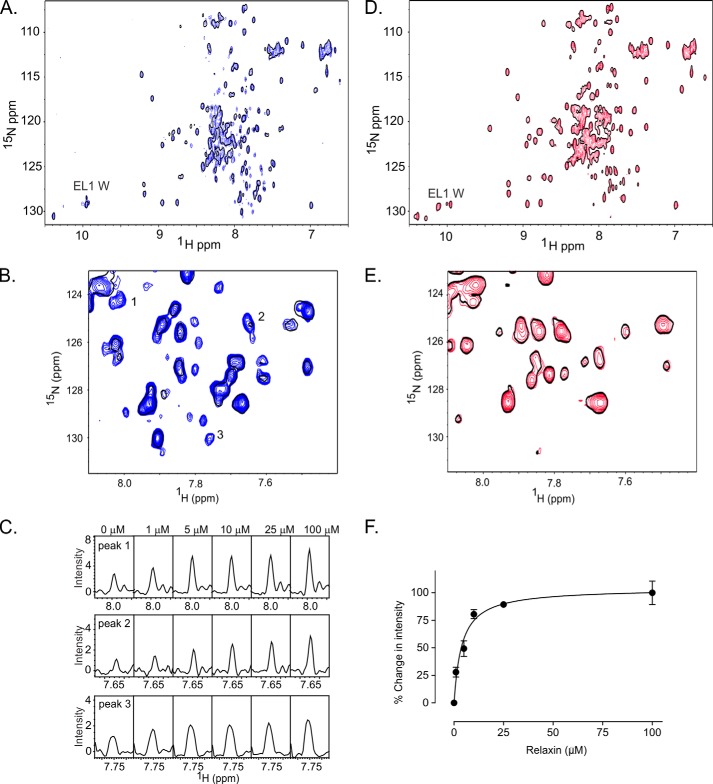
FIGURE 5.
15N HSQC spectrum demonstrating H2 relaxin interacts with of EL1/EL2-GB1 and not EL1/EL2-GB1cs. The data were acquired in 50 mm NaH2PO4, pH 6.8, at 40 °C. A, overlay of the 15N HSQC spectra of EL1/EL2-GB1 with 0 (single black contour) and 10 μm H2 relaxin (blue contours) demonstrating resonances appearing and increasing in intensity upon the addition of H2 relaxin. B, expansion of a region of the overlay of EL1/EL2-GB1 at 0 and 10 μm H2 relaxin. C, resonances numbered in B are shown in cross-section at 0, 1, 5, 10, 50, and 100 μm H2 relaxin, demonstrating the dose dependence of the intensity changes. D, overlay of the 15N HSQC spectra of EL1/EL2-GB1cs with 0 (single black contour) and 10 μm H2 relaxin (red contours). E, expansion of a region of the overlay of EL1/EL2-GB1cs at 0 and 10 μm H2 relaxin showing no dose dependence changes to the spectra. F, the average change in intensity of 20 15N HSQC peaks for EL1/EL2-GB1 with the addition of H2 relaxin (Kd of 3.9 ± 0.9 μm). No peaks from EL1/EL2-GB1cs were able to exhibit the same response, indicating no interaction between EL1/EL2-GB1cs and H2 relaxin, confirming the results from the pulldown assay.
H2 Relaxin Titrations to Both EL1/EL2-GB1 and EL1/EL2-GB1cs Confirm the Importance of the Disulfide
Titration of 15N-labeled EL1/EL2-GB1 with H2 relaxin resulted in the appearance of new resonances and an increase in the intensity of others (Fig. 5, A and B), indicating that the time scale for these resonances has altered because of an interaction. Fig. 5 (B and C) highlights some of the dose-dependent changes in resonance intensity associated with increasing H2 relaxin concentration. The changes in intensity of 20 peaks that do not belong to GB1 were averaged and plotted against H2 relaxin concentration (Fig. 5F), and an apparent Kd of 3.9 ± 0.9 μm was determined, which is consistent with a weak interaction. Notably, the resonances that were affected are not those believed to belong to the core of the GB1 scaffold. No dose-dependent appearances of resonances and/or increases in resonance intensity were observed in 15N HSQC spectra of EL1/EL2-GB1cs when titrated with H2 relaxin to the same concentrations as EL1/EL2-GB1 (Fig. 5, D and E), supporting the observation from the streptavidin pulldown assay, which showed no interaction between EL1/EL2-GB1cs and H2 relaxin.
Detecting an Interaction between the LDLa Module and EL1/EL2-GB1 Using NMR Supports an Interaction with the Extracellular Loops of RXFP1
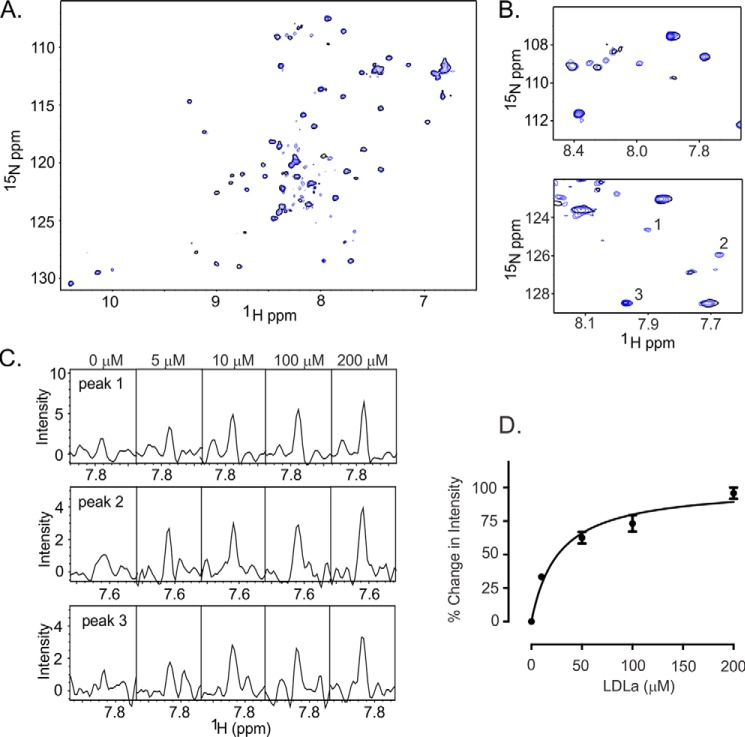
The ability of the LDLa module to outcompete the H2 relaxin/EL1/EL2-GB1 complex in the pulldown assays (Fig. 3) suggested that the module interacts with the ELs and potentially overlaps the H2 relaxin binding site. To investigate this further, we titrated 15N EL1/EL2-GB1 with unlabeled LDLa module. In a similar manner to the relaxin experiment, ∼20 resonances appeared to increase in intensity upon the addition of LDLa indicative of an interaction (Fig. 6). Because the LDLa module requires Ca2+ for maintaining a folded structure, the solution conditions differ for Figs. 5 and 6. We plotted the averaged intensity change of the 20 resonances over the titration and estimated the Kd of 28.2 ± 3.5 μm (Fig. 6C).
FIGURE 6.
15N HSQC spectrum of EL1/EL2-GB1 demonstrating LDLa-dependent intensity increases and appearance of resonances indicative of an interaction. The data were acquired in 100 mm Tris, 10 mm CaCl2, pH 6.8, at 40 °C. A, overlay of the 15N HSQC spectra of EL1/EL2-GB1 with 0 (single black contour) and 100 μm LDLa module (blue contours) demonstrating resonances appearing and increasing in intensity upon the addition of the LDLa module. B, expansions of the 15N HSQC spectra in A demonstrating resonances appearing and increasing in intensity upon the addition of 100 μm LDLa. C, resonances numbered in B are shown in cross-section at 0, 5, 10, 100, and 200 μm LDLa, demonstrating the dose dependence of the intensity changes. D, the averaged peak intensity change for 20 resonances within the spectra that show intensity increases upon addition of LDLa with a Kd of 28.2 ± 3.2 μm.
We also acquired the reverse experiment, titrating 15N LDLa with EL1/EL2-GB1. Because the scaffold is not as soluble as the LDLa, titration was only possible to 1:1 molar equivalent. Although chemical shift changes are small, four resonances show significant shifts: His24, Asp29, Glu37, and Asn39 (Fig. 7). In addition, the residues Ser6 and Thr16 show small although not significant shifts (Fig. 7). These chemical shifts differences are consistent with the predicted weak binding of ∼30 μm Kd from the previous titration. The most significant differences notably map to the C-terminal region of the LDLa module (Fig. 7).
FIGURE 7.
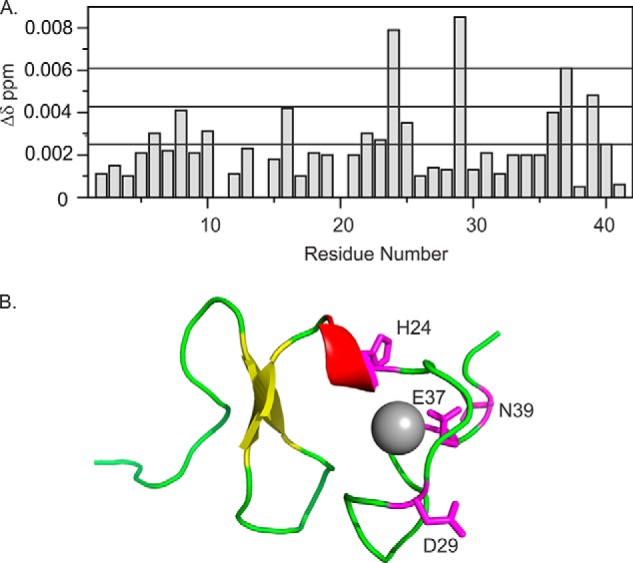
A, chemical shift differences following a titration of 15N-labeled LDLa with 1:1 of EL1/EL2-GB1. Chemical shift differences were calculated by Δδ ppm = ((Δ1H)2 + (0.15Δ15N)2)1/2. The three lines are the mean chemical shift difference and the first and second standard deviations. B, residues whose 1H,15N resonances (assignments are from BioMagResbank Code 7321 (9)) show the most significant chemical shift changes are mapped onto a model of the LDLa module of RXFP1 (Protein Data Bank code 2jm4).
Site-directed Mutagenesis of EL2 Phenylalanine in Full-length RXFP1 and EL1/EL2-GB1
To probe for residues that are specific for interactions with H2 relaxin, site-directed mutants of Gly561, Val562, and Phe564 of EL2 in full-length RXFP1 were prepared, and transient transfections were made and assessed for activity. These residues were chosen because they are highly conserved in both RXFP1 and RXFP2 sequences and straddle Cys563, a part of the disulfide between EL1 and EL2. The double mutant RXFP1 G561A/V562A showed signaling characteristic of WT RXFP1 via cAMP in response to H2 relaxin stimulation; however, RXFP1 F564A was unable to signal (Fig. 8A). Because RXFP1 F564A showed significantly poorer cell surface expression (58.2 ± 6.6% WT RXFP1 expression, p < 0.001; Fig. 8B), an additional mutation, RXFP1 F564Y, was prepared. This mutation showed normal cell surface expression and normal signaling in response to H2 relaxin (Fig. 8A). These results suggest that the phenylalanine adjacent to the disulfide forming cysteine may be important for RXFP1 function; however, whether it interacts with H2 relaxin or simply effects the structure of the TM domain is not clear.
FIGURE 8.
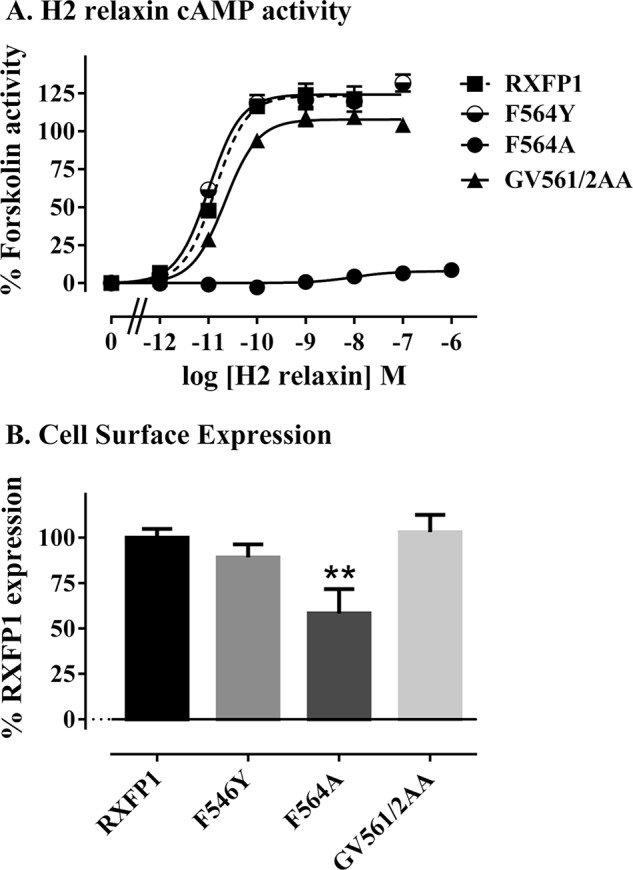
cAMP activity (A) and cell surface expression (B) of RXFP1 EL2 mutant receptors in transient transfection assays. Activity data are expressed as percentages of 5 μm forskolin response, and cell surface expression data are expressed as percentages of RXFP1 expression and are from at least three independent assays with triplicate determinations within each assay.
Therefore, we prepared similar mutants of this phenylalanine in the EL1/EL2-GB1 scaffold (Phe82 in Fig. 1 is equivalent to Phe564 in full-length receptor) and characterized their structures by CD and their interaction with H2 relaxin by streptavidin pulldown assays and NMR titrations. The CD spectra of EL1/EL2-GB1 F82Y had both a similar content of secondary structure and stability to EL1/EL2-GB1, whereas EL1/EL2-GB1 F82A showed a similar content of secondary structure to EL1/EL2-GB1cs, suggesting a loss of structure (Table 1). Notably the stability of EL1/EL2-GB1 F82A was comparable with EL1/EL2-GB1. Consequently, these data suggest that mutating the phenylalanine to alanine is structurally perturbing.
Pulldown assays using biotinylated H2 relaxin showed that consistent with the activity assays, EL1/EL2-GB1 F82A did not interact with H2 relaxin, whereas EL1/EL2-GB1 F82Y behaved similar to EL1/EL2-GB1 (Fig. 9). 15N HSQC spectra of both EL1/EL2-GB1 F82A and F82Y showed fewer peaks than EL1/EL2-GB1 (data not shown). Although peaks, consistent with folded GB1, were retained, compared with EL1/EL2-GB1 fewer resonances were observed in the unstructured region of 7.5–8.5 ppm, which we have tentatively attributed to the loop residues. Notably, the indole NH of the EL1 Trp is split into a weak resonance at 9.95 ppm and an intense resonance at 10.1 ppm for both mutants, which may reflect cis-trans isomerism of the Pro in EL2, similar to what was observed for EL1/EL2-GB1cs. Importantly, the shift of the Trp indole resonance suggests that the Trp of EL1 and the Phe of EL2 may interact. Consistent with the pulldown assays, titration of 15N EL1/EL2-GB1 F82A showed little or no change to resonances, supporting that this construct does not bind H2 relaxin, whereas for EL1/EL2-GB1 F82Y, a number of new resonances appear, similar to what was observed for EL1/EL2-GB1 (Fig. 10). Changes of intensity for 14 peaks were clearly detected, and fitting to a saturation binding curve gives a Kd of 2.5 ± 0.3 μm, similar to that noted for EL1/EL2-GB1.
FIGURE 9.
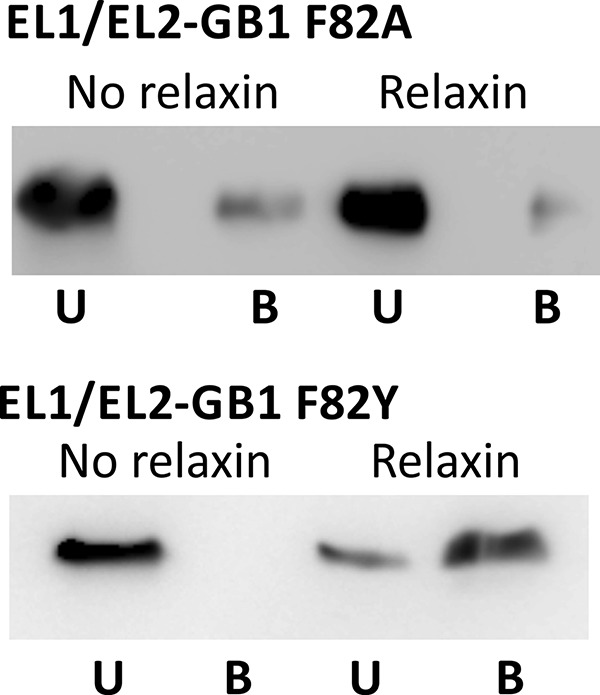
Streptavidin pulldown assay to determine relaxin binding to EL1/EL2-GB1 F82A and F82Y. In the first panels, both mutants did not interact with streptavidin resin alone. In the second panels, EL1/EL2-GB1 F82Y was able to be pulled down in the presence of biotinylated H2 relaxin similar to WT-EL1/EL2-GB1. EL1/EL2-F82A was unable to bind biotinylated H2 relaxin as seen with the EL1/EL2-GB1cs and tGB1 proteins. U, unbound fraction; B, bound fraction to streptavidin beads. The data are from one representative experiment of three independent experiments.
FIGURE 10.
15N HSQC spectrum demonstrating H2 relaxin interacts with EL1/EL2-GB1 F82Y and not EL1/EL2-GB1F82A. The data were acquired in 50 mm NaH2PO4, pH 6.8, at 40 °C. A, overlay of the 15N HSQC spectra of EL1/EL2-GB1 F82Y with 0 (single black contour) and 10 μm H2 relaxin (blue contours) demonstrating resonances appearing and increasing in intensity upon the addition of H2 relaxin. B, expansion of a region of the overlay of EL1/EL2-GB1 F82Y at 0 and 10 μm H2 relaxin. C, resonances numbered in B are shown in cross-section in C at 0, 1, 5, 10, 50, and 100 μm H2 relaxin, demonstrating the dose dependence of the intensity changes. D, overlay of the 15N HSQC spectra of EL1/EL2-GB1 F82A with 0 (single black contour) and 10 μm H2 relaxin (red contours). E, expansion of a region of the overlay of EL1/EL2-GB1F82A at 0 and 10 μm H2 relaxin showing no dose dependence changes to the spectra. F, the average change in intensity of 14 15N HSQC peaks of EL1/EL2-GB1 F82Y with the addition of H2 relaxin (Kd of 2.5 ± 0.3 μm). No peaks from EL1/EL2-GB1 F82A were able to exhibit the same response, indicating no interaction between EL1/EL2-GB1F82A and H2 relaxin, confirming the results from the pulldown assay (Fig. 9).
Site-directed Mutagenesis of EL1 Tryptophan and EL2 Proline in Full-length RXFP1
The 15N HSQC NMR experiments using the scaffold revealed dose-dependent changes in intensity of a resonance attributed to the EL1 tryptophan upon addition of H2 relaxin. In addition, mutation of the EL2 Phe resulted in loss of interaction with H2 relaxin and chemical shift changes to the indole peak of this Trp. These data suggest that the EL2 Phe and EL1 Trp may interact with H2 relaxin. To investigate the role of these residues further, mutations at Trp479 and an additional F564L mutation were introduced into full-length RXFP1. Because our mutations of Gly561 and Val562 showed no change to signaling, suggesting that residues on the N-terminal side of Cys563 site are not a part of the binding site, we also mutated Pro565, the next residue C-terminal of Phe564 to further investigate H2 relaxin interactions with that region of EL2. Because the F564A mutation showed poor expression in transient transfections and to aid in characterization of new mutations, HEK-293T cells stably expressing mutant receptors were prepared and characterized for H2 relaxin binding and signaling in response to H2 relaxin and the small molecule allosteric modulator of RXFP1, ML290 (31).
Two substitutions were made to RXFP1 at Trp479: alanine, which removed the whole side chain, and leucine, which conserved the hydrophobic nature of tryptophan. Interestingly, the W479A mutant was unable to signal via cAMP in response to H2 relaxin at concentrations of up to 10 μm H2 relaxin (Fig. 11A and Table 2). To validate the functional integrity and structure of the TM domain, the response of W479A to the allosteric site agonist ML290 (13) was measured and showed that the mutant was responsive to ML290 but with a significant reduction in potency (pEC50 of 6.30 ± 0.34 for W479A and 7.04 ± 0.12 for WT RXFP1; p < 0.001; Fig. 11B and Table 2). The Emax in response to ML290 was only 31% of the wild-type response, suggesting either lower cell surface expression of this variant or some type of structure perturbation affecting receptor function. Relaxin binding was therefore performed, which demonstrated that the W479A mutant was still able to bind H2 relaxin but exhibited a 10-fold reduction in binding affinity (Kd of 8.23 ± 2.7 nm compared with 0.64 ± 0.05 nm for wild-type RXFP1; p < 0.001; Fig. 12, A and B, and Table 2). Additionally, the Bmax value indicated that there was far less functional receptor at the cell surface (Bmax of 14.2 ± 5.7% for W479A versus WT RXFP1; p < 0.001). A similar effect was seen with the more conservative W479L mutant with a reduced H2 relaxin binding affinity (Kd of 8.69 ± 2.7 nm compared with 0.64 ± 0.05 nm for wild-type RXFP1; p < 0.001; Fig. 12, A and B, and Table 2) and less functional receptor at the cell surface (Bmax of 14.0 ± 4.1% for W479A versus WT RXFP1; p < 0.001). However, W479L was able to signal in response to H2 relaxin, albeit with a reduced ligand potency (pEC50 of 10.39 ± 0.13 for W479L and 10.99 ± 0.03 for WT RXFP1; p < 0.05; Fig. 11A and Table 2) and reduced Emax (86.57 ± 16.2% for W479L and 144.8 ± 19.8 for WT RXFP1; p < 0.05). A similar reduction in ligand potency (pEC50 of 6.32 ± 0.19 for W479L; p < 0.01 versus RXFP1) and Emax (40.3 ± 13.9 for W479L; p < 0.001 versus RXFP1) was seen in response to ML290 (Fig. 11B and Table 2). Hence the mutation of Trp479 has distinct effects on H2 relaxin binding and signaling that are partially related to the reduced cell surface expression of the variant.
FIGURE 11.
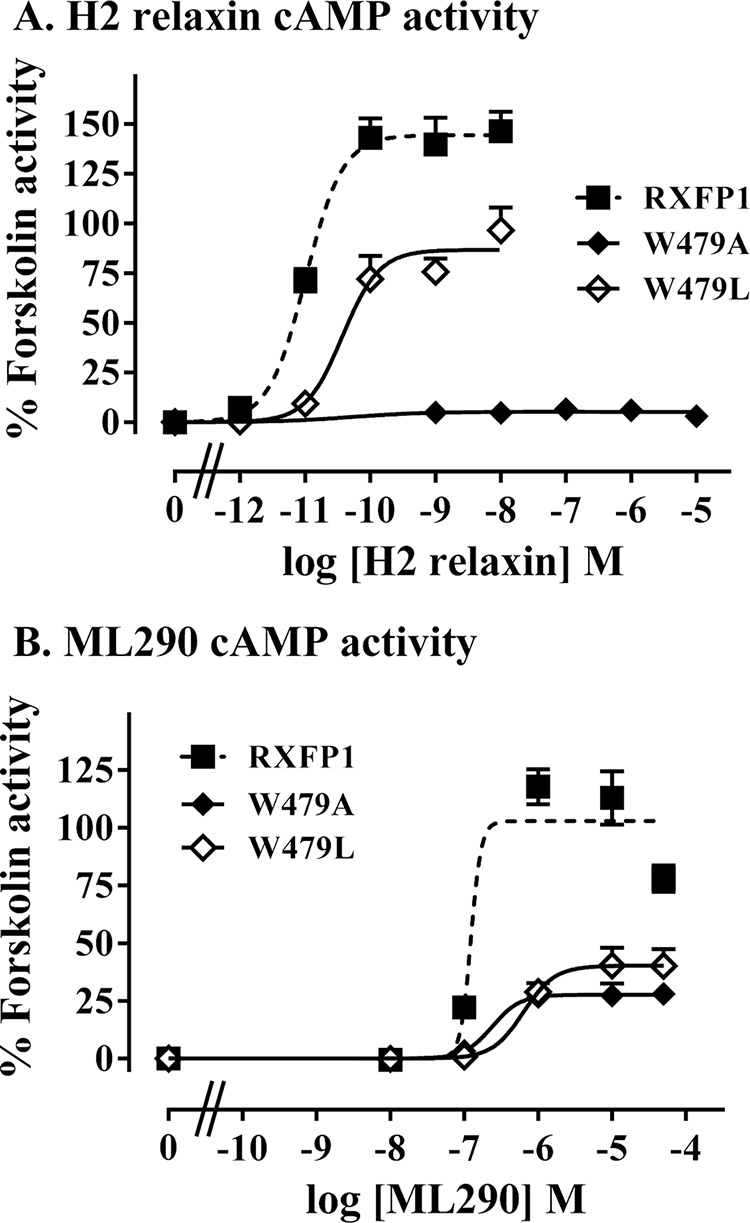
cAMP activity assays demonstrating the response of Trp479 mutant receptor semistable cells W479A and W479L compared with wild-type RXFP1 stably expressing cells upon stimulation with H2 relaxin (A) or ML290 (B). The data are expressed as percentages of 5 μm forskolin response pooled from at least three independent assays (actual numbers in Table 2) with triplicate determinations within each assay.
TABLE 2.
Comparison of mutant RXFP1 receptor cAMP activity and Eu-H2 relaxin binding to wild-type RXFP1
cAMP activity has been tested with H2 relaxin and ML290 with the results expressed as ligand potency (pEC50) and maximum cAMP response (Emax; % forskolin stimulated activity). Saturation binding was performed with Eu-labeled H2 relaxin, and the results are expressed as affinity (Kd) and Bmax (% RXFP1). The data are expressed as means ± S.E., and replicates for each assay are in parentheses.
| Receptor | cAMP activity |
Eu-H2 relaxin binding |
||||
|---|---|---|---|---|---|---|
| H2 relaxin |
ML290 |
|||||
| pEC50 | Emax | pEC50 | Emax | Kd | Bmax | |
| nM | % RXFP1 | |||||
| RXFP1 | 10.99 ± 0.03 (3) | 144.8 ± 19.8 (3) | 7.04 ± 0.12 (5) | 102.8 ± 12.8 (4) | 0.64 ± 0.05 (7) | 100 ± 18.2 (4) |
| F564A | 8.52 ± 0.41 (3)a | 67.0 ± 3.0 (3)b | 6.02 ± 0.07 (5)a | 81.3 ± 13.0 (5) | 5.44 ± 2.55 (4)c | 25.8 ± 6.3 (4)a |
| F564L | 10.21 ± 0.06 (4)b | 126.5 ± 20.3 (4) | 6.24 ± 0.15 (4)b | 90.2 ± 6.5 (4) | 1.77 ± 0.36 (4) | 56.3 ± 4.1 (4)a |
| P565A | 9.48 ± 0.08 (4)a | 116.6 ± 3.5 (4) | 6.89 ± 0.07 (3) | 103.7 ± 6.3 (3) | 1.16 ± 0.15 (4) | 31.8 ± 4.2 (4)a |
| W479A | No activity (3) | No activity (3) | 6.30 ± 0.34 (4)b | 31.0 ± 6.4 (4)a | 8.23 ± 2.70 (4)a | 14.2 ± 5.7 (4)a |
| W479L | 10.39 ± 0.13 (3)c | 86.57 ± 16.2 (3)c | 6.32 ± 0.19 (4)b | 40.3 ± 13.9 (4)a | 8.69 ± 1.51 (4)a | 14.0 ± 4.1 (4)a |
a p < 0.001 versus RXFP1.
b p < 0.01 versus RXFP1.
c p < 0.05 versus RXFP1.
FIGURE 12.
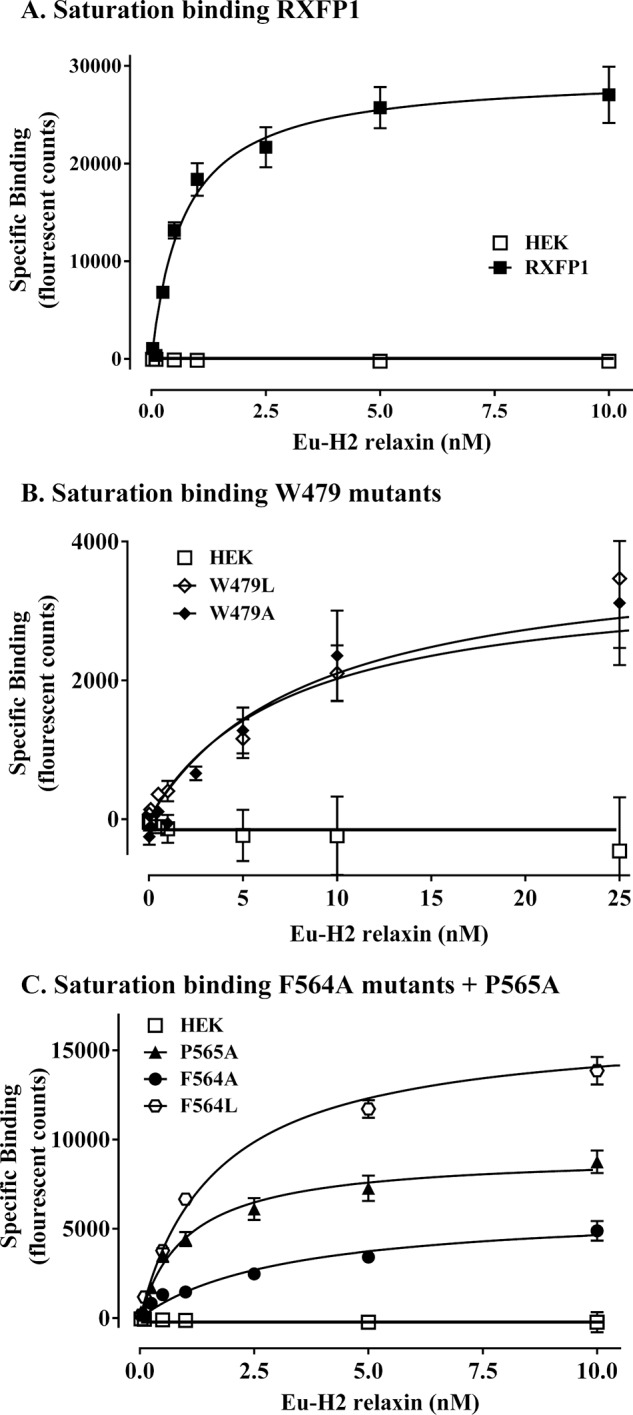
Comparison of H2 relaxin binding of mutant receptors compared with wild-type RXFP1 using Eu-H2 relaxin saturation binding assays. A, wild-type RXFP1 stably expressing cell line specific binding compared with parental HEK-293T cells. B, Trp479 mutant receptor semistable cells W479A and W479L. C, Phe564 mutant receptor semistable cells F564A and F564L compared with P565 mutant receptor semistable cells P565A. The data are pooled from at least three independent assays (actual numbers in Table 2) with triplicate determinations within each assay.
In addition to preparing a stable F564A mutant, we also replaced this residue with leucine, thus retaining hydrophobicity and side chain bulk but removing the aromaticity. Unlike transient expression, stable expression of F564A demonstrated signaling in response to H2 relaxin, although there was a significant decrease in ligand-mediated potency (pEC50 of 8.52 ± 0.41; p < 0.001; Fig. 13A and Table 2) and efficacy (Emax 67.0 ± 3.0%; p < 0.01; Fig. 13A and Table 2) in comparison to RXFP1. Interestingly, F564A expressing cells responded to ML290 with decreased potency (pEC50 6.02 ± 0.07; Fig. 13B and Table 2) but with no significant change in efficacy (Emax 81.3 ± 13%; Fig. 13B and Table 2). Similar to the Trp mutants, F564A showed reduced affinity to H2 relaxin (Kd 5.44 ± 2.55 nm, p < 0.05; Fig. 12B and Table 2) but also with a significantly lower Bmax (25.8 ± 6.3%, p < 0.001), demonstrating less functional receptor at the cell surface. F564L, however, showed binding to H2 relaxin similar to wild type (Fig. 12B and Table 2) with improved but still significantly lower levels of cell surface functional receptor (Bmax 56.3 ± 4.1%, p < 0.001). This mutant had significantly lower ligand potency (pEC50 10.21 ± 0.06) but an efficacy similar to wild type. The final mutant P565A showed significantly reduced potency in response to H2 relaxin (pEC50 of 9.48 ± 0.08 versus RXFP1; p < 0.001; Fig. 13A and Table 2), and although the efficacy was also reduced, this was not significant. However, this reduced H2 relaxin activity was not associated with a reduced affinity for H2 relaxin (Fig. 12C and Table 2), although the cell surface expression of functional receptors was lower (Bmax of 31.8 ± 4.2%; p < 0.001). In addition there was no difference in the potency or efficacy of ML290 on P565A-expressing cells compared with WT RXFP1 (Fig. 13B and Table 2). Consequently, the P565A mutation does not seem to alter the functional integrity of the TM domain, suggesting that the residue may be involved in H2 relaxin-mediated receptor activation.
FIGURE 13.
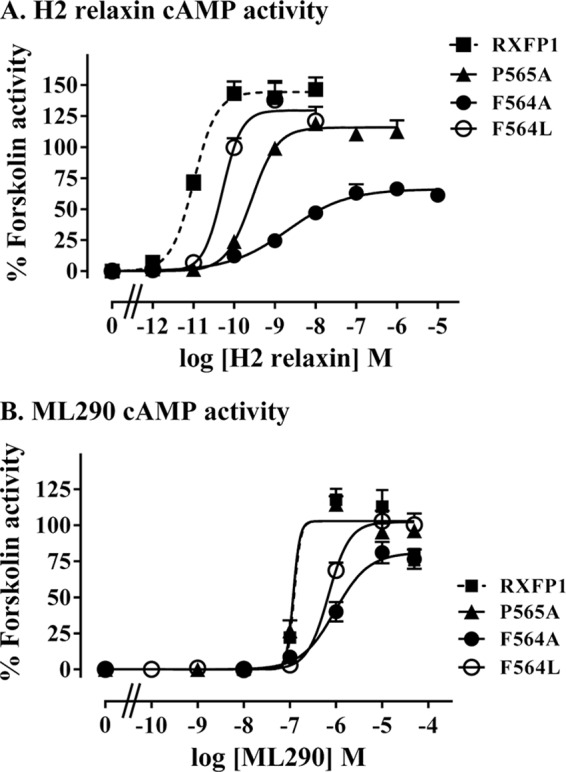
cAMP activity assays demonstrating the response of Phe564 mutant receptor semistable cells F564A, F564L, and P565A mutant receptor semistable cells compared with wild-type RXFP1 stably expressing cells upon stimulation with H2 relaxin (A) or ML290 (B). The data are expressed as percentages of 5 μm forskolin response pooled from at least three independent assays (actual numbers in Table 2) with triplicate determinations within each assay.
DISCUSSION
GPCRs have a highly conserved structure consisting of seven transmembrane helices that coordinate together to transmit a signal from one side of a membrane to the other facilitating signal propagation. These helices are held together by a series of intracellular loops and ELs that coordinate helix dynamics facilitating activation. However, it is becoming clear that ELs play much more than just a structural role with identification of ligand binding sites (32), agonist/antagonist activity determination (33), and constitutive activity regulation within these largely unstudied regions of GPCRs (30, 34).
Chimeric receptors (7, 15, 35) and site-directed mutagenesis, including cysteine reactivity and photo affinity cross-linking (30), have been applied for the identification of EL residues required for ligand recognition and receptor activation (32, 33). Synthetic peptides consisting of individual loops have been prepared, often tethered at the ends, to investigate interactions with ligands using NMR (36, 37). However, this is complicated by the growing appreciation and evidence from the x-ray crystal structures that the ELs are able to interact with each other, and the conservation of a disulfide bond between the C terminus of EL1 and the middle of EL2 suggests that more than just the peptide sequence may be required for ligand recognition.
The large membrane-bound protein OmpA has been used successfully as a scaffold to display the ELs of GPCRs to investigate interactions between extracellular elements of the neuropeptide Y receptor and its ligand (38, 39). Also a combination of recombinant, enzymatic and chemical synthetic approaches were used to build a scaffold displaying elements of the corticotrophin-releasing factor receptor type 1 (40). Although all the loops and the N terminus were simultaneously displayed, these scaffolds were either membrane-bound and/or remained difficult to purify and work with.
In this study, we describe an approach utilizing a soluble protein scaffold system successfully used to investigate interactions between the extracellular elements of CCR3, another GPCR, with its peptide ligand eotaxin (11, 41). Similarly, we incorporated EL1 and EL2 of RXFP1 onto surface-exposed loops of a thermostabilized variant of the B1 immunoglobulin binding domain of streptococcal protein G (EL1/EL2-GB1). Advantages of the EL1/EL2-GB1 scaffold include its solubility, small size, and the inherent stability of the GB1 fold. The proteins were relatively easy to express and purify compared with the OmpA scaffold, and the small size and solubility allow for the use of multiple biophysical techniques employed for detection of an interaction between the displayed loops and the ligand of interest.
EL1/EL2-GB1 was designed to investigate the specific interactions occurring at the ELs with the cognate ligand relaxin in addition to the LDLa module, which has the potential to act as a tethered ligand. We observed in both pulldown and solution NMR experiments an interaction between EL1/EL2-GB1 and H2 relaxin, which is not observed for tGB1 alone and, most importantly, for a construct lacking the disulfide bond between EL1 and EL2. These results indicate that the structural integrity of EL2 and the C-terminal end of EL1 is necessary for this interaction. The LDLa module was shown both to compete with biotinylated H2 relaxin for EL1/EL2-GB1 and to interact with 15N-EL1/EL2-GB1 in solution NMR experiments. As far as we know, these latter experiments are the first to provide evidence that the LDLa module is able to interact with the ELs of RXFP1, particularly EL1 and EL2. This has implications for the understanding of molecular mechanisms surrounding H2 relaxin-induced receptor activation.
To date, site-directed mutagenesis of residues within the LRRs of the extracellular domains for RXFP1 and the closely related RXFP2 and reciprocal mutations within the cognate ligand relaxin and INSL3 have revealed sites of ligand interaction (6, 42, 43). Additionally, studies on relaxin-3 interactions with chimeric RXFP1 and RXFP2 receptors have suggested another, lower affinity site of interaction within the TM domain including EL2 (7, 15). Modeling of the extracellular domain interaction in combination with the possibility of an EL interaction demonstrated the possibility of the LDLa module also having access to the TM domain of receptors (44). Functional characterization of LDLa-less, chimeric, and mutant receptors has demonstrated a critical functional role for the LDLa module (10, 24).
Because of the inability of concentrating EL1/EL2-GB1 beyond ∼200 μm, 15N-LDLa was titrated to only equimolar with EL1/EL2-GB1. Nevertheless, small chemical shift differences were localized to the C-terminal region of the LDLa module, implying that this region interacts with EL1/EL2 of RXFP1. In our previous studies using site-directed mutagenesis and both knock-in and -out functional analyses, we showed that a hydrophobic surface in the N-terminal region of the RXFP1 LDLa comprising Leu7, Tyr9, and Lys17 were important for receptor activity (9, 10). Importantly, the knock-out mutagenesis experiments (10) could not abolish activation, suggesting that there were critical residues that we had not revealed. Furthermore, our recent study where we performed knock-in and -out functional analyses of the RXFP2 LDLa suggests that the C-terminal region of the RXFP2 LDLa module is the main driver of activation of this receptor (45). Hence, it is likely that the C-terminal region of the RXFP1 LDLa is involved in receptor activation, and because the N-terminal region did not appear to be affected in the EL1/EL2-GB1 titration, it is tempting to speculate that Leu7, Tyr9, and Lys17 may interact at a site within the TM not presented by the scaffold protein. Importantly, most of the residues that appear perturbed in the titration are also thought to contribute to the Ca2+ ligation. This region is involved in protein-protein interactions for other proteins that contain LDLa modules (46–48). However, it is difficult to test the importance of these residues through mutagenesis because their involvement in Ca2+ ligation is essential for maintaining global fold and stability of this module.
These studies informed the interrogation of specific EL mutations in the whole receptor, Trp497 on EL1 and Phe564 and Pro565 on EL2, within full-length RXFP1. Mutations of all of the EL residues had profound effects on the signaling of the receptors in response to H2 relaxin. However, all mutants, except P565A, also showed significant perturbation of activation by the small molecule activator ML290. Importantly, this compound activates RXFP1 by an allosteric mechanism, potentially involving EL3, which does not require the LDLa module (31) and was used as a control for potential disruption in EL structure. Because ML290 activity and H2 relaxin binding are not significantly different for P565A, but H2 relaxin induced signaling is perturbed, this indicates that this residue may be directly involved in the interaction with the LDLa module. It is more difficult to draw conclusions on the role of both Trp497 in EL1 and Phe564 in EL2 because mutation of these residues also leads to changes in ML290 activation, suggesting structural perturbations in the TM domain. However, whereas the ML290 signaling ability of both W479A and W479L is similar, both of the receptors have decreased H2 relaxin affinity and importantly, W479A is completely inactive, whereas W479L demonstrates reduced activity commensurate with the decreased H2 relaxin affinity. Hence it is possible that Trp479 is involved in an interaction with H2 relaxin. Likewise, although the ML290 signaling ability of both F564A and F564L is similar, F564A demonstrates markedly reduced activity in response to H2 relaxin, suggestive of an effect on the LDLa interaction. This would be consistent with the reduced activity of P565 and suggests the LDLa may be interacting with both of these residues. Confirmation of these potential interactions awaits further studies; however, the current study highlights the clear importance of the RXFP1 EL structure and potential direct amino acid contacts for both H2 relaxin binding and LDLa-mediated activation.
The interaction with the LDLa module also highlights a new target for therapeutic modulation of RXFP1. Some studies have already highlighted the potential therapeutic role because the expression of soluble LDLa module was shown to act as an antagonist at RXFP1 resulting in a decrease in RXFP1 signaling in prostate tumor cells, inhibiting tumorogenesis (49). The LDLa module is a feature unique to RXFP1 (and closely related RXFP2) and is not observed in any other human GPCRs, indicating ligands targeted to this module could be highly specific to modulation of RXFP1-mediated physiologies.
In conclusion, this scaffold approach has provided a unique means of investigating interactions between regions of GPCRs and their ligands independently from other, high affinity binding sites, which may be difficult to resolve within the full receptor. Specifically, the role of interactions at the ELs of RXFP1 and the contribution they make toward receptor activation has been explored. To this end, a scaffold protein was successfully utilized as a tool to display the ELs of interest, in a soluble system. Although an interaction with H2 relaxin was confirmed, new evidence supports an interaction between the ELs of the receptor with the LDLa module. Whether H2 relaxin and the LDLa module simultaneously interact with the ELs to activate the receptor remains to be resolved. These observations provide important information for future drug design at this receptor.
Acknowledgments
We thank Prof Martin Stone (Monash University) for the donation of tGB1 and original scaffold constructs in addition to design advice in addition to Tania Ferraro and Sharon Layfield for technical assistance. We also thank Jingbo Xiao and Juan Marugan (National Institutes of Health Chemical Genomics Center, National Center for Advancing Translational Sciences, National Institutes of Health) and Alexander Agoulnik (Department of Cellular Biology and Pharmacology, Herbert Wertheim College of Medicine, Florida International University, Miami, FL) for the kind gift of ML290.
This work was supported by National Health and Medical Research Council of Australia Project Grants 628427 and 1043750 (to R. A. D. B. and P. R. G.) by the Victorian Government Operational Infrastructure Support Program, and through instrument funding from the State of Victoria, Australian Research Council, and the Rowden White Foundation.
- GPCR
- G-protein coupled receptor
- RXFP1
- relaxin family peptide receptor 1
- EL1/EL2-GB1
- soluble scaffold displaying the extracellular loops of RXFP1
- GB1
- B1 immunoglobulin binding domain of streptococcal protein G
- tGB1
- thermostabilized GB1
- EL
- extracellular loop
- LRR
- leucine-rich repeat
- LDLa
- low density lipoprotein class A
- TM
- transmembrane
- LGR
- LRR-containing GPCR
- HSQC
- heteronuclear single quantum coherence spectroscopy.
REFERENCES
- 1. Bathgate R. A., Halls M. L., van der Westhuizen E. T., Callander G. E., Kocan M., Summers R. J. (2013) Relaxin family peptides and their receptors. Physiol. Rev. 93, 405–480 [DOI] [PubMed] [Google Scholar]
- 2. Teerlink J. R., Cotter G., Davison B. A., Felker G. M., Filippatos G., Greenberg B. H., Ponikowski P., Unemori E., Voors A. A., Adams K. F., Jr., Dorobantu M. I., Grinfeld L. R., Jondeau G., Marmor A., Masip J., Pang P. S., Werdan K., Teichman S. L., Trapani A., Bush C. A., Saini R., Schumacher C., Severin T. M., Metra M. (2013) Serelaxin, recombinant human relaxin-2, for treatment of acute heart failure (RELAX-AHF): a randomised, placebo-controlled trial. Lancet 381, 29–39 [DOI] [PubMed] [Google Scholar]
- 3. Glinka A., Dolde C., Kirsch N., Huang Y.-L., Kazanskaya O., Ingelfinger D., Boutros M., Cruciat C.-M., Niehrs C. (2011) LGR4 and LGR5 are R-spondin receptors mediating Wnt/[beta]-catenin and Wnt/PCP signalling. EMBO Rep. 12, 1055–1061 [DOI] [PMC free article] [PubMed] [Google Scholar]
- 4. Hsu S. Y., Kudo M., Chen T., Nakabayashi K., Bhalla A., van der Spek P. J., van Duin M., Hsueh A. J. (2000) The three subfamilies of leucine-rich repeat-containing G protein-coupled receptors (LGR): identification of LGR6 and LGR7 and the signaling mechanism for LGR7. Mol. Endocrinol. 14, 1257–1271 [DOI] [PubMed] [Google Scholar]
- 5. Büllesbach E. E., Schwabe C. (2000) The relaxin receptor-binding site geometry suggests a novel gripping mode of interaction. J. Biol. Chem. 275, 35276–35280 [DOI] [PubMed] [Google Scholar]
- 6. Büllesbach E. E., Schwabe C. (2005) The trap-like relaxin-binding site of the leucine-rich G-protein-coupled receptor 7. J. Biol. Chem. 280, 14051–14056 [DOI] [PubMed] [Google Scholar]
- 7. Sudo S., Kumagai J., Nishi S., Layfield S., Ferraro T., Bathgate R. A., Hsueh A. J. (2003) H3 relaxin is a specific ligand for LGR7 and activates the receptor by interacting with both the ectodomain and the exoloop 2. J. Biol. Chem. 278, 7855–7862 [DOI] [PubMed] [Google Scholar]
- 8. Hsu S. Y., Nakabayashi K., Nishi S., Kumagai J., Kudo M., Sherwood O. D., Hsueh A. J. (2002) Activation of orphan receptors by the hormone relaxin. Science 295, 671–674 [DOI] [PubMed] [Google Scholar]
- 9. Hopkins E. J., Layfield S., Ferraro T., Bathgate R. A., Gooley P. R. (2007) The NMR solution structure of the relaxin (RXFP1) receptor lipoprotein receptor class A module and identification of key residues in the N-terminal region of the module that mediate receptor activation. J. Biol. Chem. 282, 4172–4184 [DOI] [PubMed] [Google Scholar]
- 10. Kong R. C., Petrie E. J., Mohanty B., Ling J., Lee J. C., Gooley P. R., Bathgate R. A. (2013) The Relaxin Receptor (RXFP1) Utilizes hydrophobic moieties on a signaling surface of its N-terminal low density lipoprotein class A module to mediate receptor activation. J. Biol. Chem. 288, 28138–28151 [DOI] [PMC free article] [PubMed] [Google Scholar]
- 11. Datta A., Stone M. J. (2003) Soluble mimics of a chemokine receptor: chemokine binding by receptor elements juxtaposed on a soluble scaffold. Protein Sci. 12, 2482–2491 [DOI] [PMC free article] [PubMed] [Google Scholar]
- 12. Diepenhorst N. A., Gooley P. R., Stone M. J., Bathgate R. A. (2013) Development of a scaffold displaying exoloops of RXFP1. Ital. J. Anat. Embryol. 118, 1–3 [PubMed] [Google Scholar]
- 13. Chen C. Z., Southall N., Xiao J., Marugan J. J., Ferrer M., Hu X., Jones R. E., Feng S., Agoulnik I. U., Zheng W., Agoulnik A. I. (2013) Identification of small-molecule agonists of human relaxin family receptor 1 (RXFP1) by using a homogenous cell-based cAMP assay. J. Biomol. Screen 18, 670–677 [DOI] [PMC free article] [PubMed] [Google Scholar]
- 14. Malakauskas S. M., Mayo S. L. (1998) Design, structure and stability of a hyperthermophilic protein variant. Nat. Struct. Biol. 5, 470–475 [DOI] [PubMed] [Google Scholar]
- 15. Halls M. L., Bond C. P., Sudo S., Kumagai J., Ferraro T., Layfield S., Bathgate R. A., Summers R. J. (2005) Multiple binding sites revealed by interaction of relaxin family peptides with native and chimeric relaxin family peptide receptors 1 and 2 (LGR7 and LGR8). J. Pharmacol. Exp. Ther. 313, 677–687 [DOI] [PubMed] [Google Scholar]
- 16. Zheng L., Baumann U., Reymond J. L. (2004) An efficient one-step site-directed and site-saturation mutagenesis protocol. Nucleic Acids Res. 32, e115. [DOI] [PMC free article] [PubMed] [Google Scholar]
- 17. Marley J., Lu M., Bracken C. (2001) A method for efficient iostopic labeling of recombinant proteins. J. Biomol. NMR 20, 71–75 [DOI] [PubMed] [Google Scholar]
- 18. Sreerama N., Woody R. W. (2000) Estimation of protein secondary structure from circular dichroism spectra: comparison of CONTIN, SELCON, and CDSSTR methods with an expanded reference set. Anal. Biochem. 287, 252–260 [DOI] [PubMed] [Google Scholar]
- 19. Hossain M. A., Lin F., Zhang S., Ferraro T., Bathgate R. A., Tregear G. W., Wade J. D. (2006) Regioselective disulfide solid phase synthesis, chemical characterization and in vitro receptor binding activity of equine relaxin. Int. J. Peptide Res. Ther. 12, 211–215 [Google Scholar]
- 20. Akhter Hossain M., Bathgate R. A., Kong C. K., Shabanpoor F., Zhang S., Haugaard-Jönsson L. M., Rosengren K. J., Tregear G. W., Wade J. D. (2008) Synthesis, conformation, and activity of human insulin-like peptide 5 (INSL5). ChemBioChem 9, 1816–1822 [DOI] [PMC free article] [PubMed] [Google Scholar]
- 21. Hopkins E. J., Bathgate R. A., Gooley P. R. (2005) The human LGR7 low-density lipoprotein class A module requires calcium for structure. Ann. N.Y. Acad. Sci. 1041, 27–34 [DOI] [PubMed] [Google Scholar]
- 22. Delaglio F., Grzesiek S., Vuister G. W., Zhu G., Pfeifer J., Bax A. (1995) NMRPipe: a multidimensional spectral processing system based on UNIX pipes. J. Biomol. NMR 6, 277–293 [DOI] [PubMed] [Google Scholar]
- 23. Johnson B. A. (2004) Using NMRView to visualize and analyze the NMR spectra of macromolecules. In Protein NMR Techniques (Downing A. K., ed) pp. 313–352, Humana Press, Totowa, NJ: [DOI] [PubMed] [Google Scholar]
- 24. Bruell S., Kong R. C., Petrie E. J., Hoare B. L., Wade J. D., Scott D. J., Gooley P. R., Bathgate R. (2013) Chimeric RXFP1 and RXFP2 receptors highlight the similar mechanism of activation utilizing their N-terminal low density lipoprotein class A modules. Front. Endocrinol. (Lausanne) 4, 171. [DOI] [PMC free article] [PubMed] [Google Scholar]
- 25. Shabanpoor F., Bathgate R. A., Belgi A., Chan L. J., Nair V. B., Wade J. D., Hossain M. A. (2012) Site-specific conjugation of a lanthanide chelator and its effects on the chemical synthesis and receptor binding affinity of human relaxin-2 hormone. Biochem. Biophys. Res. Commun. 420, 253–256 [DOI] [PubMed] [Google Scholar]
- 26. Scott D. J., Layfield S., Yan Y., Sudo S., Hsueh A. J., Tregear G. W., Bathgate R. A. (2006) Characterisation of novel splice variants of LGR7 and LGR8 reveals that receptor signalling is mediated by their unique low density lipoprotein class A modules. J. Biol. Chem. 281, 34942–34954 [DOI] [PubMed] [Google Scholar]
- 27. Krogh A., Larsson B., von Heijne G., Sonnhammer E. L. (2001) Predicting transmembrane protein topology with a hidden markov model: application to complete genomes. J. Mol. Biol. 305, 567–580 [DOI] [PubMed] [Google Scholar]
- 28. Hofmann K., Stoffel W. (1993) TMbase: a database of membrane spanning proteins segments. Biol. Chem. Hoppe-Seyler 374, 166 [Google Scholar]
- 29. Néron B., Ménager H., Maufrais C., Joly N., Maupetit J., Letort S., Carrere S., Tuffery P., Letondal C. (2009) Mobyle: a new full web bioinformatics framework. Bioinformatics 25, 3005–3011 [DOI] [PMC free article] [PubMed] [Google Scholar]
- 30. Wheatley M., Wootten D., Conner M. T., Simms J., Kendrick R., Logan R. T., Poyner D. R., Barwell J. (2012) Lifting the lid on GPCRs: the role of extracellular loops. Br. J. Pharmacol. 165, 1688–1703 [DOI] [PMC free article] [PubMed] [Google Scholar]
- 31. Xiao J., Huang Z., Chen C. Z., Agoulnik I. U., Southall N., Hu X., Jones R. E., Ferrer M., Zheng W., Agoulnik A. I., Marugan J. J. (2013) Identification and optimization of small-molecule agonists of the human relaxin hormone receptor RXFP1. Nat. Commun. 4, 1953. [DOI] [PMC free article] [PubMed] [Google Scholar]
- 32. Koole C., Wootten D., Simms J., Miller L. J., Christopoulos A., Sexton P. M. (2012) The second extracellular loop of the human glucagon-like peptide-1 receptor (GLP-1R) has a critical role in GLP-1 peptide binding and receptor activation. J. Biol. Chem. 287, 3642–3658 [DOI] [PMC free article] [PubMed] [Google Scholar]
- 33. Ott T. R., Troskie B. E., Roeske R. W., Illing N., Flanagan C. A., Millar R. P. (2002) Two mutations in extracellular loop 2 of the human GnRH receptor convert an antagonist to an agonist. Mol. Endocrinol. 16, 1079–1088 [DOI] [PubMed] [Google Scholar]
- 34. Klco J. M., Wiegand C. B., Narzinski K., Baranski T. J. (2005) Essential role for the second extracellular loop in C5a receptor activation. Nat. Struct. Mol. Biol. 12, 320–326 [DOI] [PubMed] [Google Scholar]
- 35. Wurch T., Colpaert F. C., Pauwels P. J. (1998) Chimeric receptor analysis of the ketanserin binding site in the human 5-hydroxytryptamine 1D receptor: importance of the second extracellular loop and fifth transmembrane domain in antagonist binding. Mol. Pharmacol. 54, 1088–1096 [DOI] [PubMed] [Google Scholar]
- 36. Déméné H., Granier S., Muller D., Guillon G., Dufour M.-N., Delsuc M.-A., Hibert M., Pascal R., Mendre C. (2003) Active peptidic mimics of the second intracellular loop of the V1A vasopressin receptor are structurally related to the second intracellular rhodopsin loop: a combined 1H NMR and biochemical study. Biochemistry 42, 8204–8213 [DOI] [PubMed] [Google Scholar]
- 37. Dogo-Isonagie C., Lam S., Gustchina E., Acharya P., Yang Y., Shahzad-ul-Hussan S., Clore G. M., Kwong P. D., Bewley C. A. (2012) Peptides from the second extracellular loop of the C-C chemokine receptor type 5 (CCR5) inhibit diverse strains of HIV-1. J. Biol. Chem. 287, 15076–15086 [DOI] [PMC free article] [PubMed] [Google Scholar]
- 38. Walser R., Kleinschmidt J. H., Skerra A., Zerbe O. (2012) β-Barrel scaffolds for the grafting of extracellular loops from G-protein-coupled receptors. Biol. Chem. 393, 1341–1355 [DOI] [PubMed] [Google Scholar]
- 39. Walser R., Kleinschmidt J. H., Zerbe O. (2011) A chimeric GPCR model mimicking the ligand binding site of the human Y1 receptor studied by NMR spectroscopy. ChemBioChem 12, 1690–1693 [DOI] [PubMed] [Google Scholar]
- 40. Pritz S., Kraetke O., Klose A., Klose J., Rothemund S., Fechner K., Bienert M., Beyermann M. (2008) Synthesis of protein mimics with nonlinear backbone topology by a combined recombinant, enzymatic, and chemical synthesis strategy. Angew. Chem. Int. Ed. Engl. 47, 3642–3645 [DOI] [PubMed] [Google Scholar]
- 41. Datta-Mannan A., Stone M. J. (2004) Chemokine-binding specificity of soluble chemokine-receptor analogues: identification of interacting elements by chimera complementation. Biochemistry 43, 14602–14611 [DOI] [PubMed] [Google Scholar]
- 42. Scott D. J., Wilkinson T. N., Zhang S., Ferraro T., Wade J. D. (2007) Defining the LGR8 residues involved in binding insulin-like peptide 3. Mol. Endocrinol. 21, 1699–1712 [DOI] [PubMed] [Google Scholar]
- 43. Scott D. J., Tregear G. W., Bathgate R. A. (2009) Modeling the primary hormone-binding site of RXFP1 and RXFP2. Ann. N.Y. Acad. Sci. 1160, 74–77 [DOI] [PubMed] [Google Scholar]
- 44. Hartley B. J., Scott D. J., Callander G. E., Wilkinson T. N., Ganella D. E., Kong C. K., Layfield S., Ferraro T., Petrie E. J., Bathgate R. A. (2009) Resolving the unconventional mechanisms underlying RXFP1 and RXFP2 receptor function. Ann. N.Y. Acad. Sci. 1160, 67–73 [DOI] [PubMed] [Google Scholar]
- 45. Kong R. C., Bathgate R. A., Bruell S., Wade J. D., Gooley P. R., Petrie E. J. (2014) Mapping key regions of the RXFP2 low-density lipoprotein class-A module that are involved in signal activation. Biochemistry 53, 4537–4548 [DOI] [PubMed] [Google Scholar]
- 46. Dagil R., O'Shea C., Nykjaer A., Bonvin A. M., Kragelund B. B. (2013) Gentamicin binds to the megalin receptor as a competitive inhibitor using the common ligand binding motif of complement type repeats: insight from the nmr structure of the 10th complement type repeat domain alone and in complex with gentamicin. J. Biol. Chem. 288, 4424–4435 [DOI] [PMC free article] [PubMed] [Google Scholar]
- 47. Fisher C., Beglova N., Blacklow S. C. (2006) Structure of an LDLR-RAP complex reveals a general mode for ligand recognition by lipoprotein receptors. Mol. Cell 22, 277–283 [DOI] [PubMed] [Google Scholar]
- 48. Yasui N., Nogi T., Takagi J. (2010) Structural basis for specific recognition of reelin by its receptors. Structure 18, 320–331 [DOI] [PubMed] [Google Scholar]
- 49. Feng S., Agoulnik A. (2011) Expression of LDL-A module of relaxin receptor in prostate cancer cells inhibits tumorigenesis. Int. J. Oncol. 39, 1559–1565 [DOI] [PubMed] [Google Scholar]


