Key Points
GATA1 is downregulated in RPS19-deficient cells and zebrafish through upregulation of p53, TNF-α, and p38 MAPK.
Treatment of rps19-deficient zebrafish with the TNF-α inhibitor etanercept rescues their erythroid and developmental defects.
Abstract
Diamond-Blackfan anemia (DBA) is an inherited disorder characterized by defects in erythropoiesis, congenital abnormalities, and predisposition to cancer. Approximately 25% of DBA patients have a mutation in RPS19, which encodes a component of the 40S ribosomal subunit. Upregulation of p53 contributes to the pathogenesis of DBA, but the link between ribosomal protein mutations and erythropoietic defects is not well understood. We found that RPS19 deficiency in hematopoietic progenitor cells leads to decreased GATA1 expression in the erythroid progenitor population and p53-dependent upregulation of tumor necrosis factor-α (TNF-α) in nonerythroid cells. The decrease in GATA1 expression was mediated, at least in part, by activation of p38 MAPK in erythroid cells and rescued by inhibition of TNF-α or p53. The anemia phenotype in rps19-deficient zebrafish was reversed by treatment with the TNF-α inhibitor etanercept. Our data reveal that RPS19 deficiency leads to inflammation, p53-dependent increase in TNF-α, activation of p38 MAPK, and decreased GATA1 expression, suggesting a novel mechanism for the erythroid defects observed in DBA.
Introduction
Diamond-Blackfan anemia (DBA) is characterized by macrocytic anemia, congenital abnormalities, and predisposition to cancer.1,2 Approximately 70% of DBA patients have mutations in ribosomal proteins, most frequently in RPS19.3 Previous studies in human CD34+ cells, zebrafish, and mice have shown that haploinsufficiency of RPS19 is associated with upregulation of the tumor suppressor p53.4-6 However, the link between ribosomal protein insufficiency and specific defects in erythropoiesis is not well understood.
Several transcription factors play a critical role in erythroid development, including GATA1,7 an essential erythroid protein comprising two zinc finger domains and a transactivation domain, which can activate or repress transcription of downstream targets by binding its consensus motif WGATAR in their promoters.8,9 Targets of GATA1 include EPOR, which encodes the EPO receptor, adult globin genes, heme biosynthesis enzymes, and erythroid membrane proteins.10
Recently, GATA1 splicing mutations have been found in three rare X-linked cases of DBA,11 suggesting an association between this transcription factor and ribosomal protein deficiency.12 We therefore investigated whether RPS19 deficiency affects GATA1 expression in human hematopoietic progenitor cells and in zebrafish. Our results demonstrated that GATA1 messenger RNA (mRNA) and protein levels are downregulated in human hematopoietic progenitor CD34+ cells transduced with RPS19 short hairpin RNA (shRNA). Furthermore, we found that downregulation of GATA1 is p53 dependent and mediated, at least in part, through activation of the inflammatory cytokine tumor necrosis factor α (TNF-α) and its downstream signaling target p38 MAPK. Treatment of RPS19-deficient primary hematopoietic cells and zebrafish with the TNF-α inhibitor etanercept improved erythroid colony formation in vitro and rescued the anemia phenotype in vivo. Our studies suggest that inflammatory pathways play an important role in the erythroid defects and GATA1 regulation in DBA.
Methods
Cell culture
Primary human CD34+ hematopoietic stem and progenitor cells were purified from cord blood (New York Blood Center) or from human fetal liver tissue (Advanced Bioscience Resources and University of California, Los Angeles Center for AIDS Research) by using magnetic-activated cell sorting (Miltenyi Biotec) and were cryopreserved. Upon thawing, cells were cultured in x-Vivo15 media (Lonza) containing 10% fetal bovine serum, fms-related tyrosine kinase 3 (50 ng/mL), thyroid peroxidase (50 ng/mL), interleukin-3 (IL-3; 20 ng/mL), interleukin-6 (IL-6; 20 ng/mL), and stem cell factor (50 ng/mL).
Lentiviral transduction
Primary CD34+ cells were transduced with lentivirus expressing shRNA against RPS19 (RPS19-1, RPS19-2, RPS19-3) or luciferase (Luc) shRNA at a multiplicities of infection score of 10 after 24 hours in culture. Cells were sorted for green fluorescent protein (GFP) after 3 to 5 days and harvested for downstream assays as indicated in Results. For p53 knockdown experiments, cells initially transduced with RPS19 shRNA were infected with lentivirus expressing p5313 or Luc shRNA with mCherry and sorted for GFP+mCherry+ cells 5 days after the initial transduction. For GATA1 rescue experiments, full-length GATA1 complementary DNA (cDNA) was obtained from K562 cells by reverse transcriptase polymerase chain reaction (RT-PCR) and cloned into a lentiviral vector containing mCherry. Cells were cotransduced with lentivirus expressing GATA1 cDNA and RPS19 shRNA and sorted for GFP+mCherry+ cells 5 days after transduction. A list of shRNA target sequences is provided in supplemental Table 1, available on the Blood Web site.
Compounds
Nutlin-3 (N6287; Sigma-Aldrich) was diluted in dimethylsulfoxide to a 10 mM stock and added to cells at final concentrations of 10 μM and 25 μM for 24 hours. Etanercept (Amgen) was diluted according to manufacturer’s instructions, added to cells at a concentration of 10 μg/mL, and injected into zebrafish embryos at 2 ng per embryo. SB203580 (Selleck Chemicals) was added to cells at 1 μM, 5 μM, or 10 μM concentrations for 18 to 22 hours. Cycloheximide (Sigma-Aldrich) was used at a concentration of 1 μg/mL for 2 hours. MG132 (Calbiochem) was added to cells at a 10 μM concentration for 6 hours.
Colony assays
GFP+- or GFP+mCherry+-sorted hematopoietic cells were seeded in methylcellulose medium containing IL-3, stem cell factor, granulocyte macrophage–colony-stimulating factor, and erythropoietin (H4434; STEMCELL Technologies) in triplicate, with 1000 cells per plate. Erythroid (burst-forming unit erythroid) and myeloid (colony-forming unit, granulocye-macrophage) colonies were counted 14 days later.
qRT-PCR
RNA was extracted by using TRIzol (Life Technologies). RNA was transcribed into cDNA by using the iScript cDNA Synthesis Kit (Bio-Rad). The quantitative RT-PCR (qRT-PCR) reaction was run with iQ SYBR Green MasterMix (Bio-Rad) using the CFX384 Touch Real-Time PCR Detection System (Bio-Rad). 7SL small cytoplasmic RNA14 was used as an internal control. Fold change of mRNA was calculated by using the comparative Ct method. A list of all primers used is provided in supplemental Table 2.
Western blot
Antibodies against RPS19 (#AB40833; Abcam; 1:200 dilution) and GATA1 (#sc-266; Santa Cruz Biotechnology; 1:200 dilution and #3535; Cell Signaling Technology; 1:1000 dilution) were used according to manufacturer’s instructions. β-actin mouse monoclonal immunoglobulin G2a (A5316; Sigma-Aldrich) was used as a control at a 1:5000 dilution. The target proteins were analyzed by using WesternBright Sirius Chemiluminescent Substrate for horseradish peroxidase (Advansta). Densitometry was performed by using Image J software (http://rsb.info.nih.gov/ij/) to quantify the data.
Zebrafish
Zebrafish were reared at 28.5°C at a cycle of 14 hours of light/10 hours of dark. Embryos were obtained by natural spawning. Thirty embryos were injected with rps19-specific morpholino (MO) at the 1-cell stage as previously described5 and with 2 ng of etanercept at 4 to 5 hours post fertilization (hpf). For phenotypic analysis, embryos were scored blindly, without knowledge of whether they belonged to the control or the treatment group, and scoring was repeated 3 times. RNA was prepared from embryos at 18 and 40 hpf for qRT-PCR. At day 3, embryos were stained with o-dianizidine to detect hemoglobin. For western blot, embryos were collected at 18 hpf, dechorionated with pronase, deyolked by pipetting in cold Ca-free Ringer’s solution, washed 3 times with the same solution, and placed in cold radioimmunoprecipitation assay buffer with proteinase inhibitors. Protein content was detected by using bovine serum albumin assay. Ten micrograms of protein was loaded per lane and stained with antibodies against Gata1 (#55507; AnaSpec) and mouse anti-α-tubulin antibody (Sigma-Aldrich) followed by horseradish peroxidase anti-mouse antibody (Santa Cruz Biotechnology).
TNF-α detection
Cells were sorted for GFP 72 hours after transduction, and culture media was harvested 5 days after transduction. TNF-α was detected with a human TNF-α high sensitivity enzyme-linked immunosorbent assay kit (BMS223HS; eBioscience) according to the manufacturer’s instructions.
Flow cytometry
For cell surface flow cytometry, cells were incubated with human Fc receptor binding inhibitor (#14-9161-73; eBioscience, Inc.) followed by primary antibodies CD71-APC (#551373; BD Biosciences) and biotinylated CD120a (TNFR1) (#552536; BD Biosciences). After washing, Streptavidin-PE-Cy7 (#557598; BD Biosciences) was added; all incubation times were 20 minutes on ice. For intracellular phospho-flow cytometry, cells were fixed in 3.2% paraformaldehyde and permeabilized with 100% methanol. The cells were then stained for CD71 (#551143 or #551374; BD Biosciences), phosphorylated p38 (p-p38) (#612565; BD Biosciences), phosphorylated nuclear factor κB (pNF-κB) (#4887; Cell Signaling Technology), phosphorylated ERK1/2 (pERK1/2) (#612566; BD Biosciences), phosphorylated STAT5 (pSTAT5) (#612599; BD Biosciences), and pSTAT1 (#560113; BD Biosciences). Data were collected on a DxP10 flow cytometer (Cytek) and analyzed by using FlowJo Software, v.9.7.2.
Statistics
P values for statistical significance were obtained by using an unpaired Student t test. The data are representative of at least 2 independent experiments.
Results
RPS19-deficient primary hematopoietic cells show reduced GATA1 expression
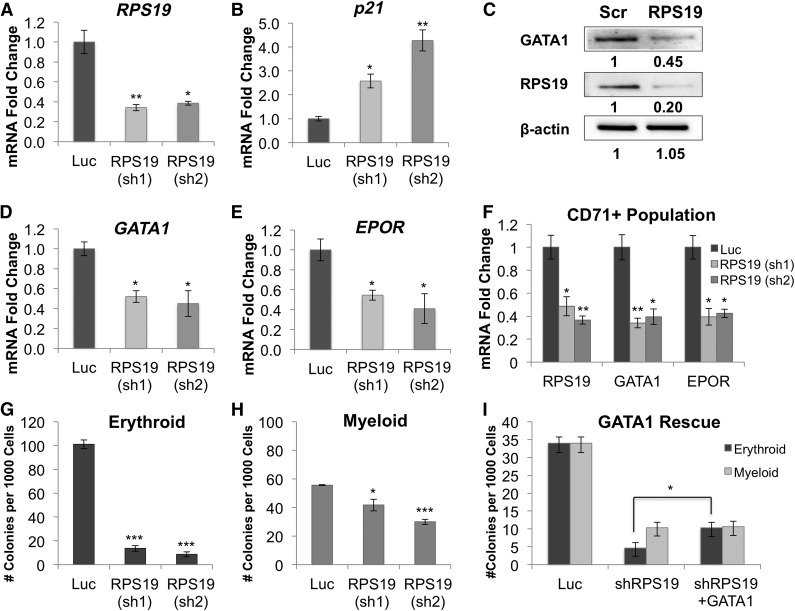
To investigate the link between RPS19 deficiency and erythropoietic defects, we examined whether RPS19 knockdown affects GATA1 expression. Primary human CD34+ cord blood and fetal liver hematopoietic stem and progenitor cells were transduced with lentivirus expressing RPS19 or Luc control shRNA. On day 5 after transduction, RPS19 expression decreased by approximately 60% (Figure 1A), with increased levels of the p53 targets p21 (Figure 1B), GADD45A, WIG-1, and BAX (supplemental Figure 1). RPS19-deficient cells also showed a decrease in the antiapoptotic gene BCL-2 (supplemental Figure 1), as well as increased apoptosis, seen through morphology (supplemental Figure 2) and increased cleaved poly(ADP-ribose) polymerase (supplemental Figure 3). Expression of GATA1 protein (Figure 1C), mRNA (Figure 1D), and transcriptional targets EPOR (Figure 1E), ERAF, HBB, and HBG2 (supplemental Figure 4) was decreased in RPS19-deficient cells. A time course of RPS19, GATA1, and EPOR expression (supplemental Figure 5) shows this decrease was steady at several time points and was not a result of delayed differentiation in RPS19-deficient or control cells. Additionally, the decrease in GATA1 was EPO independent, because EPO was not added to the liquid culture until after day 5, and the addition of EPO showed little effect on erythroid differentiation during the early phase of liquid culture (supplemental Figure 6). The decrease in GATA1 expression was also observed in cells deficient for other ribosomal proteins, including RPS14 and RPL11 (supplemental Figure 7).
Figure 1.
GATA1 expression and erythroid colony formation is decreased in RPS19-deficient hematopoietic progenitor cells. Human CD34+ hematopoietic progenitor cells were infected with lentivirus carrying shRNA against RPS19 or Luc control, sorted for GFP+ cells after 3 days, and analyzed 3 or 5 days after transduction, as stated for each panel. (A) shRNA knockdown of RPS19 reduces RPS19 mRNA levels by approximately 60% compared with control 5 days after transduction. (B) p21 mRNA expression is upregulated in RPS19-deficient cells 5 days after transduction. (C) GATA1 protein levels decreased in RPS19-deficient fetal liver cells [Scr, scrambled control shRNA; RPS19, RPS19 (sh2)] 3 days after transduction. (D) GATA1 and (E) EPOR mRNA levels decrease in RPS19-deficient cells 5 days after transduction. (F) GATA1 and EPOR expression is decreased in CD71+ RPS19-deficient erythroid progenitor cells 5 days after transduction. (G) Erythroid colony formation in methylcellulose is reduced in cells with RPS19 knockdown. (H) Myeloid colony formation is decreased in RPS19-deficient cells. (I) Exogenous expression of GATA1 in RPS19-deficient cord blood cells partially rescues their ability to form erythroid colonies in methylcellulose. Data are representative of 2 independent transduction experiments. *P < .05; **P < .01; ***P < .001.
To confirm that GATA1 downregulation in RPS19-deficient cells was due to decreased GATA1 transcription and not a consequence of fewer erythroid progenitors in the population, we sorted the RPS19-deficient hematopoietic cells for CD71, a marker of erythroid progenitors. We observed a decrease in GATA1 and EPOR expression in this population of cells (Figure 1F), consistent with our hypothesis that GATA1 transcription is decreased in erythroid progenitors. We further confirmed that the CD71+ population gives rise to primarily erythroid colonies in methylcellulose (supplemental Figure 8), and we analyzed the maturation stage of the CD71+ population by using late-stage erythroid cell surface markers α4-integrin and band 3,15 which showed no difference between control and RPS19-deficient cells that could otherwise affect GATA1 expression (supplemental Figure 9).
RPS19 downregulation results in decreased erythroid (Figure 1G) and myeloid (Figure 1H) colony formation. To examine whether exogenous expression of GATA1 could rescue the erythroid defects in RPS19-deficient cells, we cotransduced CD34+ cord blood cells with shRNA against RPS19 and a construct carrying full-length GATA1 cDNA (supplemental Figure 10) and observed a 2.2-fold increase in erythroid colony formation compared with cells transduced with RPS19 shRNA and empty vector control (Figure 1I). Our studies demonstrate that GATA1 levels are reduced in RPS19-deficient cells, that this reduction is specific to erythroid progenitors, and that expression of exogenous GATA1 improves erythropoiesis in our cell model of DBA.
Inflammatory cytokines TNF-α and IL-6 are upregulated in RPS19-deficient primary hematopoietic cells
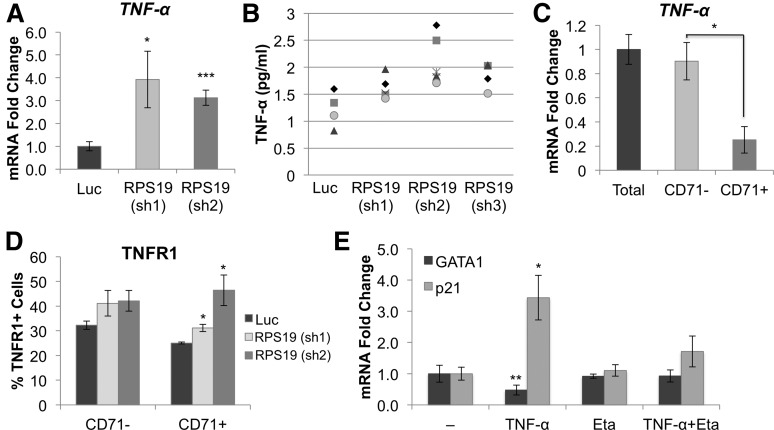
Bone marrow failure has been reported to be associated with an increased inflammatory response,16 and inflammatory cytokines such as TNF-α are known to be associated with inhibition of erythropoiesis.17 Therefore, it is possible that GATA1 expression may be reduced in RPS19-deficient cells through inflammation and activation of TNF-α, which has been shown to inhibit GATA1 in TF-1 cells.18 In agreement with this hypothesis, we found that both TNF-α mRNA and protein are upregulated in RPS19-deficient cells (Figure 2A-B). We also saw increased levels of IL-6 in response to RPS19 knockdown but did not observe an increase in other cytokines, including IL-1 and TRAIL (supplemental Figure 11), or any significant changes in the baseline expression of TNF-α in our culture system (supplemental Figure 12).
Figure 2.
RPS19-deficient cells show increased expression of TNF-α. CD34+ hematopoietic progenitor cells were transduced with lentivirus carrying shRNA against RPS19 or Luc control, sorted for GFP+ cells at 72 hours, and analyzed 5 days after infection. (A) TNF-α mRNA and (B) protein levels are increased in the media from RPS19 deficient cells, compared with control, as measured by enzyme-linked immunosorbent assay (ELISA). Each symbol on the graph represents a separate measurement [n = 4 for Luc and RPS19 (sh3); n = 5 for RPS19 (sh1); n = 6 for RPS19 (sh2)]. (C) TNF-α is predominantly expressed in the CD71– (nonerythroid) fraction of cord blood cells in culture. (D) Cells were analyzed for CD71 and TNFR1 expression by flow cytometry. TNFR1 expression increased on the surface of RPS19-deficient CD71+ cells compared with Luc control but did not change in the CD71– population. (E) Addition of 100 ng TNF-α to CD34+ cord blood cells results in decreased GATA1 and increased p21 expression after 24 hours. This effect is rescued by addition of 10 μg etanercept (Eta). Data are representative of 2 independent experiments. *P < .05; **P < .01; ***P < .001.
To determine which cells produced TNF-α in our system, we separated the hematopoietic progenitor cells into erythroid (CD71+) and nonerythroid (CD71–) cell fractions 5 days after culture and analyzed levels of TNF-α and its receptor TNFR1 in the 2 cell populations. TNF-α was primarily expressed in the CD71– fraction (Figure 2C), containing macrophages, monocytes, stem cells, myelomonocytic progenitors, and promyelocytes (supplemental Figure 13). TNFR1 was upregulated on the cell surface of CD71+ cells, as measured by flow cytometry (Figure 2D). Treatment of hematopoietic progenitors with TNF-α decreased GATA1 levels 2.1-fold and led to upregulation of p21, which could be attenuated by the addition of the TNF-α inhibitor etanercept (Figure 2E). Inhibition of TNF-α in RPS19-deficient cells by shRNA knockdown resulted in a restoration of GATA1 expression and increased formation of erythroid colonies in methylcellulose (supplemental Figure 14).
Etanercept improves erythropoiesis in RPS19-deficient primary hematopoietic cells
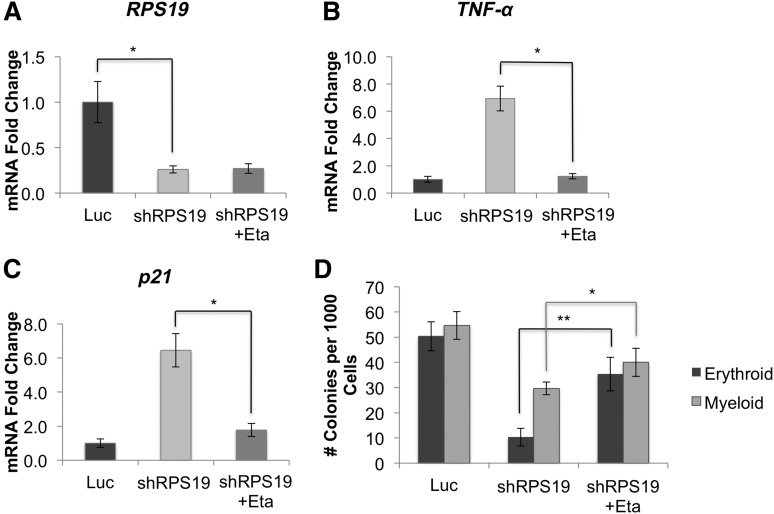
Because TNF-α is known to inhibit erythropoiesis, we examined whether suppressing TNF-α with etanercept in RPS19-deficient cells would improve their erythropoietic defects. We treated RPS19-deficient cord blood cells (Figure 3A) with etanercept and observed a strong reduction in TNF-α (Figure 3B) and p21 (Figure 3C) expression. Additionally, etanercept treatment rescued erythropoiesis, and to a lesser extent, myelopoiesis in RPS19-deficient cells, with a 3.5-fold increase in erythroid colony formation compared with untreated cells (Figure 3D).
Figure 3.
Inhibition of TNF-α rescues erythroid defects in RPS19-deficient cord blood cells. Human CD34+ hematopoietic progenitor cells were infected with lentivirus carrying shRNA against RPS19 or Luc control, sorted for GFP+ cells after 72 hours, and treated with etanercept for 48 hours. (A) shRNA knockdown of RPS19 reduced RPS19 mRNA levels by approximately 70% compared with control. (B) Treatment of RPS19-deficient cord blood cells with etanercept reduced TNF-α and (C) p21 expression in these cells. (D) Etanercept treatment rescued both erythroid and myeloid colony formation of RPS19-deficient cells. Data are representative of 2 independent experiments. *P < .05; **P < .01; ***P < .001.
Etanercept rescues erythroid defects and restores Gata1 expression in rps19-deficient zebrafish
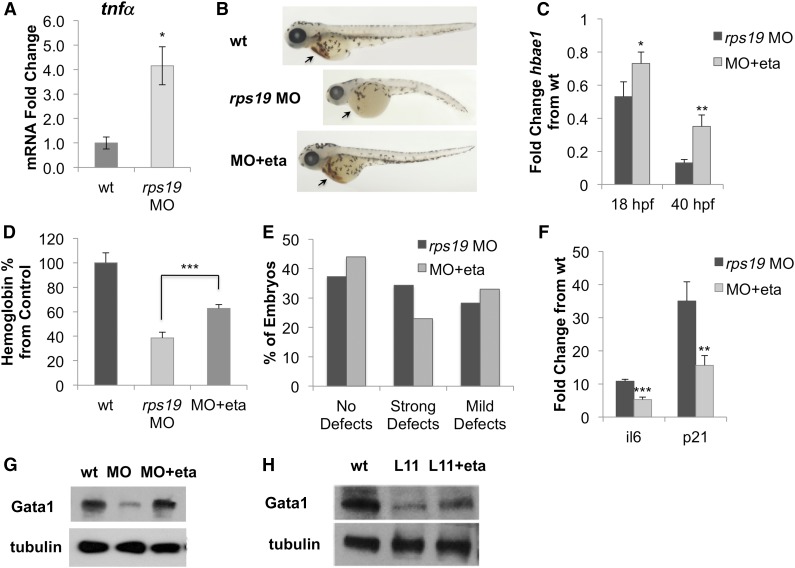
To investigate whether etanercept would improve the DBA phenotype in vivo, we used a zebrafish model of DBA, in which Rps19 knockdown is achieved through injection of MO.5 We first confirmed upregulation of tnfα in rps19 MO zebrafish by qRT-PCR and found that tnfα mRNA expression was increased 4.2-fold (Figure 4A), consistent with our primary hematopoietic cell model. We next treated rps19 MO zebrafish with etanercept and observed a rescue of the DBA phenotype (Figure 4B), with improvements in erythropoiesis, as measured through hbae1 expression (Figure 4C) and hemoglobin content (Figure 4D), as well as a slight improvement in the morphology of the fish (Figure 4E).
Figure 4.
Inhibition of TNF-α rescues erythroid defects in rps19-deficient zebrafish. (A) tnfα mRNA is upregulated in rps19 MO zebrafish compared to wild-type (wt) at 18 hpf. (B) Treatment of rps19 MO zebrafish with the TNF-α inhibitor etanercept rescued the erythropoietic (see arrows) and developmental defects. The average phenotype of each group is shown. (C) Expression of hbae1 is increased in rps19 MO zebrafish after etanercept treatment. (D) Etanercept treatment restores hemoglobin levels in zebrafish, as measured by Drabkin’s reagent at 54 hpf. (E) Morphologic defects in rps19-morphant zebrafish are alleviated with etanercept treatment. “Strong defects” are defined as kinks, curved body, absent/rudimentary eyes, and other severe growth abnormalities. “Mild defects” are defined as smaller or shorter embryos with both eyes present. “No defects” indicates absence of visible defects in zebrafish morphology. Embryos were scored 3 times, with the average shown in the figure. (F) rps19-morphant zebrafish treated with etanercept showed reduced expression of p53 targets p21 and il-6. (G) Treatment with etanercept restored Gata1 expression in rps19 MO zebrafish. (H) Levels of Gata1 also increased in rpl11-mutant (L11) zebrafish following etanercept treatment. Data are representative of 2 independent experiments. *P < .05; **P < .01; ***P < .001.
Additionally, the fish showed decreased levels of il-6 and p21 expression (Figure 4F) and increased expression of Gata1, which was observed in both rps19 morphants (Figure 4G) and rpl11-mutant fish (Figure 4H). However, because purifying erythroid cells from zebrafish embryos was not technically feasible, we cannot conclude that the increase in Gata1 is specific to the erythroid population rather than a consequence of increased erythropoiesis in the fish. Overall, these data demonstrate that etanercept is effective in improving erythropoietic defects associated with DBA both in vitro and in vivo.
GATA1 downregulation and TNF-α upregulation are p53 dependent
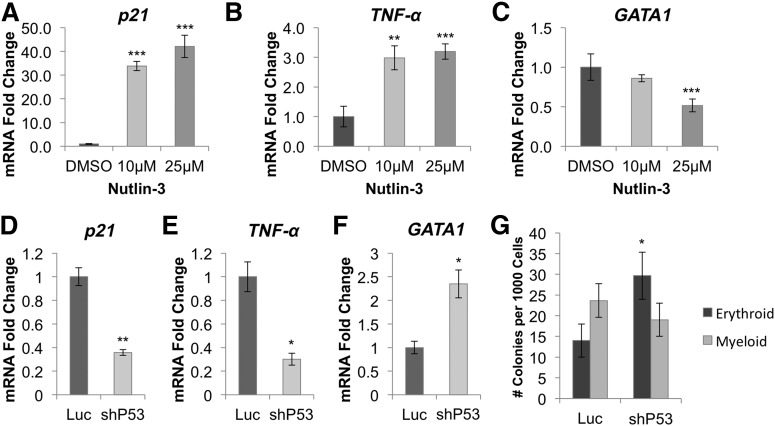
To determine whether GATA1 downregulation and TNF-α upregulation were p53 dependent, we treated CD34+ cord blood cells for 24 hours with Nutlin-3, a drug that leads to p53 stabilization (supplemental Figure 15) by blocking MDM2.19 Nutlin-3 treatment increased expression of the p53 targets p21 (Figure 5A) and TNF-α (Figure 5B) and inhibited GATA1 expression (Figure 5C). Next, we cotransduced RPS19-deficient CD34+ cord blood cells with lentivirus expressing p53 or Luc control shRNA and an mCherry selection marker, and analyzed GFP+mCherry+ cells 5 days after infection. We observed a decrease in p21 (Figure 5D) and TNF-α (Figure 5E) mRNA levels in cells transduced with p53 shRNA as well as an increase in GATA1 levels (Figure 5F). Additionally, p53 knockdown increased erythroid colony formation twofold in RPS19-deficient cord blood cells (Figure 5G).
Figure 5.
GATA1 downregulation is mediated through activation of p53 and TNF-α. (A) Stabilization of p53 by Nutlin-3 in CD34+ hematopoietic progenitor cells leads to dose-dependent upregulation of p21 and (B) TNF-α, as well as (C) downregulation of GATA1. (D) shRNA-mediated knockdown of p53 in RPS19-deficient cord blood cells reduces p21 and (E) TNF-α expression while (F) increasing expression of GATA1 5 days after transduction. (G) Erythroid colony formation is increased in RPS19-deficient CD34+ cord blood cells cotransduced with p53 shRNA compared with Luc control shRNA. Data are representative of 2 independent experiments. *P < .05; **P < .01; ***P < .001.
Effect of TNF-α in RPS19-deficient primary hematopoietic cells is mediated, in part, through p38 MAPK
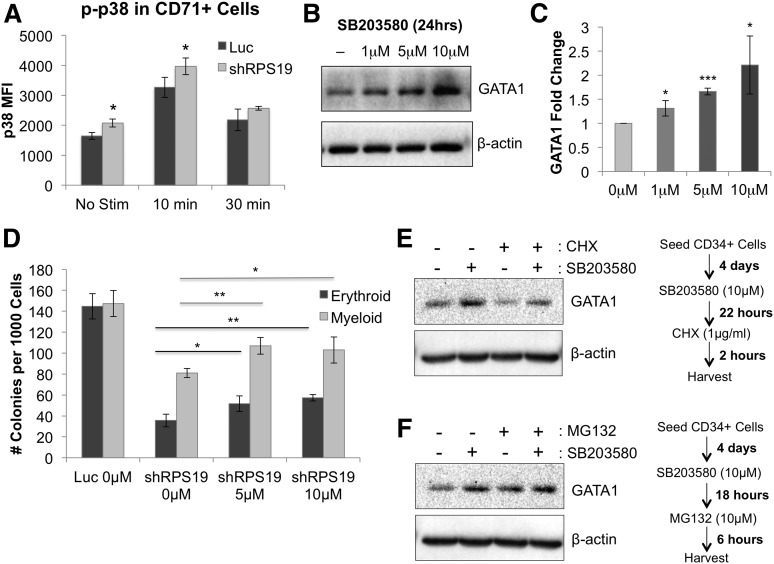
We next investigated the mechanism by which TNF-α affects erythropoiesis in RPS19-deficient cells by examining phosphorylation of downstream target pathways using phospho-flow cytometry before and after stimulation with TNF-α. We found a significant increase in phosphorylation of p38 MAPK in CD71+ RPS19-deficient cells compared with control cells, both at baseline and after a 10-minute stimulation with 100 ng/mL TNF-α (Figure 6A). Levels of p38 were also mildly elevated at baseline in the CD71– population but did not show greater increase upon TNF-α stimulation in RPS19-deficient cells compared with control (supplemental Figure 16). Other downstream signaling pathways, including NF-κB, ERK1/2, STAT5, and STAT1, showed no difference in activation between control and RPS19-deficient CD71+ cells (supplemental Figure 17), suggesting that the effect of TNF-α in RPS19-deficient cells is, at least in part, mediated through p38 MAPK.
Figure 6.
Effect of TNF-α on GATA1 expression is partially mediated through p38 MAPK activation. (A) p38 MAPK phosphorylation is increased in RPS19-deficient CD71+ fetal liver cells before and after a 10-minute stimulation with 100 ng/mL TNF-α, as measured by phospho-flow cytometry 5 days after transduction. (B) Treatment of CD34+ cord blood cells with SB203580 for 24 hours increased GATA1 protein expression in the cells. (C) Quantification of GATA1 protein increase from western blot in (B). (D) Treatment of RPS19-deficient cord blood cells with SB203580 partially rescues their erythropoiesis and myelopoiesis in methylcellulose. (E) Treatment of CD34+ cord blood cells with SB203580, a p38 MAPK inhibitor, increases the level of GATA1 protein in the cells, whereas treatment with CHX, a translation inhibitor, shows decreased GATA1 protein levels in the absence of SB203580. (F) Treatment of CD34+ cord blood cells with SB203580 and/or MG132, a proteasome inhibitor, increases GATA1 stability in the cells. Data are representative of 2 independent experiments. *P < .05; **P < .01; ***P < .001.
To test this hypothesis further, we treated CD34+ cord blood cells with the p38 MAPK inhibitor SB203580 and observed increased GATA1 protein in cells treated with increasing concentrations of SB203580 (Figure 6B-C). In line with this hypothesis, treatment of RPS19-deficient cells with SB203580 partially rescued both erythroid and myeloid colony formation (Figure 6D).
To test whether p38 pathway inhibition improves the stability of GATA1 protein, we treated CD34+ cord blood cells with SB203580 with or without the translation inhibitor cyclohexamide and observed GATA1 stabilization in the presence of SB203580 (Figure 6E). These data demonstrate that GATA1 has a short half-life by rapid turnover but can be stabilized through inhibition of p38 MAPK. To show that GATA1 levels are proteasome dependent in the cells, we treated CD34+ cord blood cells with MG132, a 26S proteasome inhibitor, in the presence or absence of SB203580 (Figure 6F). Our data show that MG132 treatment leads to increased stability of the GATA1 protein, suggesting that GATA1 is regulated through a proteasome-dependent mechanism and that p38 MAPK contributes to its degradation.
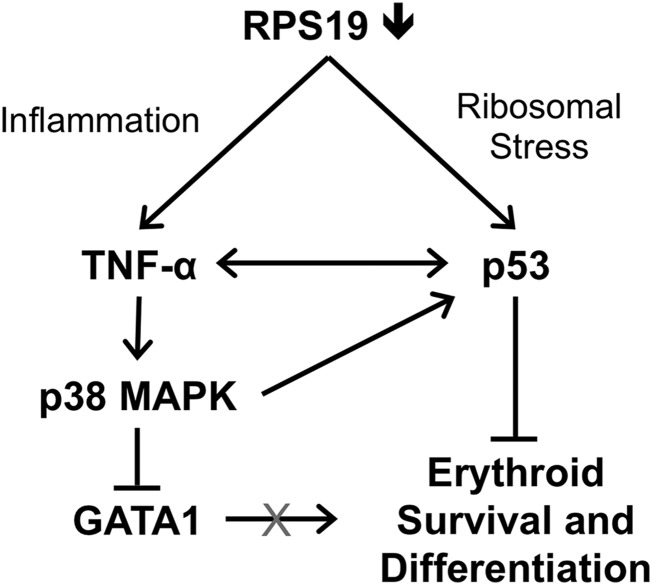
Overall, our data support a model in which deficiency of RPS19 causes p53-dependent inflammation and increased production of TNF-α in the bone marrow, which activates p38 MAPK and contributes to GATA1 degradation in erythroid cells (Figure 7).
Figure 7.
Model of GATA1 downregulation through the combined effects of p53 and TNF-α in RPS19-deficient cells. Deficiency of RPS19 in hematopoietic progenitors leads to ribosomal stress, which increases p53 levels as well as inflammation, which increases production of TNF-α by nonerythroid cells. TNF-α represses GATA1 through activation of p38 MAPK and may also contribute to increased p53 levels, which results in reduced survival and differentiation of erythroid cells.
Discussion
On the basis of these data, we concluded that GATA1 expression is decreased in RPS19-deficient erythroid progenitors, which may contribute to the erythroid-specific lineage defects characteristic of DBA, and that restoration of GATA1 expression in RPS19-deficient cells can improve erythroid colony formation in vitro. Additionally, we found upregulation of inflammatory cytokines TNF-α and IL-6 in both primary cell and zebrafish models of DBA, signifying a novel role for inflammation in DBA pathogenesis. Finally, we show that downregulation of GATA1 can be alleviated by the TNF-α inhibitor etanercept as well as through knockdown of p53 and p38 MAPK, suggesting potential novel therapies for the treatment of DBA.
A recently published study by Ludwig et al20 supports our findings that GATA1 is downregulated in hematopoietic cells with ribosomal protein haploinsufficiency and that expression of exogenous GATA1 in RPS19-deficient cells can partially rescue their erythroid defects. However, there are several differences in our findings, likely arising as a result of the different methods and model systems used in our studies. First, Ludwig et al did not observe changes in GATA1 mRNA or in expression levels of p53 target genes despite prior data from several groups showing p53 pathway upregulation as a feature of DBA.4-6 Second, the study focused on cell-intrinsic factors such as altered translation mechanisms rather than extrinsic factors such as cell signaling and inflammation to explain GATA1 downregulation in RPS19-deficient cells. The difference in GATA1 expression is likely due to timing of cell analysis. Ludwig et al analyzed GATA1 mRNA levels in CD34+-derived erythroid progenitors at 4 days after infection, whereas we did not observe significant changes in GATA1 expression until after day 5 (supplemental Figure 5). It is likely that the decrease in GATA1 protein precedes a decrease in GATA1 mRNA, which occurs as a result of GATA1 autoregulation. Differences in p53 pathway activation may be a result of distinctive model systems used (patient samples vs transduced hematopoietic progenitors), or a result of different methods used for gene expression analysis (qRT-PCR vs global gene profiling).
Taken together, our data support a model of GATA1 downregulation being a consequence of inflammation and activation of proinflammatory cytokines such as TNF-α, which has been shown to inhibit erythroid differentiation in multiple cell lines18,21 and is associated with reduced GATA1 expression in TF-1 cells through p38 MAPK.18 The erythroid niche in vivo consists of erythroid progenitors surrounding a central macrophage,17 which may secrete inflammatory cytokines in response to ribosomal stress, inhibiting erythroid progenitor growth around it. Consistent with this mechanism, we observed increased TNF-α production in CD71– cells in our culture system (which supports both myeloid and erythroid development), with increased expression of TNFR1 on the surface of CD71+ erythroid cells.
TNF-α signaling has been shown to activate p38 MAPK,22 which phosphorylates acetylated GATA1 at Ser26 and Ser178, facilitating its degradation.23 Our data support this mechanism of GATA1 degradation in response to increased TNF-α, because we saw increased phosphorylation of p38 MAPK in RPS19-deficient cells by phospho-flow. Treatment of primary hematopoietic cells with the p38 MAPK inhibitor SB203580 improved GATA1 protein stability in the cells. This model, in which TNF-α upregulation in RPS19-deficient cells contributes to GATA1 degradation through p38 MAPK, may also explain why dexamethasone, which reduces TNF-α levels, would have a beneficial effect in DBA patients.24
Increased expression of p53 in RPS19-deficient cells could also antagonize the transcriptional activity of GATA1. Exogenously expressed p53 has been shown to bind to GATA1 directly in K562 cells and inhibit its function.25 Therefore, it is plausible that p53 activated in RPS19-deficient cells binds to GATA1, inhibiting its ability to transactivate erythroid-specific genes. This would also reduce GATA1 transcription, since GATA1 has binding sites in its own promoter,26 forming a negative feedback loop between GATA1 and p53 in RPS19-deficient cells. Our studies confirm that GATA1 downregulation is p53 dependent and can be rescued by shRNA-mediated knockdown of p53 in RPS19-deficient cells.
Previous work supports the relationship between p53 and TNF-α, and each may contribute to DBA pathogenesis, because p53 can activate TNF-α expression by binding to its promoter,27 and TNF-α can activate the p53 pathway through p38 MAPK.28 Thus, p53 and TNF-α could form a positive feedback loop, acting together to repress erythropoiesis in response to ribosomal stress. This mechanism is consistent with our data showing that repression of p53, p38 MAPK, or TNF-α in RPS19-deficient cells can alleviate their erythroid defects.
In summary, our results demonstrate a novel link between RPS19 deficiency, inflammation, and GATA1 downregulation, which could explain the erythroid defects observed in DBA patients. We show that GATA1 downregulation is p53 dependent and is, at least in part, mediated by increased TNF-α production and p38 MAPK activation in RPS19-deficient cells. Additionally, our results suggest that etanercept and other TNF-α antagonists may provide a potential approach to treating erythroid defects in patients with DBA.
Acknowledgments
The authors thank Katie Hsu for technical assistance and Hanna Mikkola for critical reading of the manuscript. The RPS19 construct #2 and Scr control were kindly provided by the laboratory of Stefan Karlsson at the University of Lund, Sweden. Purified CD34+ fetal liver cells were obtained from the the University of California, Los Angeles Center for AIDS Research, which is supported by the National Institutes of Health (NIH) National Institute of Allergy and Infectious Diseases.
This research was funded by NIH National Heart, Lung, and Blood Institute grant R01 HL097561, a St. Baldrick’s Foundation Research grant, a US Department of Defense grant BM110060 (K.M.S.); a US Department of Health and Human Services Ruth L. Kirschstein Institutional National Research Service Award #T32 CA009056 (E.B.); and the Child Health Research Institute at Stanford Postdoctoral Fellowship (M.-Y.Y.).
Footnotes
The online version of this article contains a data supplement.
The publication costs of this article were defrayed in part by page charge payment. Therefore, and solely to indicate this fact, this article is hereby marked “advertisement” in accordance with 18 USC section 1734.
Authorship
Contribution: E.B., M.-Y.Y., Y.O.-U., Y.K.-G., and R.O. performed the experiments with human hematopoietic cells; N.D. performed experiments with zebrafish; the research was designed by E.B., M.Y.-Y., N.D., S.L., A.N., and K.M.S.; and the manuscript was written by E.B., B.G., S.L., and K.M.S.
Conflict-of-interest disclosure: The authors declare no competing financial interests.
Correspondence: Kathleen M. Sakamoto, Department of Pediatrics, Stanford University School of Medicine, 269 Campus Dr, CCSR 1215C, Stanford, CA 94305-5162; e-mail: kmsakamo@stanford.edu.
References
- 1.Sakamoto KM, Shimamura A, Davies SM. Congenital disorders of ribosome biogenesis and bone marrow failure. Biol Blood Marrow Transplant. 2010;16(1 Suppl):S12–S17. doi: 10.1016/j.bbmt.2009.09.012. [DOI] [PMC free article] [PubMed] [Google Scholar]
- 2.Lipton JM, Ellis SR. Diamond-Blackfan anemia: diagnosis, treatment, and molecular pathogenesis. Hematol Oncol Clin North Am. 2009;23(2):261–282. doi: 10.1016/j.hoc.2009.01.004. [DOI] [PMC free article] [PubMed] [Google Scholar]
- 3.Vlachos A, Dahl N, Dianzani I, Lipton JM. Clinical utility gene card for: Diamond-Blackfan anemia—update 2013. Eur J Hum Genet. 2013;21(10) doi: 10.1038/ejhg.2013.34. [DOI] [PMC free article] [PubMed] [Google Scholar]
- 4.Dutt S, Narla A, Lin K, et al. Haploinsufficiency for ribosomal protein genes causes selective activation of p53 in human erythroid progenitor cells. Blood. 2011;117(9):2567–2576. doi: 10.1182/blood-2010-07-295238. [DOI] [PMC free article] [PubMed] [Google Scholar]
- 5.Danilova N, Sakamoto KM, Lin S. Ribosomal protein S19 deficiency in zebrafish leads to developmental abnormalities and defective erythropoiesis through activation of p53 protein family. Blood. 2008;112(13):5228–5237. doi: 10.1182/blood-2008-01-132290. [DOI] [PubMed] [Google Scholar]
- 6.McGowan KA, Li JZ, Park CY, et al. Ribosomal mutations cause p53-mediated dark skin and pleiotropic effects. Nat Genet. 2008;40(8):963–970. doi: 10.1038/ng.188. [DOI] [PMC free article] [PubMed] [Google Scholar]
- 7.Crispino JD. GATA1 in normal and malignant hematopoiesis. Semin Cell Dev Biol. 2005;16(1):137–147. doi: 10.1016/j.semcdb.2004.11.002. [DOI] [PubMed] [Google Scholar]
- 8.Merika M, Orkin SH. DNA-binding specificity of GATA family transcription factors. Mol Cell Biol. 1993;13(7):3999–4010. doi: 10.1128/mcb.13.7.3999. [DOI] [PMC free article] [PubMed] [Google Scholar]
- 9.Welch JJ, Watts JA, Vakoc CR, et al. Global regulation of erythroid gene expression by transcription factor GATA-1. Blood. 2004;104(10):3136–3147. doi: 10.1182/blood-2004-04-1603. [DOI] [PubMed] [Google Scholar]
- 10.Suzuki M, Shimizu R, Yamamoto M. Transcriptional regulation by GATA1 and GATA2 during erythropoiesis. Int J Hematol. 2011;93(2):150–155. doi: 10.1007/s12185-011-0770-6. [DOI] [PubMed] [Google Scholar]
- 11.Sankaran VG, Ghazvinian R, Do R, et al. Exome sequencing identifies GATA1 mutations resulting in Diamond-Blackfan anemia. J Clin Invest. 2012;122(7):2439–2443. doi: 10.1172/JCI63597. [DOI] [PMC free article] [PubMed] [Google Scholar]
- 12.Weiss MJ, Mason PJ, Bessler M. What’s in a name? J Clin Invest. 2012;122(7):2346–2349. doi: 10.1172/JCI63989. [DOI] [PMC free article] [PubMed] [Google Scholar]
- 13.Brummelkamp TR, Bernards R, Agami R. A system for stable expression of short interfering RNAs in mammalian cells. Science. 2002;296(5567):550–553. doi: 10.1126/science.1068999. [DOI] [PubMed] [Google Scholar]
- 14.Galiveti CR, Rozhdestvensky TS, Brosius J, Lehrach H, Konthur Z. Application of housekeeping npcRNAs for quantitative expression analysis of human transcriptome by real-time PCR. RNA. 2010;16(2):450–461. doi: 10.1261/rna.1755810. [DOI] [PMC free article] [PubMed] [Google Scholar]
- 15.Hu J, Liu J, Xue F, et al. Isolation and functional characterization of human erythroblasts at distinct stages: implications for understanding of normal and disordered erythropoiesis in vivo. Blood. 2013;121(16):3246–3253. doi: 10.1182/blood-2013-01-476390. [DOI] [PMC free article] [PubMed] [Google Scholar]
- 16.Du W, Erden O, Pang Q. TNF-α signaling in Fanconi anemia. Blood Cells Mol Dis. 2014;52(1):2–11. doi: 10.1016/j.bcmd.2013.06.005. [DOI] [PMC free article] [PubMed] [Google Scholar]
- 17.Chasis JA, Mohandas N. Erythroblastic islands: niches for erythropoiesis. Blood. 2008;112(3):470–478. doi: 10.1182/blood-2008-03-077883. [DOI] [PMC free article] [PubMed] [Google Scholar]
- 18.Buck I, Morceau F, Cristofanon S, et al. Tumor necrosis factor alpha inhibits erythroid differentiation in human erythropoietin-dependent cells involving p38 MAPK pathway, GATA-1 and FOG-1 downregulation and GATA-2 upregulation. Biochem Pharmacol. 2008;76(10):1229–1239. doi: 10.1016/j.bcp.2008.08.025. [DOI] [PubMed] [Google Scholar]
- 19.Vassilev LT. Small-molecule antagonists of p53-MDM2 binding: research tools and potential therapeutics. Cell Cycle. 2004;3(4):419–421. [PubMed] [Google Scholar]
- 20.Ludwig LS, Gazda HT, Eng JC, et al. Altered translation of GATA1 in Diamond-Blackfan anemia. Nat Med. 2014;20(7):748–753. doi: 10.1038/nm.3557. [DOI] [PMC free article] [PubMed] [Google Scholar]
- 21.Buck I, Morceau F, Cristofanon S, Reuter S, Dicato M, Diederich M. The inhibitory effect of the proinflammatory cytokine TNFalpha on erythroid differentiation involves erythroid transcription factor modulation. Int J Oncol. 2009;34(3):853–860. doi: 10.3892/ijo_00000212. [DOI] [PubMed] [Google Scholar]
- 22.Sabio G, Davis RJ. TNF and MAP kinase signalling pathways. Semin Immunol. 2014;26(3):237–245. doi: 10.1016/j.smim.2014.02.009. [DOI] [PMC free article] [PubMed] [Google Scholar]
- 23.Hernandez-Hernandez A, Ray P, Litos G, et al. Acetylation and MAPK phosphorylation cooperate to regulate the degradation of active GATA-1. EMBO J. 2006;25(14):3264–3274. doi: 10.1038/sj.emboj.7601228. [DOI] [PMC free article] [PubMed] [Google Scholar]
- 24.Chan HS, Saunders EF, Freedman MH. Diamond-Blackfan syndrome. II. In vitro corticosteroid effect on erythropoiesis. Pediatr Res. 1982;16(6):477–478. doi: 10.1203/00006450-198206000-00015. [DOI] [PubMed] [Google Scholar]
- 25.Trainor CD, Mas C, Archambault P, Di Lello P, Omichinski JG. GATA-1 associates with and inhibits p53. Blood. 2009;114(1):165–173. doi: 10.1182/blood-2008-10-180489. [DOI] [PMC free article] [PubMed] [Google Scholar]
- 26.Tsai SF, Strauss E, Orkin SH. Functional analysis and in vivo footprinting implicate the erythroid transcription factor GATA-1 as a positive regulator of its own promoter. Genes Dev. 1991;5(6):919–931. doi: 10.1101/gad.5.6.919. [DOI] [PubMed] [Google Scholar]
- 27.Brown L, Ongusaha PP, Kim HG, et al. CDIP, a novel pro-apoptotic gene, regulates TNFalpha-mediated apoptosis in a p53-dependent manner. EMBO J. 2007;26(14):3410–3422. doi: 10.1038/sj.emboj.7601779. [DOI] [PMC free article] [PubMed] [Google Scholar]
- 28.Wu GS. The functional interactions between the p53 and MAPK signaling pathways. Cancer Biol Ther. 2004;3(2):156–161. doi: 10.4161/cbt.3.2.614. [DOI] [PubMed] [Google Scholar]


