Abstract
A novel microplasma device, for the first time, was constructed in a cavity Poly (dimethylsiloxane) (PDMS) chamber with two normal syringe needles serve as both the gas channels and the electrodes. This device employs argon plasma with direct current for molecular fragmentation and excitation. The microplasma is generated at atmospheric pressure in the PDMS chamber of 0.5 mL (5 × 10 × 10 mm3) volume with a sealable plug. Since the microplasma is maintained in a chamber by separation of the discharge zone and the substrate, stability for a long time of the microplasma is realized which could be observed by argon background emission fluctuation and SEM characterization. This property is beneficial for spectrometric detection of many volatile organics in this chamber. Besides, this kind of microplasma sensor has advantages such as flexibility in replacement of electrodes, convenience in clearance of the discharge chamber, small instrument volume, simple structure, and ease of operation. In addition, methanol-containing spirit samples were chosen to estimate the detecting performance of this microplasma for volatile organic compounds (VOCs) analysis by molecular emission spectrometry. Significant differences are observed upon the introduction of the spirit and the methanol-containing spirit samples. A detection limit of 0.3% is obtained on this microplasma device.
The development of microplasma chemical sensors for the detection of volatile organic compounds (VOCs) is a highly attractive research theme since last two decades. Microplasmas are characterized by their small size and high gas pressure, yielding nonequilibrium (cold) plasmas. It possesses some special features and characteristics, such as high portability, low thermal temperature, low power needs, and low gas consumption1,2,3,4,5. Up to now, many kinds of configurations have been reported for microplasma operated at atmospheric pressure6,7,8. Regarding the experimental characterization of microdischarges, optical emission spectroscopy (OES) appears as the most common tool used for detection of VOCs since determination of VOCs is crucially important for the industrial, environmental and human being safety9. However, until now there still are several noticeable problems to be addressed in regard to the analytical efficiency and stability of microplasmas. These potential negative effects severely, to a certain extent, have hindered further development of traditional microplasma detectors if without improvement: (1) Impurities deposition on the discharge electrodes and tube walls is always inevitable, which significantly changes the transparency of the optical emission window and creates a severe long-term reproducibility problem10,11. The lifetime of many normal microplasma devices are limited to several hours by sputtering of the cathode materials12,13. (2) Irregular dispersion of discharge positions is always observed. Depending on the position in the flow cell, differences exist in the retention time of the material flowing through the device, adding further uncertainty to the microplasma. In addition, fluctuations in microdischarge intensities occur for the cathode fall caused by the voltage drop in the cathode area10. (3) Another noticeable issue is the lower ability of the microplasma to distinguish molecules with similar structures when equipped with emission spectrometry for VOCs detection14,15. (4) Some multi-layer microplasma chips reported are fabricated by complicated, costly and time consuming processes, and the reliability and portability of these devices are always not good1. Hence, these issues including short working time, fluctuations, impurity deposition and lower stability should be of concern prior to the development of microplasma sensors with high stability as well as fast response.
With these limitations in mind, in this article, we have developed a microplasma device for direct detection of VOCs in a new style based on direct current (DC) operation. Our overall aim of this study is to achieve a simple and fast process for detection of VOCs by a microplasma device with a portable spectrometer. We designed a needle microplasma in a cavity Poly (dimethylsiloxane) (PDMS) chamber (NMCPC) as an energy source for molecular fragmentation and excitation. Volatile liquid samples can be directly introduced into the PDMS chamber and the VOCs diffusing from the samples are directly measured by the OES method. Two syringe needles penetrating into the chamber are used as both the gas channels and the electrodes. And the needle is adjustable for different discharge conditions. Additionally, the chamber is designed as a sealable structure equipped with a PDMS plug, which is helpful to clean the inner surface of the chamber. Considerable positive effort has been realized on improving the stability of the microplasma, including enhancing the fixation of the position and constancy of the microplasma intensity.
The key emphasis of this strategy lies in the fabrication of a transparent cavity chamber for microplasma discharge and release of VOC samples. In the preparation process, one of the important steps is based on the construction technology of PDMS by a novel mould method. PDMS-based microfluidic chips recently have gained more concerns because they have many advantages for chemical and biological analysis, which includes a low production cost, non-toxicity, reversible deformation and an optically clear surface16,17. Enlightened by the iron casting technology, we have developed a template-assistance method for PDMS shaping and have prepared many kinds of discharge PDMS cells for microplasma spectrometry. For the first time to our knowledge, the present study is showing that the NMCPC model is bringing an interesting input to tailor the stability and sensitivity of microplasma sensors.
Based on the NMCPC device, we have developed a technology and strategy aiming for fast detection of certain kinds of VOC samples by a convenient method since no complicated process, GC parts and enrichment systems for organic samples are needed. Operation and instrumental requirements are simple because analytes containing target solution is directly vaporized into the discharge region. In this situation, analytic results can be easily obtained within 10 min. Although this portable detector cannot compete with the performance of laboratory devices in terms of sensitivity and selectivity, its special performance is acceptable under some circumstances for detection of certain VOC samples. Furthermore, this research also provides new insight into microplasma analytical efforts and into potential applications for on-site detection of hazard materials.
In this research a methanol-containing spirit sample was chosen as a model to estimate the NMCPC analytical performance. Methanol, the simplest alcohol, is toxic to humans. In small amounts it may cause headache, vertigo, nausea and vomiting. Consumption of ~20 mL can cause blindness while ~60 mL is usually lethal if not treated18. The methanol quantity may increase due to storage in inadequate conditions and also by some methoxyl pectines and other enzymes present in the drink. Besides, some lawless businessmen and peddlers mix methanol-containing industrial alcohols into spirit drinks for business profits which deeply harm the health of consumers. In recent years many cases have been exposed involving the lawless selling of adulterated alcohol drinks these years (www.google.com.cn). For human, it is very hard to distinguish small amount of methanol from ethanol only based on noses because they have almost the same odors. Furthermore, it is also difficult to analysis of methanol-containing alcohol by traditional chemical methods since they are difficult to separate. For monitoring the quality of drinking alcohols, on-site sampling techniques followed by off-site laboratory analysis may be a key approach. Until now it is still a challenge task to monitor the quality of drinking alcohols on real time. In this research by evaporating the methanol-containing alcohol into VOC vapors and introducing into the NMCPC device, we successfully detected small amount of methanol in the VOCs. This NMCPC sensor working under atmospheric pressure with OES measurement has been used for analysis of 0.3%-level methanol in argon gas.
Results
Experimental optimization and stability investigation
Beforehand, in order to investigate the dependence of the stability on the configuration characterization of the NMCPC, several factors related to the plasma process were varied for the discharge test. In this test, the needle electrodes do not need to be fixed in one place and they can be moved through the plastic PDMS walls to change the inter-electrode spacing, the opposite angle, and the distance between the electrode and the PDMS substrate.
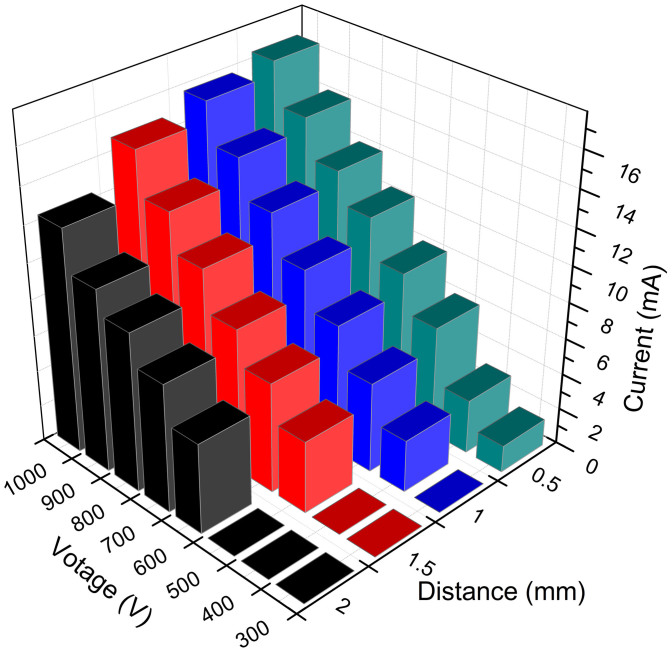
In general, the discharge current is seen to be dependent on the interelectrode gap and the voltage20. In order to have an overview of both voltage and current as a function of the interelectrode gap, the average currents of the applied voltages and gaps have been summarized in Figure 1. The voltage used is the maintenance supply for the microplasma and the gas flow velocity is 250 mL min−1. It is clear that as the voltages increase from 300 V to 1000 V, the discharge currents accordingly increase, and the sample ablation rate will provide greater number of analyte atoms to the negative glow region. As reported in other literatures, greater numbers of electrons within the negative glow are available to excite the sputtered atoms as the current increases21.
Figure 1. Discharge parameters of the NMCPC plasma.
Relationship of the voltage (maintenance), current, and distance between the needle electrodes.
As was expected, the interelectrode gap in the NMCPC device also has a definite influence on the operating parameters, with larger gap distances requiring higher maintenance voltages for a given discharge current. Larger gaps yield lower current densities in the plasma and greater chances for analyte diffusion outside of the excitation volume. As the distance between the tips of the needles could be precisely adjusted to maintain stable microplasmas, an ideal distance of the needles can be used to optimize the operating characteristics. When the gap distance increases from 0.5 to 2 mm, there is a decrease in the current response. It should be noted that when the distance increases, the microplasma discharge extinguishes even at higher voltages. The extinguishing voltages for the distance of 0.5 mm, 1 mm, 1.5 mm and 2 mm are 175 V, 300 V, 400 V and 500 V, respectively, as indicated in Figure 1. Therefore, a more narrow interelectrode distance could be chosen for the analytical measurements. In this research a distance of 0.5 mm and a voltage of 300–800 V was always used for the microdischarge since it could provide a higher degree of fragmentation and ionization in the plasma in a stable state.
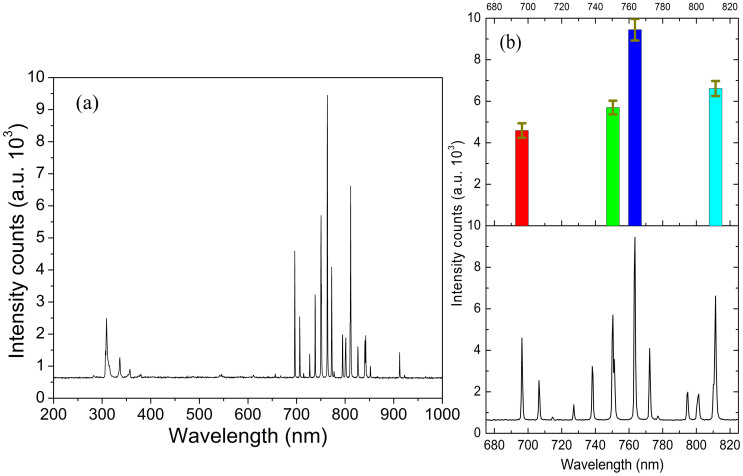
Reference curve based on argon flow was then performed. In Figure 2(a) an emission spectrum of the NMCPC over the spectral range of 200–1000 nm is shown. Characteristic OES spectrum obtained for the argon microplasma expanding in air is presented. The background spectrum indicates, apart from a few Ar lines, mainly N2 bands. The N2 bands are the wide spectral features found in the lower wavelength part of the spectrum, while the Ar lines are predominantly found in the longer wavelength area.
Figure 2. Background stability estimation.
(a) Background emission spectrum from argon gas. In the absence of samples mainly N2 bands are observed between 300 to 400 nm (power about 5 W). (b) Stability evaluation by the peak height record at 696.36, 750.41, 763.53, and 811.4 nm sampling in 2 h with a 1 min interval.
In Figure 2(a) one can observe the most important features attributed to the Ar 4p → 4s transitions locate between 690 and 850 nm, and the 306 nm rotational band of the OH- group. The OH- emission peak is caused by the fragmentation of H2O molecules that exist in the ambient air5. The presence of small amount of N2 causes the appearance of strong bands in the range of 300–400 nm. Three most significant N2 peaks, 337.4 nm, 357.8 nm, and 380.4 nm are observed, which result from the lowest vibrational transition of the C3IIu → B3IIg system of N2 molecules12. Back-diffusion of air may bring small amount of N2 impurities at a relatively low gas flow rate. The gas temperature of the plasma was detected with an inserted thermocouple thermometer. At the power of about 5 W, the gas temperature of the NMCPC plasma is about 285–335 K.
Then, the emission intensity as a function of the discharge time was studied. The background emission stability was evaluated by monitoring four highest emission peaks at 696.36, 750.41, 763.53, and 811.4 nm respectively. Peak height of these four peaks was recorded every 1 min in 2 h. Fluctuation of these 4 peak height are expressed as the error bars indicated in Figure 2(b). From the ratio of the error bars to the peak height we find the deviation varying between 5.1% and 7.2%, a value indicating the plasma burns regularly (supporting information provides a continuous mode for background recording). To a DC microplasma, it shows a relatively stable emission in a long working period.
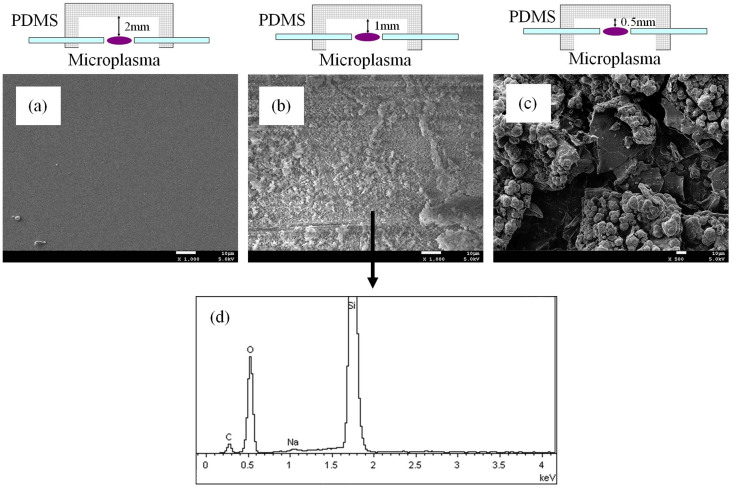
We also performed estimation on the influence between the surrounded PDMS walls and the microplasma zone. It is important to know that any process which covers the discharge chamber walls reduces the light transfer and thus the sensitivity of the plasma detector. For comparison, three kinds of arrangement with different distance from the microplasma and the PDMS walls were used to test the interaction.
Figure 3 shows the scanning electron microscope (SEM) images of the inner wall surfaces of 3 chambers with the distance of 2, 1, and 0.5 mm between the inner walls and the microplasma centers. Degeneration and cracked section are almost avoided with a larger distance (Figure 3(a)). Figure 3(b) and 3(c) show typical damage after 2 h of burning time, irregular and disordered deposition can be clearly seen to cover the inner surface of the chamber. It is obvious that with a narrower distance serious heating from the microplasma occurs and damages the PDMS surface. The deposition coating can be characterized by energy dispersive X-ray (EDX) spectra (Figure 3(d)), which identifies silicon, oxygen and carbon as the main constituents of it. The precipitation materials on the PDMS surface may be induced by the sputtering of molecular fragments formed in the microplasma and by simple overheating of the polymer substrate.
Figure 3. Influence on the PDMS substrate.
SEM characterization on the inner walls of the chambers with a distance of (a) 2 mm, (b) 1 mm, and (c) 0.5 mm to the microplasma discharge centers after working of 2 h. The scale bar in the SEM picture is 10 μm. (d) Elemental characterization for the deposition on the inner wall of the chamber (b) by EDX spectrum.
The sputtered and overheating materials on the PDMS surface will make the optical window obscure hence block the emission of the microplasma to the optical fiber. Therefore we estimate, for many traditional microplasma devices with embedded electrodes in the substrates, production of sputtered contaminants and overheating products always take places which will decrease substrate transmittance and significantly shorten their working lifetime1,19. For the NMCPC device, none of the electrode tips is in contact with the PDMS substrate which prevents fast deterioration of the electrodes and contamination of the plasma. Hence a longer working time can be obtained since the influence from the substrate can be greatly reduced by adjusting a longer distance between the microplasma and the PDMS surface. On the other hand, the microplasma area is surrounded in a flowing argon shell which is helpful to slow transferring the heat to the PDMS substrate and the electrodes. Under this condition, the flowing argon shell in the chamber is in favor of slowing the substrate and electrode fouling rate.
Analytical performance
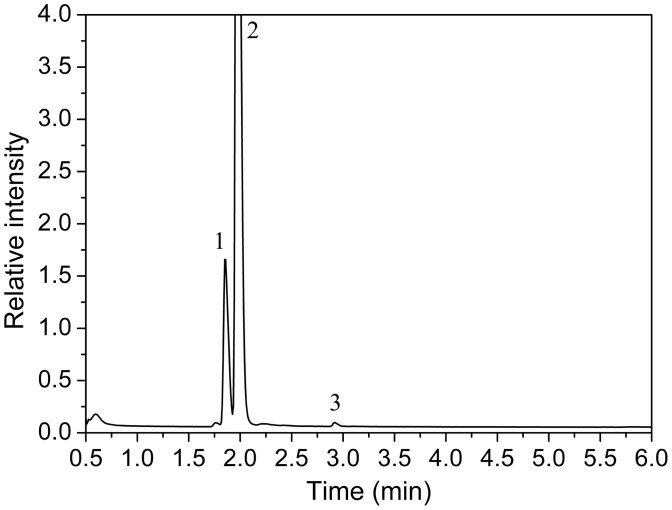
For the analytical performance evaluation of the NMCPC device it is necessary to firstly quantify the spirit sample to be analyzed by laboratory devices. The components of the real spirit sample were identified by GC-MS method. A prepared methanol-containing alcohol sample (subtraction water) was injected for the test. The MS analysis reveals 3 peaks from their high resolution masses as shown in Figure 4. In this sample, ethanol is 84.3%, methanol is 12.2% and acetic ester is 3.5% respectively (supporting information shows MS data in detail). For most China spirit drinks, besides water, ethanol and acetic ester are the two main components. Based on these components, almost none of other interference could be taken into account for the further spectral measurements.
Figure 4. Analysis of the composition of the spirit.
Representative GC-MS traces of a real spirit sample containing methanol characterization by 3 main peaks (0–6 min): (1) methanol; (2) ethanol; (3) acetic ester.
As is well-known that methanol and ethanol have similar molecular structures because their functional groups include CH3−, OH− and CH3−, CH2−, OH− respectively. Normally, it is difficult to distinguish these functional groups by traditional microplasma OES since they have almost the same emission peak bands. But as a stable microplasma source is used in detecting the two molecules by delicate discriminating the emission details, making some comparison by peak height or peak area of emission bands between these compounds are available.
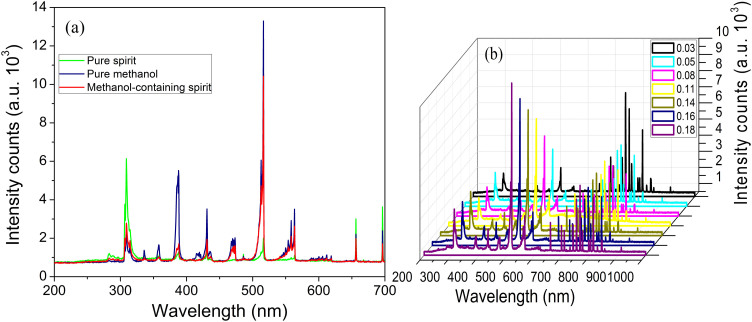
The composition of the plasma connecting the sample-introduction vessel is composed of a high percentage of water, acetic ester, ethanol and methanol vapors. The latter two components will then be expected to dominate the resultant optical emission spectra. Figure 5(a) shows the changes in the intensity of typical emission spectra on argon gas containing pure spirit, pure methanol, and methanol-containing spirit (16%) respectively. By evaporating the sample into the plasma region without capillary separation, we can collect a spectrum response in real time with a very fast speed (within 1 min). Among the different bands detected, apart from the Ar 4p → 4s atomic emission lines and the OH− band at 306 nm, the most important features corresponding to the CH− emission bands locate at 388.3, 314 and 431.4 nm and the Swan band system of C2 line (516.35 nm) corresponding to the Balmer series5, suggesting that methanol and ethanol are dissociated directly by the argon microplasma22. It should be emphasized that the detailed structure of two of these bands, the CH− band at 388.3 nm and the C2 Swan band at 516.35 nm, are observed with interesting differences for the 3 samples. Interestingly, the C2 and CH− emission intensities increase markedly at methanol addition but increase slightly with ethanol concentration. Although acetic ester is another major component of the spirit, concerning the offset effect in the background for all solution samples, thus, we think the microplasma spectrometry is determined mostly by the methanol concentration.
Figure 5. Comparison of the emission of spirit, methanol and methanol-containing spirit.
(a) Emission spectra obtained in the presence of pure spirit (green line), pure methanol (blue line), and methanol-containing spirit (red line). (b) OES emission intensity versus the standard samples with varieties of methanol concentrations. The applied power is about 5 W.
Even without an on-line pre-concentration step, the OES response of the undiluted alcohol samples shows an acceptable resolution to the contained methanol. The 516.35 nm peak may be the best peak for monitoring methanol vapor as the changing contributions at this wavelength are significant compared with other spectral areas. So the choice of 516.35 nm from the changed peaks is justified by the fact that it corresponds to the optimum of response amplitude to methanol as shown in Figure 5(a).
A series of emission intensity plotting as a function of the varying methanol: ethanol in mass ratio is constructed from 7 standard samples as indicated in Figure 5(b). It is obvious that, compared with other emission peaks, the 516.35 nm peaks of these samples drastically increase with the concentration increases, which indicates that the NMCPC shows a satisfactory sensitivity toward methanol vapor.
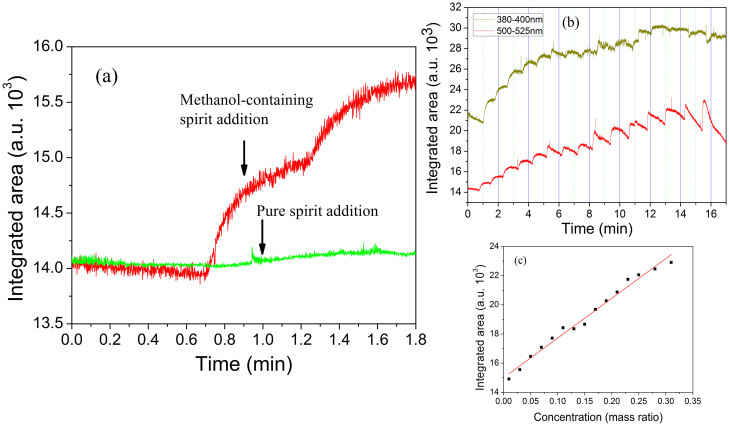
Another aspect to be considered is the ability of the NMCPC sensor to discriminate between ethanol and methanol vapors it is submitted. Integrated areas located at 388.3 nm (R1: 380–400 nm) and 516.35 nm (R2: 500–520 nm) are selected for the comparison. Figure 6(a) shows response of the sensing element in the presence of the pure spirit (green line) and the methanol-containing spirit (red line). Upon addition of the methanol-containing samples, the R2 band shows an obvious sensing response signal (Figure 6(a)), which compares reasonably well with the results in Figure 5.
Figure 6. Detection of the methanol-containing sample by time-response method.
(a) Comparison of the response on introduction of the pure spirit (green line) and the methanol-containing spirit (red line) by monitoring the integrated area of R2 upon the elapsed time. A significant increase in intensity is evident upon methanol-containing sample addition. (b) Emission intensities as a function of time on gradient addition of various concentrations (0.01 to 0.31 mass ratios) of the methanol-containing alcohols by monitoring the integrated area of R1 and R2. (c) Calibration curve between the integrated area of R2 and the concentration of methanol in the alcohol samples. Lines are weighted linear fitting to the data obtained from 15 injected samples (5 μL for each).
Figure 6(b) is a typical emission spectrum obtained upon methanol-containing vapor addition using a continuous sampling mode. In the case of methanol-containing alcohol introduction, the range of R1 and R2 bands represent the strongest response signals of all spectral ranges. The response of both R1 and R2 can be characterized by a fast increase of integrated area, followed by a slow decrease of the signal to a steady state value. It is noted that emission at R1 for methanol is significantly less efficient, whereas band R2, which is attributed to the C2 emission, shows the best sensing response for methanol (Figure 6(b)). The result confirms that the microplasma emission spectra bands depend on the types of the introduction vapor molecules.
To estimate the analytical performance of methanol-containing samples, we are able to establish the linear relationship between the peak intensity and the methanol concentrations as shown in Figure 6(c). Generally, sensitivity of a gas sensor is identified as the slope of a plot between the sensing response and mass concentration of the gas. Figure 6(c) shows a plot of the average response versus the mass concentration of the methanol-containing samples. It can be seen that the average gas sensing response increases lineally with the increasing methanol concentration. The calibration curves between the methanol concentrations (mass %) and the average response are calculated in the form of the linear equation (y = mx + i). The slope (m) and intercept (i) of the calibration curve is calculated to be 27.22 and 15.00 respectively.
Discussion
Firstly the discharge stability of the NMCPC is discussed. Like other DC microplasma sources, the cathode needle sputtering is anyhow inevitable even for the NMCPC device. Needle tip fouling occurs fast (from white to black) with narrower distance parameters (from the discharge zone to the PDMS surface, Figure 3) during the discharge course which could be observed by eyes. Under this circumstance, the microdischarge becomes unstable which is expressed by violent fluctuation of spectral signals, and has strong tendency to extinguish even at higher voltages. But as one distinct advantage of the NMCPC, the needle electrode can be easily replaced by another one if there is heavy deposition on its tip. Or after working for a period of time, the needle may be pulled out, conveniently cleaned by scratching on abrasive papers or dipped in acid solutions to remove the fouling layers and resume its activity. Normally after continuous working of about 3–4 h the needle electrodes will be replaced by new ones. Therefore, the working lifetime of the NMCPC device can be greatly prolonged. Another advantage of the NMCPC is that the needle electrodes do not contact the surface of the PDMS, so the discharge zone is intact with any media which prevents contamination from the PDMS material into the microplasmas.
In addition, since the discharge chamber is constructed in transparent PDMS materials, the emission of the microplasma can be easily detected by the probe of the optical fiber. Besides, the PDMS walls can well protect the microplasma from outside disturbance. And the chamber could be repaired by its original precursor (pre-polymer adhesive) even if there are wide drills in the PDMS walls, so the sealability of the chamber can be well maintained. The setup was once tested for leaks using a gas leak detector and good sealability (0.1–0.35%) could be detected around this chamber. While in many normal GD microplasma chips previously prepared in our lab, leaks sometimes are sometimes found in epoxy-glued parts and at the Teflon sleeve connections. Another interesting property of the NMCPC is that the cavity chamber is sealable. A removable square PDMS plug is used to seal the chamber. It's useful when after continuous working for a period of time (about 3–4 h), the inside of the chamber could be cleaned by a micro brush or chemical solvents if there were much contamination deposition in the bottom of the cell. It is also helpful to reduce the influence from the PDMS and analyte substrates. Hence a stable mircodischarge can be sustained in the NMCPC device.
Even so, speaking of the stability, the NMCPC also has some shortcomings. It should be noted that occasionally variation caused by gas pressure fluctuation, applied current variation, placement of the optical fiber, and sample changing may be observed, and all of which could be regulated to decrease the negative effects. While these factors are steady and the whole optical platform is well fixed, the variation can be decreased.
Then the sensitivity of methanol-containing alcohols is discussed based on Figure 5 and 6. The prominence of the C2 band (516.35 nm) can, in the case of methanol, simply be explained by the fact that it is a breakdown product of the molecule23. The C2 peak resulted by methanol may be attributed to that the low molecular weight alcohol has a stronger proton affinity24. Methanol has the tendency to form proton-bound dimer or trimer cluster ions in the presence of H2O in the microplasma25, the most striking feature had been observed in PTR-MS by other authors26. The cited reference pointed that water loss from the proton-bound dimers of methanol and ethanol occurs readily to form fragment ions. And the ion at m/z 47 is appointed to the most abundant ion in methanol mass spectrum and this ion is the fragment caused by the loss of water from the proton-bound dimers. Based on this analysis, we suggest loss of water molecules from the proton-bound dimer ions will dominate in the emission spectrometry (Figure 5a). Besides, in the microplasma, the dimers increase in abundance with decreasing temperature26 (the estimated temperature of the microplasma is below 350°C). On the other hand, the formation of C2 groups from methanol requires recombination of molecular fragments and this recombination rate is proportional to the concentration of the fragments squared, so the higher vapor pressure of methanol (higher than ethanol) may be a supplement explanation.
Analysis of the detection limit of methanol is based on the integrated area of R2. Integration of the measured background spectra over the same wavelength yields the standard deviation of the background noise to be N = 0.029 counts (103). Therefore, the detector's noise level of 3 N = 0.087 counts (103) is used to determine the molecular detection limits27. Calibration curves for methanol, using peak area is shown in Figure 6(c). The limit of detection (LOD) is calculated as 3 multiplied by the standard deviation of the sensing response divided by the slope of the calibration curve as 3N/S, where S is the signal expressed as the integrated area from R2. From the slope calculated in Figure 6(c) the S is 27.22. Hence the LOD is subsequently calculated to be 0.3%. Although the LOD value is not impressive by present optical emission standards, consideration of the fact that the introduced volumes are only 5 μL yielding a more reasonable absolute value of ~0.75 mL methanol for each bottle of spirit drink (250 mL per bottle, Erguotou Brand), and concerning the use of the NMCPC as a low-power (<10 W), fast-response (<1 min for each injection), off-chromatographic detector, the LOD obtained to this point is promising. Additionally, five repetitive measurements of the detection were performed and the RSD for the area responses was <5%, which is considered acceptable for manual injections. These properties make this NMCPC sensor suitable for use in fast-aid and portable equipment that could monitor the quality of business spirit samples.
The NMCPC device can also be connected with a commercial GC and MS system for advanced application to many kinds of samples. We currently carry out the experiment of placing liquid samples containing volatile compounds in the chamber of a larger sized NMCPC. In the chamber the volatile compounds (acetone, chloroform, etc.) will be evaporated directly into the microplasma and be analyzed by a portable spectrometry device.
The most limiting features of the methanol VOC measurement on the NMCPC device at present are the demand of quick capturing the data in certain time, otherwise the liquid samples will vanish by evaporation within 3 min. Besides, as mentioned above, occasionally some fluctuation of the discharge or variation occurs under the influence of gas velocity, power supply or sample injection. It is still worth carrying out further studies to improve the performance of the NMCPC sensor.
Conclusion
In summary, a NMCPC device has been developed for the analysis of VOC samples based on emission spectrometry. In this NMCPC device, a microplasma is produced between the tips of two needles in a cavity PDMS chamber (5 × 10 × 10 mm3). Argon gas was used as the microplasma source for molecular degradation and excitation. Different from conventional microplasma devices in previous studies, the needles of the NMCPC arrangement can act as either the electrodes or gas channels. Characterization of the NMCPC by voltage, current and electrode gaps is investigated. SEM and EDX methods have been employed to disclose the influence between the discharge region and the PDMS substrate. Compared to many traditional microplasma devices previously prepared by our group, the NMCPC configuration shows significant advantages. One of the strongest features of this glow discharge device is that they operate in an intact environment and are, thus, keeping a distance from PDMS substrate contaminants. This configuration allows for the creation of active species without generating excessive heat which may damage the PDMS substrates or cause excessive dissociation. Stable discharge could be realized for a long time because the cross-affection between the discharge and the substrate is greatly decreased. Besides, the transparent PDMS walls can protect the stable discharge and act as the optical window for signal collection. Molecular emission spectrometry is used to detect methanol-containing spirit samples. Relative intensity of the C2 band at 516.35 nm shows interesting differences for pure spirit and methanol-containing spirit samples. The emission peak at 516.35 nm is deliberately chosen as the analytical wavelength for the performance estimation. Methanol could be detected with a detection limit of 0.3%, using the 500–525 nm integrated areas upon time in a continuous mode. In light of its application as a GC-free and small-volume detector for certain VOCs, this result is desirable. Compared with GC-MS, this detector can provide a fast response, while a GC-MS system always needs significant vacuum pumping before it can be used. In addition, the NMCPC sensor is easy to fabricate, convenient to operate and portable to carry. Future development has been carried out to improve the detection efficiency and for other VOCs analysis.
Methods
Construction of optical platform for NMCPC
A Sylgard 184 kit (Dow Coning Corporation) containing PDMS pre-polymer (Sylgard 184-A) and curing agent (Sylgard 184-B) was employed. The pre-polymer has the physical form of a colorless liquid with a specific gravity and viscosity. The pre-polymer and the curing agent were mixed in a glass vessel at a weight ratio of 10:1 by striation for 20 min. Then, the mixture was baked in an oven at 120°C for 15 min after all bubbles escaped from the mixture. A rectangular iron plate (5 × 10 × 20 mm3) was used as a pattern template placing right in the center of mixture. After the pre-polymer mixture converted to solid PDMS substrate, the template iron plate was carefully plugged out to form a hollow cell in the PDMS. A sharp knife was used to cut the PDMS substrate into a cuboid shape to form the microplasma chamber. A ceramic plate was mounted at the bottom of the chamber by the pre-polymer adhesive. This ceramic base can act as a stand for the NMCPC and a heat transfer substrate. Then the semi-manufactured chamber was treated through heat molding at 120°C for 15 min in the oven. After the PDMS chamber was fabricated, its surface was cleaned with acetone in an ultrasonicator for 5 min. A PDMS cuboid, with a similar dimension of the iron template, was cut from another PDMS substrate to serve as the seal plug of the cavity chamber. The outer dimensions of the chamber are 10 × 15 × 25 mm3 and the thickness of the chamber wall as the optical window is 5 mm. Finally the sealable PDMS chamber, with a volume of 5 × 10 × 10 mm3 with the plug, was formed and carefully mounted on an optical base by screws.
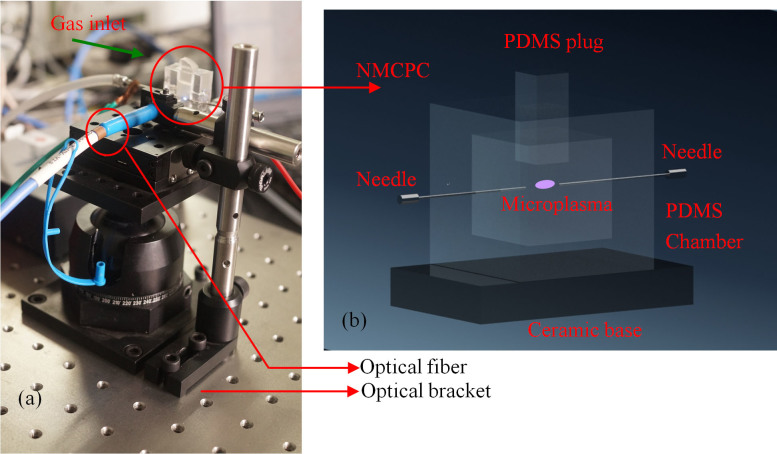
Schematic picture and drawing of the overall optical system and detector are shown in Figure 7. Figure 7(a) is a photograph of the optical support for the NMCPC. The NMCPC sensor was mounted on a three-dimensional stainless steel holder which affords it almost 360° rotation ability in space. The steel holder was built with standard optical units. A clamp block with an appropriate hole was employed to butt the probe of an optical fiber.
Figure 7. Optical platform and NMCPC configuration.
(a) Photograph of the setup of the optical platform for the NMCPC; (b) Diagrammatic representation for the component details of the NMCPC.
Components of the NMCPC are depicted in Figure 7(b) in detail. Two syringe needles, with 1 mm in diameter, were inserted opposite each other by penetrating into the PDMS walls. The inlet needle was connected to a precise mass flow controller. The needle was adjustable and attached to a copper wire which served as the electrical connections. Typically a gap of 0.5 to 2 mm was thus formed between the tips of the two needles. Power to the needle electrodes was provided with a purpose-made DC voltage generator delivering 0 to 3 kV. The microplasma could be sustained at atmospheric pressure in argon for flow rates between 10 and 280 mL min−1.
Measurement setup
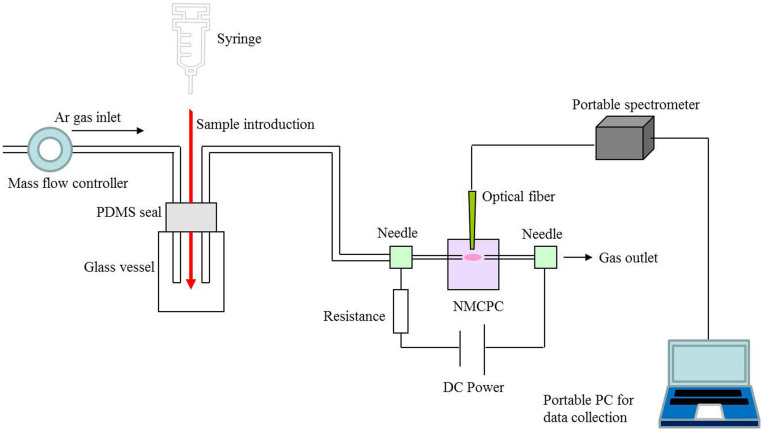
Diagrammatic representation of the experiment setup is shown in Figure 8. Operation in argon gas was attained using a mass flow controller. A glass vessel with a PDMS seal, which served as a sample introduction trap, was placed in the front of the NMCPC device in the gas route. The plasma was generated in a constant voltage mode from 300 to 1000 V, employing an argon flow rate of 250 mL min−1. The inlet needle was connected to the cathode while the outlet needle to the anode with copper wires because many emission peaks are stronger in the cathode glow19. The light emitted from the rectangular plasma chamber was picked by a quartz optical fiber and guided to an Ocean Optics S2000 spectrometer (grating, 600 lines mm−1; slit width, 50 μm). The light intensity for all optical emission spectra in this work was given in units of detector counts. Each typical spectrum was recorded between 200 and 1000 nm. A portable PC connecting the optical fiber was employed for the emission spectra data collection.
Figure 8. Measurement setup.
Schematic diagram of the experimental setup.
Analyte standard solutions were prepared from commercial products from a supermarket in Chengdu. All of the testing solutions (alcohol samples) were prepared by addition of methanol into the real spirit (Erguotou Brand, 56°) to obtain a series of concentrations (mass ratio). The sample was injected into the glass vessel by penetrating the PDMS seal with a syringe and was carried by the argon carrier gas to the chamber immediately. Unless stated otherwise, 5 μL of standard solution was injected using a syringe each time.
Before spectral measurement, the distance and intersection angle between the NMCPC and the probe of the optical fiber was adjusted to collect the best optimal signals. Then the NMCPC and the fiber probe were fixed on their positions by tightening the screws for further experiments. Before investigating the sensing behavior of the NMCPC system, we investigated whether the configuration parameters could influence the microdischarge stability and sensitivity toward alcohol VOCs. In this work, the detection of alcohol VOCs was based on the measurement of emission changes within a set of defined spectral ranges.
Instrumental
The morphology, microstructure, and composition of the PDMS walls were examined by scanning electron microscopy (SEM) and energy dispersive X-ray (EDX) spectra, which was performed using a Hitachi Ultra-high-Resolution S-4300 microscope.
GC-MS analysis was carried out on Agilent Technologies 7890A GC system equipped with split/splitless mode and programmed temperature vaporizer inlet, and 7000B GC/MS Triple Quad equipped with electron impact ionization (EI). The carrier gas was helium; the flow rate of carrier gas and backflushing were 14 mL min−1 and 1 mL min−1 respectively; the inlet temperature was set at 220°C; the injection volume was 1 μL.
Author Contributions
D.L. carried out the main experimental process, performed the data analysis and wrote the full article; Y.D. designed the whole experimental setup, made theoretic guidance and reviewed the article; Y.H. performed SEM & EDX analysis and helped building the electrical setup; B.G. prepared some samples and operated the GC-MS device. All authors reviewed the manuscript.
Supplementary Material
Supporting information
Acknowledgments
The authors warmly acknowledge the National Science Foundation for Young Scholars of China (Grant No. 21105069) and the International Science & Technology Cooperation Program of China (no. 2013DFG50150).
References
- Luo D. B. & Duan Y. X. Microplamsas for analytical applications of lab-on-a-chip. TrAC-Trend. Anal. Chem. 39, 254–266 (2012). [Google Scholar]
- Liang D. C. & Blades M. W. Atmospheric pressure capacitively coupled plasma atomizer for atomic absorption spectrometry. Anal. Chem. 60, 27–31 (1988). [Google Scholar]
- Schermer S. et al. An improved microstrip plasma for optical emission spectrometry of gaseous species. Spectrochim. Acta B 58, 1585–1596 (2003). [Google Scholar]
- Zhu Z. L., Chan G. C.-Y., Ray S. J., Zhang X. R. & Hieftje G. M. Microplasma source based on a dielectric barrier discharge for the determination of mercury by atomic emission spectrometry. Anal. Chem. 80, 8622–8627 (2008). [DOI] [PubMed] [Google Scholar]
- Duan Y. X., Su Y. X. & Jin Z. Capillary-based portable detector for chemical vapor monitoring. Rev. Sci. Instrum. 74, 2811–2815 (2003). [Google Scholar]
- Yanguas-Gil A., Focke K. & Benedikt J. Optical and electrical characterization of an atmospheric pressure microplasma jet for Ar/CH4 and Ar/C2H2 mixtures. J. Appl. Phys. 101, 103307 (2007). [Google Scholar]
- Kozlowski F., Huber B., Steiner P. & Lang W. Generating a microplasma with porous silicon. Sensor. Actuat. A 53, 284–287 (1996). [Google Scholar]
- Guchardi R. & Hauser P. C. Capacitively coupled microplasma for on-column detection of chromatographically separated inorganic gases by optical emission spectrometry. J. Chromatogr. A 1033, 333–338 (2004). [DOI] [PubMed] [Google Scholar]
- Guchardi R. & Hauser P. C. Determination of organic compounds by gas chromatography using a new capacitively coupled microplasma detector. Analyst 129, 347–351 (2004). [Google Scholar]
- Jin Z. & Duan Y. X. Simple, sensitive nitrogen analyzer based on pulsed miniplasma source spectrometry. Rev. Sci. Instrum. 74, 5156–5160 (2003). [Google Scholar]
- Tienpont B. et al. Features of a micro-gas chromatography equipped with enrichment device and microchip plasma emission detection (μPED) for air monitoring. Lab Chip 8, 1819–1828 (2008). [DOI] [PubMed] [Google Scholar]
- Eijkel J. C. T., Storeri H. & Manz A. A molecular emission detector on a chip employing a direct current microplasma. Anal. Chem. 71, 2600–2606 (1999). [Google Scholar]
- Naji O. P. & Manz A. A double plasma gas chromatograph injector and detector. Lab Chip 4, 431–437 (2004). [DOI] [PubMed] [Google Scholar]
- Yuan X., Ding X. L., Zhao Z. J., Zhan X. F. & Duan Y. X. Performance evaluation of a newly designed DC microplasma for direct organic compound detection through molecular emission spectrometry. J. Anal. At. Spectrom. 27, 2094–2101 (2012). [Google Scholar]
- Naji O. P. & Manz A. A double plasma gas chromatography injector and detector. Lab Chip 4, 431–437 (2004). [DOI] [PubMed] [Google Scholar]
- Horsman K. M., Bienvenue J. M., Blasier K. R. & Landers J. P. Forensic DNA analysis on microfluidic devices: a review. J. Forensic. Sci. 52, 784–799 (2007). [DOI] [PubMed] [Google Scholar]
- El-Ali J., Gaudet S., Günther A., Sorger P. K. & Jensen K. F. Cell stimulus and lysis in a microfluidic device with segmented gas-liquid flow. Anal. Chem. 77, 3629–3636 (2005). [DOI] [PubMed] [Google Scholar]
- Péres L. O., Li R. W. C., Yamauchi E. Y., Lippi R. & Gruber J. Conductive polymer gas sensor for quantitative detection of methanol in Brazilian sugar-cane spirit. Food Chem. 130, 1105–1107 (2012). [Google Scholar]
- Bessoth F. G., Naji O. P., Eijkel J. C. T. & Manz A. Towards an on-chip gas chramatograph: the development of a gas injector and a dc plasma emission dtetector. J. Anal. At. Spectrom. 17, 794–799 (2002). [Google Scholar]
- Wang Q., Economou D. J. & Donnelly V. M. Simulation of a direct current microplasma discharge in helium at atmospheric pressure. J. Appl. Phys. 100, 023301 (2006). [Google Scholar]
- Marcus R. K. & Davis W. C. An atmospheric pressure glow discharge optical emission source for the direct sampling of liquid media. Anal. Chem. 73, 2903–2910 (2001). [DOI] [PubMed] [Google Scholar]
- Chen Q. et al. Microplasma discharge in ethanol solution: Characterization and its application to the synthesis of carbon microstructures. Thin Solid Films 516, 4435–4440 (2008). [Google Scholar]
- Eijkel J. C. T., Stoeri H. & Manz A. A dc microplasma on a chip employed as an optical emission detector for gas chromatography. Anal. Chem. 72, 2547–2552 (2000). [DOI] [PubMed] [Google Scholar]
- Smith D. & Španěl P. Selected ion flow tube mass spectrometry (SIFT-MS) for on-line trace gas analysis. Mass Spectrom. Rev. 24, 661–700 (2005). [DOI] [PubMed] [Google Scholar]
- Feng W. Y., Iraqi M. & Lifshitz C. Reactions of H+(CH3OH)3 with a series of base molecules. J. Phys. Chem. 97, 3510–3514 (1993). [Google Scholar]
- Maleknia S. D., Bell T. L. & Adams M. A. PTR-MS analysis of reference and plant-emitted volatile organic compounds. Int. J. Mass Spectrom. 262, 203–210 (2007). [Google Scholar]
- Minayeva O. B. & Hopwood J. A. Microfabricated induced coupled plasma-on-a-chip for molecular SO2 detection: a comparison between global model and optical emission spectrometry. J. Anal. At. Spectrom. 18, 856–863 (2003). [Google Scholar]
Associated Data
This section collects any data citations, data availability statements, or supplementary materials included in this article.
Supplementary Materials
Supporting information


