

Abstract
Background: One-carbon metabolism, which is crucial in DNA synthesis and genomic stability, is an interrelated network of biochemical reactions involved in several dietary and lifestyle factors. The development of the homocysteine score using these factors may be useful to reflect the status of one-carbon metabolism in large epidemiologic studies without biologic samples to measure homocysteine directly.
Objective: The aim of this study was to develop an homocysteine score that reflects one-carbon metabolism better than individual dietary or lifestyle factors.
Methods: We divided 2023 participants with measured plasma total homocysteine data in the Nurses’ Health Study and the Health Professionals Follow-Up Study into training (n = 1619) and testing (n = 404) subsets. Using multivariable linear regression, we selected lifestyle determinants of plasma homocysteine in the training set and derived the homocysteine score weighted by the β coefficient for each predictor. The validation of the homocysteine score was assessed using the plasma homocysteine in the independent samples of the training set.
Results: In the training set, smoking, multivitamin use, and caffeine, alcohol, and dietary and supplemental folate intake were significant independent determinants of plasma homocysteine in multivariable linear regression (P ≤ 0.01) and were included in the derivation of the homocysteine score. The Pearson correlation of the homocysteine score with plasma homocysteine was 0.30 in the testing subset (P < 0.001). The homocysteine score was positively associated with the plasma homocysteine concentration in the testing subset and in an independent population of women; the mean difference of plasma homocysteine concentration between the extreme quintiles of homocysteine score ranged from 0.83 μmol/L to 1.52 μmol/L. Population misclassification either from the lowest quintile of plasma homocysteine into the highest quintile of the homocysteine score or from the highest quintile of plasma homocysteine into the lowest quintile of the homocysteine score was ≤12%.
Conclusion: These data indicate that the homocysteine score may be used with relatively inexpensive and simple questionnaires to rank an individual’s one-carbon metabolism status when homocysteine data are not available.
Keywords: homocysteine, one-carbon metabolism, diet, determinants, prediction, epidemiology
Introduction
One-carbon metabolism is an interrelated network of biochemical reactions that transfers methyl groups from one compound to another (1, 2). This network maintains DNA integrity by mediating the biosynthesis of purine and pyrimidine and the epigenetic signature by donating methyl groups for DNA methylation (1, 2). In particular, epigenetics incorporates inheritable as well as reversible phenomena that affect gene expression and stability without a change in the DNA base pairs (3). Potential disruption of metabolism due to an insufficient supply of relevant nutrients and imbalance of relevant dietary factors has been associated with cancer (4–6) and other health conditions (7, 8).
Homocysteine, a naturally occurring sulfur-containing amino acid, is a key intermediate of one-carbon metabolism and may serve as a surrogate marker of one-carbon metabolism status (2); homocysteine reflects branch points in methionine synthesis and connects several B vitamins, including vitamins B-2, B-6, and B-12, folate, choline, and betaine (1, 2). Compared with individual nutrients that partially mediate one-carbon metabolism (1, 2), homocysteine may reflect the global network of one-carbon metabolism while simultaneously representing the optimum balance of these multiple nutrients. Homocysteine concentrations have been associated with several disease outcomes, including cancer, cardiovascular disease, neurodegenerative disease, and pregnancy complications (9).
Currently, the largest amount of plasma homocysteine information is available in the NHANES, which includes 16,254 plasma samples (10). However, large prospective cohort studies often either do not have blood samples to measure homocysteine or have homocysteine measurements for a much smaller subgroup of the population. These studies instead evaluate related nutrients individually or a combination of a few of them at a time in relation to disease outcomes (11–13). A single measurment that can incorporate these dietary factors as well as lifestyle factors that affect the homocysteine concentration would be useful.
Lifestyle determinants of blood homocysteine concentrations such as age, sex, smoking, BMI, and diet (14) are relatively well established, and information regarding these factors is readily available through questionnaire data in most epidemiologic studies. Therefore, we quantified the association of each determinant with the homocysteine concentration in the training set, derived an homocysteine score, and conducted a validation study of the homocysteine score in the independent samples of the training set. To the best of our knowledge, no previous study has attempted to derive an homocysteine score.
Methods
Study population.
Participants were selected from the blood sub-cohort of the Nurses’ Health Study (NHS)11 (15) and the Health Professionals Follow-Up Study (HPFS) (16). The NHS enrolled 121,700 female nurses aged 30–55 y in 1976. The HPFS enrolled 51,529 male health professionals aged 40–75 y in 1986. Lifestyle and medical history information was collected and updated via a biennial follow-up questionnaire in the NHS and HPFS. Blood samples were collected from the subpopulations of the NHS (n = 32,826) in 1989–1990 and the HPFS (n = 18,225) in 1993–1994. The NHS and HPFS had similar blood collection protocols. Blood samples drawn from each participant were immediately packed in ice and then shipped via overnight courier; 97% of the samples arrived at the laboratory within 26 h. Upon arrival, the samples were processed and separated into plasma, red blood cell, and white blood cell components. The samples were archived and placed in continuously monitored liquid nitrogen freezers (≤−130°C) (15–17).
This study included the population with measured plasma homocysteine concentrations. We obtained homocysteine samples from nested case-control studies of chronic diseases in the NHS and the HPFS. To limit postprandial influence (18), we included homocysteine samples only from participants who had fasted for >8 h. Among fasting homocysteine samples, we excluded any cases diagnosed after the blood draw, outliers of the homocysteine concentration within each batch using the generalized extreme Studentized deviate many-outlier approach (19), and participants without information on potential determinants of homocysteine selected a priori. The final sample size included 1585 women in the NHS and 438 men in the HPFS. All participants provided written informed consent. The institutional review boards of the Harvard School of Public Health and Brigham and Women’s Hospital approved this study.
Measurement of plasma homocysteine.
Most of the homocysteine samples were assayed using HPLC with fluorescence detection (20) at the Jean Mayer USDA Human Nutrition Research Center on Aging at Tufts University. Samples obtained from the pancreatic cancer nested case-control study were assayed at the Children's Hospital (Boston, MA) with an enzymatic assay on a Hitachi 917 analyzer (Roche Diagnostics) using reagents and calibrators from Catch (21); however, these different analytic methods were previously shown to produce highly correlated and comparable results (22). Similarly, in our study, the plasma homocysteine concentrations measured with each assay method did not significantly differ. The intra-assay coefficients of variation of homocysteine were generally <10%. We considered batch variation, and standardized the homocysteine concentrations to an average batch separately in the NHS and HPFS (23)
Assessment of determinants of the homocysteine concentration.
A priori, we identified dietary factors (caffeine, alcohol, folate, riboflavin, pyridoxin, cyanocobalamin, betaine, choline, methionine, and multivitamin use) and other lifestyle factors (BMI, smoking, and physical activity) as candidates for inclusion in deriving the homocysteine score; we selected candidates based on their homocysteine metabolism (1, 2) and the consistency of association found in the literature (10, 18, 24–34). We used the candidate information from the questionnaire closest to the blood draw (the 1990 questionnaire for the NHS and the 1994 questionnaire for the HPFS).
The NHS and HPFS assessed usual dietary intake over the previous year by administering a validated semiquantitative FFQ approximately every 4 y during follow-up. We calculated nutrient intake by multiplying the frequency response of each specified food item by the nutrient content of the specified portion sizes and summing these products for all food items; we estimated nutrient intake using food composition data from the USDA and other sources. Use of multivitamins and other dietary supplements, including frequency of use and brand name (for multivitamins only), was ascertained biennially using a questionnaire. Total nutrient intake included dietary and supplemental sources. We calculated energy-adjusted nutrient intakes with the residual method (35). We considered the report of an implausible intake of total calories (<600 or >3500 kcal/d for women and <800 or >4200 kcal/d for men) or a report of blanks for >70 items on the FFQ to be an error and set it as missing.
The correlation coefficient of the nutrient intake from the FFQ and from dietary records spaced over a year (4 1-wk records for women and 2 for men) ranged from 0.36 to 0.75 for women and from 0.28 to 0.86 for men (36, 37). Of particular interest, the correlation coefficients of one-carbon metabolism–related nutrients estimated from the FFQ and from dietary records ranged from 0.58 for riboflavin to 0.90 for alcohol (for women) and from 0.56 for cyanocobalamin to 0.88 for riboflavin (for men) (12, 36, 37). When folate intake was compared with red blood cells, the correlations were 0.55 in women and 0.56 in men (38). Choline and betaine intake measured with our FFQ predicted plasma homocysteine concentrations (27, 39). The correlation coefficients for coffee, tea, and cola drinks with dietary records were at least 0.78 in women (40) and 0.77 in men (41).
The NHS and HPFS collected nondietary information and updated it by administering biennial self-reported questionnaires. We calculated participants’ BMIs using height reported at baseline and weight reported at each biennial cycle. The participants reported smoking status and the average time per week for walking, jogging, running, bicycling, swimming, tennis, squash/racquetball, rowing, and calisthenics biennially. We calculated total activity, summing a metabolic equivalent task score for each activity.
Statistical analysis.
We randomly divided the study population from the NHS and HPFS into a training set (four-fifths population) and a testing set (one-fifth population) within each cohort; participants’ characteristics from the training and testing sets were presented with the continuous variables reported as means ± SDs and the categorical variables as percentages. The training set was used to derive the homocysteine score, whereas the testing set was used to assess the unbiased validity of the homocysteine score.
Derivation of the homocysteine score in the training set.
The homocysteine concentration was log-transformed to improve the normality. To pool participants from the NHS and the HPFS (Supplemental Table 1), the residual of homocysteine that was independent of gender, total caloric intake, and immutable factors (35) was calculated; we built a statistical model that included log-transformed homocysteine as a dependent variable and gender, age, and total calorie intake as independent variables. The mean of the log-transformed plasma homocysteine was then added to the residual so that it could be referred to as log-transformed form of the measured homocysteine concentration.
We conducted 2 selection processes to finalize the determinants to include in creating the homocysteine score using the F test on linear regression models. First, we fitted the univariate linear regression model with log-transformed plasma homocysteine as a dependent variable and potential predictors of plasma homocysteine, which include smoking status (never, past, and current), BMI (continuous), physical activity (continuous), multivitamin use (no or yes), and caffeine, alcohol, dietary folate, supplemental folate, total riboflavin, pyridoxin, cyanocobalamin, betaine, choline, and methionine intake (continuous) as an independent variable.
 |
where X = ln (homocysteine) and Z = the candidate of the plasma homocysteine determinant.
We then expanded the model to the multivariable model (model 2), and included all the candidates that were significant in the univariate model (P < 0.05).
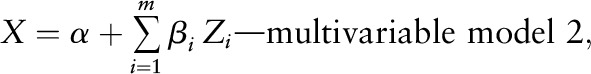 |
where X = ln (homocysteine), m = the total number of candidates of the plasma homocysteine determinants selected from the variables that were statistically significant (P < 0.05) in the univariate model, and Zi = the candidate i of the plasma homocysteine determinants.
To calculate the homocysteine score, we refitted the multivariable model including the determinants that remained significant in multivariable model 2 and examined 2-way interactions with alcohol and all the determinants. Then, we calculated the homocysteine score weighted by its β coefficients.
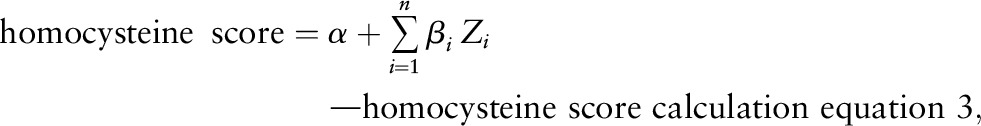 |
where n = the total number of determinants of the plasma homocysteine concentration selected from multivariable model (2), and Zi = the determinant i of the plasma homocysteine concentration.
Validation of homocysteine score in the testing set and the NHS II.
In our testing set, we calculated the Pearson correlation coefficients between the plasma homocysteine and the homocysteine score and examined the mean of homocysteine concentration according to quartiles of homocysteine score. We further cross-classified the population by both quintiles of the plasma homocysteine and the homocysteine score and examined the degree of misclassification of the homocysteine score by investigating the proportion of study participants who were classified as within the extreme quintiles of the plasma homocysteine and the homocysteine score. To compare the performance of this score with other approaches, we compared the correlation and the degree of misclassification of the homocysteine score with plasma homocysteine to those from the individual factors with a strong prior mechanism within homocysteine metabolism (1). In addition, to evaluate the external validity of the homocysteine score in an independent population from which the homocysteine score was derived, the homocysteine score was created using homocysteine score calculation equation 3 among 586 women with plasma homocysteine concentrations in the NHS II, a cohort study of female nurses who were younger than the NHS participants and provided blood samples in 1996–1999 (17). We examined the mean concentration of plasma homocysteine according to quartiles of homocysteine score.
All statistical tests were 2-sided with a significance criterion of P < 0.05. SAS version 9 for UNIX (SAS Institute) were used for analyses.
Results
The participants’ characteristics in the training set and the testing set were similar at the time blood was drawn (Table 1). Approximately 40% of women (mean age 59 y) used multivitamins, and 20% were current smokers. The mean total folate intake was 442 μg/d, and the mean alcohol consumption among drinkers was 9 g/d. Among men (mean age 64 y), ∼55% used multivitamins, and 7% were current smokers. The mean total folate intake was 572 μg/d, and the mean alcohol consumption among drinkers was 15 g/d. The interquartile range of the plasma homocysteine concentration was 8.8–12.9 μmol/L in women and 11.3–16.0 μmol/L in men.
TABLE 1.
Age-standardized characteristics of men and women from the training and testing sets in the NHS and the HPFS1
| NHS |
HPFS |
|||
| Training set | Testing set | Training set | Testing set | |
| Participants, n | 1268 | 317 | 351 | 87 |
| Fasting plasma homocysteine,2,3 μmol/L | 10.7 (8.8–12.9) | 10.7 (8.8–13.2) | 14.1 (11.3–16.0) | 13.3 (11.0–16.2) |
| Age at blood draw,2 y | 59.3 ± 7 | 59.2 ± 7 | 63.8 ± 9.0 | 64.8 ± 10.4 |
| BMI, kg/m2 | 25 ± 4 | 25 ± 4 | 25 ± 3 | 25 ± 3 |
| Physical activity,4 MET/wk | 16 ± 19 | 16 ± 17 | 31 ± 30 | 36 ± 31 |
| Current smokers, % | 20 | 19 | 7 | 7 |
| Current multivitamin users, % | 42 | 44 | 55 | 55 |
| Nondrinkers of alcohol, % | 36 | 38 | 23 | 22 |
| Mean dietary intake5 | ||||
| Total calorie intake, kcal/d | 1759 ± 487 | 1733 ± 472 | 1938 ± 587 | 1947 ± 584 |
| Caffeine, mg/d | 265 ± 225 | 227 ± 208 | 204 ± 209 | 280 ± 246 |
| Alcohol among drinkers, g/d | 9 ± 11 | 10 ± 12 | 15 ± 16 | 14 ± 14 |
| Total folate, μg/d | 442 ± 229 | 445 ± 210 | 572 ± 345 | 625 ± 348 |
| Total riboflavin, mg/d | 4 ± 7 | 5 ± 15 | 6 ± 22 | 6 ± 11 |
| Total pyridoxin, mg/d | 8 ± 24 | 9 ± 27 | 12 ± 40 | 18 ± 48 |
| Total cyanocobalamin, μg/d | 10 ± 10 | 11 ± 16 | 14 ± 24 | 13 ± 11 |
| Total betaine, mg/d | 110 ± 44 | 106 ± 39 | 137 ± 75 | 138 ± 51 |
| Total choline, mg/d | 312 ± 53 | 316 ± 52 | 366 ± 69 | 372 ± 55 |
| Methionine, mg/d | 2 ± 0.4 | 2 ± 0.3 | 2 ± 0.5 | 2 ± 0.4 |
Values are means ± SDs unless otherwise specified. HPFS, Health Professionals Follow-Up Study; MET, metabolic equivalent; NHS, Nurses’ Health Study.
Values are not age-adjusted.
Values are medians (IQRs).
Estimated as the sum of the average time per week spent in each activity × the MET value for that activity. MET is defined as the ratio of the work metabolic rate to the resting metabolic rate [(caloric need per kilogram body weight per hour activity)/(caloric need per kilogram body weight per hour at rest)].
Nutrient values are energy-adjusted intake.
There was an association between potential homocysteine determinants and the homocysteine concentration in the training set (Table 2). All potential determinants of plasma homocysteine except physical activity, BMI, and methionine were significantly associated with the homocysteine concentration in the univariate model. However, in the multivariable model, which included all significant determinants, only smoking status, multivitamin use, and caffeine, alcohol, dietary folate, and supplementary folate intake maintained a significant association with plasma homocysteine (Table 2). No statistically significant interactions were observed among alcohol and significant determinants. The associations between riboflavin, pyridoxin, cyanocobalamin, and betaine/choline and plasma homocysteine were attenuated and became nonsignificant; dropping multivitamin use from the model did not change the result. We calculated the homocysteine score by using the values of the significant homocysteine determinants in the training set (Table 3); the percentage of plasma homocysteine residuals explained by the prediction model was 7%. The most significant determinant of the derived homocysteine score was multivitamin use (partial R2 = 0.02).
TABLE 2.
Associations between lifestyle factors and fasting plasma total homocysteine concentration from a univariate and multivariate linear regression model in men and women from the training set of the pooled cohort (n = 1619)1
| Univariate result2 | Multivariate result3 | |||
| Lifestyle factor | β in log(homocysteine), μmol/L (per category or 1 SD)4 | P | β in log(homocysteine), μmol/L (per category or 1 SD)4 | P |
| Smoking | <0.001 | 0.003 | ||
| Never | 0 (referent) | 0 (referent) | ||
| Past | −0.020 | −0.018 | ||
| Current | 0.068 | 0.062 | ||
| Multivitamin use | <0.001 | 0.002 | ||
| No | 0 (referent) | 0 (referent) | ||
| Yes | −0.084 | −0.091 | ||
| Caffeine intake,5 mg/d | 0.027 | <0.001 | 0.020 | 0.01 |
| Alcohol intake, g/d | 0.025 | <0.001 | 0.024 | <0.001 |
| Dietary folate intake,5,6 μg/d | −0.026 | <0.001 | −0.016 | 0.01 |
| Supplementary folate intake,5,6 μg/d | −0.046 | <0.001 | −0.019 | <0.001 |
| Total riboflavin intake,5 mg/d | −0.020 | 0.004 | 0.003 | 0.84 |
| Total pyridoxine intake,5 mg/d | −0.020 | 0.003 | −0.008 | 0.35 |
| Total cyanocobalamin intake,5 μg/d | −0.024 | <0.001 | 0.003 | 0.97 |
| Betaine/choline intake,5 mg/d | −0.015 | 0.02 | −0.008 | 0.75 |
Fasting plasma homocysteine concentrations were ln-transformed, corrected for batch variation, and adjusted for age, gender, and total calorie intake by the residual method. Median log(homocysteine) is 2.46 μmol/L (mean = 2.46, SD = 0.27, min = 1.57, and max = 3.63).
Separate univariate models were run for each lifestyle factor.
Intercept (SE) = 2.530342146 (0.03599243); model R2 = 0.07.
One increment is the SD; SD is 211mg/d for caffeine intake, 12 g/d for alcohol intake, 120 μg/d for dietary folate intake, 221 μg/d for supplementary folate intake, 12 mg/d for total riboflavin intake, 29 mg/d for total pyridoxin intake, 14 μg/d for total cyanocobalamin intake, and 83 mg/d for betaine/choline intake.
Nutrient values are energy-adjusted intake.
We included dietary folate and supplementary folate separately in the model because of differential bioavailability between the 2 sources of folate.
TABLE 3.
Computational formula (homocysteine score = ∑ weightI × lifestyle factorI) for homocysteine score1
| Lifestyle factor | Weight (per category or 1 SD)2 | Partial R2 |
| Smoking | 0.004 | |
| Never | 0 | |
| Past | −0.020 | |
| Current | 0.044 | |
| Multivitamin use | 0.02 | |
| No | 0 | |
| Yes | −0.046 | |
| Caffeine intake,3 mg/d | 0.017 | 0.007 |
| Alcohol intake, g/d | 0.023 | 0.007 |
| Dietary folate intake,3 μg/d | −0.018 | 0.007 |
| Supplementary folate intake,3 μg/d | −0.031 | 0.01 |
Weight is the β coefficient for each determinant from the multivariable model which included lifestyle factors that were significantly associated with plasma homocysteine concentration in the multivariable result in Table 2.
One increment is the SD; SD is 211mg/d for caffeine intake, 12 g/d for alcohol intake, 120 μg/d for dietary folate intake, and 221 μg/d for supplementary folate intake.
Nutrient values are energy-adjusted intake.
To evaluate the robustness of the selection of the determinants, we also conducted a stepwise regression with a significance level of 0.05 to enter and stay in the model; the same set of determinants was consistently selected in the final model of stepwise regression. Using the mean dietary intake from the 2 previous questionnaire cycles did not change the result.
We evaluated the usefulness of the homocysteine score by calculating the Pearson correlation between the homocysteine score and plasma homocysteine (Table 4). The homocysteine score was modestly positively associated with the plasma homocysteine concentration (Pearson correlation coefficient r = 0.26 in the training set and 0.30 in the testing set, P ≤ 0.001); positive correlation was consistently observed when homocysteine score and homocysteine concentration were compared in the study population combining both training and testing sets (n = 2023) (Supplemental Table 2). When comparing participants within the higher quartiles of the homocysteine score to those within the lowest quartile, there was a linear increase in the homocysteine concentration in the testing set and in our external validation study in the NHS II (Figure 1); a similar trend was observed in both men and women (Supplemental Figure 1).
TABLE 4.
The Pearson correlation of homocysteine score or individual one-carbon metabolism–related nutrients with the actual plasma homocysteine concentration in men and women from the training and testing sets1
| Training set (n = 1619) | Testing set (n = 404) | |
| Homocysteine score | 0.26* | 0.30* |
| Alcohol intake | 0.08* | 0.11* |
| Total folate intake2 | −0.15* | −0.19* |
| Dietary folate intake2 | −0.14* | −0.05 |
| Supplementary folate intake2 | −0.16* | −0.19* |
| Total riboflavin intake2 | −0.23* | −0.15* |
| Total pyridoxin intake2 | −0.23* | −0.14* |
| Total cyanocobalamin intake2 | −0.15* | −0.12* |
| Betaine/choline intake2 | −0.10* | −0.08 |
| Methionine intake2 | −0.04 | −0.07 |
Fasting plasma homocysteine concentrations were ln-transformed, corrected for batch variation, and adjusted for age, gender, and calorie intake by the residual method. *P < 0.05.
Nutrient values are energy-adjusted intake.
FIGURE 1.

Fasting plasma total homocysteine concentration by quartiles of the homocysteine score in the testing set (n = 628) and in the NHS II (n = 596). Values are means. The homocysteine score was calculated by the linear combination of the homocysteine determinants weighted by the β coefficient between each determinant and plasma homocysteine in Table 3. HCY, homocysteine; NHS, Nurses’ Health Study.
Of note, one rationale for our study was to create a score that captures a larger variation of plasma homocysteine than the single determinants that influence homocysteine metabolism. The homocysteine score had a modestly higher correlation with plasma homocysteine than with alcohol, folate, and B vitamin intake (Table 4). Stratifying the population by multivitamin use produced similar results (Supplemental Table 3). The correlation of plasma homocysteine with homocysteine score was higher than the correlation with the composite of alcohol and folate intake (Pearson correlation coefficient r = 0.24; P < 0.001).
Because examining the differences in risk of disease by comparing the extreme categories of exposure is of interest in epidemiologic studies, we cross-classified the population with quintiles of plasma homocysteine and the homocysteine score in the testing set and evaluated the degree of misclassification associated with the use of the homocysteine score (Table 5). Within the lowest quintile of plasma homocysteine, 63% of the population was categorized into either the first or second quintile of the homocysteine score. Similarly, 59% of the population within the highest quintile of plasma homocysteine was categorized into either the fourth or fifth quintile of the homocysteine score. Extreme misclassification from the first quintile of plasma concentration into the fifth quintile of the homocysteine score was 8%. Similarly, misclassification from the fifth quintile of plasma homocysteine into the first quintile of the homocysteine score was 12%; the corresponding misclassification rates were higher if alcohol, folate, betaine/choline, methionine, and B vitamin intake were used instead of the homocysteine score.
TABLE 5.
Cross-classification of quintiles of homocysteine score or individual one-carbon metabolism–related nutrients with the actual plasma homocysteine concentration in men and women from the testing set (n = 404)1
| Lowest quintile of plasma homocysteine |
Highest quintile of plasma homocysteine |
|||||
| Lowest quintile | Second-lowest quintile | Highest quintile | Highest quintile | Second-highest quintile | Lowest quintile | |
| Homocysteine score | 34 | 29 | 8 | 36 | 23 | 12 |
| Alcohol intake | 48 | 3 | 13 | 23 | 17 | 33 |
| Dietary folate intake2 | 15 | 18 | 33 | 10 | 16 | 33 |
| Supplementary folate intake2 | 19 | 26 | 18 | 19 | 21 | 27 |
| Total riboflavin intake2 | 10 | 13 | 33 | 9 | 16 | 26 |
| Total pyridoxin intake2 | 13 | 11 | 28 | 9 | 14 | 32 |
| Total cyanocobalamin intake2 | 13 | 16 | 30 | 9 | 14 | 37 |
| Betaine/choline intake2 | 11 | 18 | 18 | 12 | 14 | 27 |
| Methionine intake2 | 19 | 21 | 15 | 14 | 20 | 20 |
Values are percentages. Fasting plasma homocysteine concentrations were ln-transformed, corrected for batch variation, and adjusted for age, gender, and total calorie intake by the residual method.
Nutrient values are energy-adjusted intake.
Discussion
In this study, we derived an homocysteine score that was a linear combination of the values for smoking status, multivitamin use, and caffeine, alcohol, dietary folate, and supplementary folate intake weighted by their individual regression coefficients from a multivariable model that included plasma homocysteine as dependent variable. The homocysteine score was modestly positively associated with the plasma homocysteine concentration. The degree of misclassification in ranking subjects by homocysteine concentration was <12%. Although direct blood measurement of homocysteine is preferred, our results may provide support for the potential utility of homocysteine score to represent one-carbon metabolism in large epidemiologic studies when actual homocysteine concentrations are not available.
Homocysteine is a key intermediate of one-carbon metabolism. We intended to develop an homocysteine score that predicts plasma homocysteine concentrations better than individual dietary or lifestyle factors and found that the homocysteine score performed better than individual dietary determinants of homocysteine. The homocysteine score included the 7 well-known lifestyle determinants of plasma homocysteine. The significant positive association between plasma homocysteine and smoking and caffeine intake in this study was also found in previous studies of other populations (30–33, 42). The observed significant inverse association between multivitamin use and dietary and supplementary folate intake and the positive association between alcohol and plasma homocysteine were expected (7, 8, 31, 32, 34, 42–44). The metabolic pathway of one-carbon metabolism includes 1) remethylation of homocysteine to methionine, whose pathway transfers the methyl groups either from 5-methyltetrahydratefolate (a substrate form of folate) using cyanocobalamin as a cofactor or from betaine oxidized from choline, and 2) irreversible degradation to cysteine in which pyridoxine serves as a cofactor (1, 2). Inhibition of intestinal absorption of folate by alcohol consumption (45) may significantly alter homocysteine concentration. However, riboflavin, pyridoxin, and cyanocobalamin, methionine, and betaine/choline intake was not included in the homocysteine score derivation because the independent effects of these determinants were not observed in the multivariate model. Multivitamin use was the major source of these nutrients. Incorporating the nonsignificant potential determinants into the homocysteine score did not improve the validity substantially; our homocysteine score may be parsimonious without losing predictive ability.
Several properties of the homocysteine score make it a practical research tool that can be applicable in one-carbon metabolism research. First, the homocysteine score captured an important increase in plasma homocysteine that was explainable by known lifestyle factors. The 1.50 μmol/L difference in the plasma homocysteine concentration between the extreme quartiles of the homocysteine score is a large contrast, which corresponds to an increase of ∼10% in plasma concentration that is associated with a 10–15% increase in disease risk (46). Thus, we may estimate the difference in disease risk with the homocysteine concentration by comparing the population between extreme categories of the homocysteine score. Second, the homocysteine score relies on information that is obtainable from questionnaires, without requiring elaborate blood collection and laboratory testing. With limited research sources, the homocysteine score may be the only feasible and economical measure for increasing the sample size in epidemiologic studies. Third, the homocysteine score is likely to be a more stable measure of the usual homocysteine concentration. The homocysteine score is likely to be less sensitive to transient exposure because the components of the homocysteine score include relatively stable lifestyle factors such as usual dietary intake. Moreover, with repeated measurement of the components of the homocysteine score, we can derive an homocysteine score at each follow-up period and average the score to estimate the long-term homocysteine concentration in studies with repeated lifestyle factors collected.
From a scientific standpoint, we can use the homocysteine score to conduct studies that were not feasible in the past. For example, in a real research setting, only a limited study population, usually a subpopulation of the entire cohort study, has information on plasma homocysteine concentrations or other surrogate markers of one-carbon metabolism such as methylation status. We may apply the homocysteine score to examine differential etiologic pathways for each molecular subclass of disease with improved statistical power (47). In addition, by calculating an homocysteine score repeatedly in a large population over a long follow-up period, we may test the effect modification of the homocysteine score by other lifestyle factors in relation to the risk of disease by comparing populations with a high-risk profile to those at low risk with a different follow-up time. Previous findings that homocysteine-decreasing interventions with B vitamins had no benefit for cardiovascular disease, cancer, and all-cause mortality (48–51) might be a result of the short median follow-up of <5 y (48–51), the potential of insufficient decrease in homocysteine concentrations (51), and the introduction of mandatory folic acid fortification (52). Finally, we may use the homocysteine score to test whether homocysteine is either a pathogenic product or an indirect marker of disease. The negative results of intervention trials raised questions as to whether elevated homocysteine concentrations reflect only unhealthy lifestyles correlated with homocysteine concentrations or an intracellular disturbance in one-carbon metabolism (53). In future studies, building a statistical model that includes the plasma homocysteine and the homocysteine score with the disease of interest as an outcome may clarify the role of homocysteine; if homocysteine is a causal factor, plasma homocysteine should be associated with the disease, regardless of whether the homocysteine score is included in the model.
However, our homocysteine score has several limitations. First, we observed a large unexplained variation in the plasma homocysteine concentration. The variations in genes involved in homocysteine metabolism, such as methylenetetrahydrofolate reductase (MTHFR) polymorphisms (25, 54), may change homocysteine concentrations but were not taken into account in creating the score. We had MTHFR information only within a subset of our study population. Genetic variations may lessen the precision but are not likely to induce systematic bias because genetic variation is not likely to be associated with lifestyle or dietary patterns. Furthermore, the proportion of homocysteine variation accounted for by MTHFR variants was only 2.6% of the observed variance (55). Second, our score also did not include clinical and physiologic factors such as renal function. However, the primary aim of this study was to create a simple alternative method of ranking the population according to the homocysteine concentration without elaborate testing, neither predicting the absolute value of homocysteine concentration nor discovering novel predictors of homocysteine; we observed that the plasma homocysteine concentration increased as the homocysteine score increased. Further, homocysteine scores without strong risk factors such as age fit epidemiologic research purposes better because the risk factors can be adjusted more finely when they are added separately to the statistical model rather than being included in the score.
Other potential limitations warrant further discussion. A single measurement of plasma homocysteine might be subject to a random measurement error that attenuates the precision when a prediction model is built; the corrected correlation between the homocysteine score and plasma homocysteine was 0.35 when we used the intraclass classification information that was available in women. Although a single measurement of plasma homocysteine may not precisely represent the long-term homocysteine concentration, the intraclass classification over 2–3 y was 0.53, which reasonably supports the reproducibility of plasma homocysteine over a few years. Notably, we used blood samples collected before the folate fortification era. However, because a large proportion of our population was well nourished with folate because of the prevalent use of multivitamins, our score would be generalizable to most populations in the postfortification era. Our external validation study among NHS II participants with blood samples collected largely in the postfortification era further supports the generalizability of our score. In addition, our ability to apply the empirical prediction equation to the full cohort using the data collected longitudinally may let us calculate homocysteine scores for each specific follow-up period. The mean homocysteine score over time may well represent long-term homocysteine concentrations (56).
To avoid the influence of preclinical disease in our study, we restricted our analyses to the controls only. Our score may be confounded by its individual components; nevertheless, the interplay of the factors that affect metabolism is likely to be interactive or synergistic (1). Researchers may adjust each component, such as smoking and multivitamin use, simultaneously with the homocysteine score to address this question. The population in this study consisted mostly of white health professionals; direct application of our score to other populations may require caution (57). Nonetheless, homocysteine score is based on well-established biologic or behavioral factors of homocysteine concentration in the general population, whose associations of homocysteine components with homocysteine concentration are dependent on one-carbon metabolism; positive associations between our homocysteine score and homocysteine concentration in both the testing set and the NHS II support the potential application of the homocysteine score to the general population. Although ∼80% of our study population was female, gender was taken into account when we developed the homocysteine score, and ranking ability of homocysteine score by homocysteine concentration did not materially differ by gender. Finally, the data collected via self-report may have introduced random errors that attenuated the association between each determinant and plasma homocysteine. However, our study population consisted of health professionals known for their high accuracy in reporting data; the correlation coefficient of self-reported lifestyle information with that measured by reference approaches was high in previous validation substudies (58, 59).
In summary, we derived an homocysteine score in a large population with detailed information on diet and other lifestyle factors and validated the score in an independent population. Although the homocysteine score only modestly predicted the plasma homocysteine concentration, the score could still rank populations by homocysteine concentration better than individual nutrients such as folate and alcohol. When we are challenged by limited resources to measure plasma homocysteine in a research setting, use of the homocysteine score as a simple and economical ranking instrument could be considered. Further research is warranted to evaluate our homocysteine score in other populations and with disease outcomes.
Supplementary Material
Acknowledgments
EC conceived of and designed the research; ELG, BR, and SO oversaw the implementation and analytic strategy of the study. SJ analyzed the data with statistical support from YJ and wrote the paper. EC had primary responsibility for the final content. All authors read and approved the final manuscript.
Footnotes
Abbreviations used: HPFS, Health Professionals Follow-Up Study; MTHFR, methylenetetrahydrofolate reductase; NHS, Nurses’ Health Study.
References
- 1.Anderson OS, Sant KE, Dolinoy DC. Nutrition and epigenetics: an interplay of dietary methyl donors, one-carbon metabolism and DNA methylation. J Nutr Biochem 2012;23(8):853–9. [DOI] [PMC free article] [PubMed] [Google Scholar]
- 2.King WD, Ho V, Dodds L, Perkins SL, Casson RI, Massey TE. Relationships among biomarkers of one-carbon metabolism. Mol Biol Rep 2012;39(7):7805–12. [DOI] [PubMed] [Google Scholar]
- 3.Choi JD, Lee JS. Interplay between Epigenetics and Genetics in Cancer. Genomics & informatics 2013;4:164–73. [DOI] [PMC free article] [PubMed]
- 4.Miller JW, Beresford SA, Neuhouser ML, Cheng TY, Song X, Brown EC, Zheng Y, Rodriguez B, Green R, Ulrich CM. Homocysteine, cysteine, and risk of incident colorectal cancer in the Women's Health Initiative observational cohort. The American journal of clinical nutrition 2013. Available from: http://ajcn.nutrition.org/content/early/2013/02/18/ajcn.112.049932.full.pdf. [DOI] [PMC free article] [PubMed]
- 5.Kweon SS, Shu XO, Xiang Y, Yang G, Ji BT, Li H, Gao YT, Zheng W, Shrubsole MJ. One-carbon metabolism dietary factors and distal gastric cancer risk in Chinese women. Cancer epidemiology, biomarkers & prevention: a publication of the American Association for Cancer Research, cosponsored by the American Society of Preventive Oncology 2014. [DOI] [PMC free article] [PubMed]
- 6.Naushad SM, Pavani A, Rupasree Y, Divyya S, Deepti S, Digumarti RR, Gottumukkala SR, Prayaga A, Kutala VK. Association of aberrations in one-carbon metabolism with molecular phenotype and grade of breast cancer. Mol Carcinog 2012;51 Suppl 1:E32–41. [DOI] [PubMed] [Google Scholar]
- 7.Blom HJ, Smulders Y. Overview of homocysteine and folate metabolism. With special references to cardiovascular disease and neural tube defects. J Inherit Metab Dis 2011;34(1):75–81. [DOI] [PMC free article] [PubMed] [Google Scholar]
- 8.Kalhan SC, Marczewski SE. Methionine, homocysteine, one carbon metabolism and fetal growth. Rev Endocr Metab Disord 2012;13(2):109–19 Available from: http://download.springer.com/static/pdf/677/art%253A10.1007%252Fs11154–012–9215–7.pdf?auth66=1362685887_fb5e599892ab06c2e6a3dd8444e239ed&ext=.pdf. [DOI] [PubMed] [Google Scholar]
- 9.Lippi G, Plebani M. Hyperhomocysteinemia in health and disease: where we are now, and where do we go from here? Clinical chemistry and laboratory medicine: CCLM / FESCC 2012. Available from: http://www.degruyter.com/dg/viewarticle.fullcontentlink:pdfeventlink/$002fj$002fcclm.2012.50.issue-12$002fcclm-2012–0372$002fcclm-2012–0372.xml?t:ac=j$002fcclm.2012.50.issue-12$002fcclm-2012–0372$002fcclm-2012–0372.xml. [DOI] [PubMed]
- 10.Ganji V, Kafai MR. Demographic, lifestyle, and health characteristics and serum B vitamin status are determinants of plasma total homocysteine concentration in the post-folic acid fortification period, 1999–2004. J Nutr 2009;139(2):345–52. [DOI] [PubMed] [Google Scholar]
- 11. Stevens VL, McCullough ML, Sun J, Gapstur SM. Folate and other one-carbon metabolism-related nutrients and risk of postmenopausal breast cancer in the Cancer Prevention Study II Nutrition Cohort. Am J Clin Nutr 2010;6:1708–15. Available from: http://www.ajcn.org/content/91/6/1708.full.pdf. [DOI] [PubMed]
- 12.Cho E, Giovannucci EL, Joh HK. Nutrients related to one-carbon metabolism and risk of renal cell cancer. Cancer causes & control: CCC 2013;2:373–82. Available from: http://link.springer.com/content/pdf/10.1007%2Fs10552–012–0123–7. [DOI] [PMC free article] [PubMed]
- 13.Zschäbitz S, Cheng TY, Neuhouser ML, Zheng Y, Ray RM, Miller JW, Song X, Maneval DR, Beresford SA, Lane D, et al. B vitamin intakes and incidence of colorectal cancer: results from the Women's Health Initiative Observational Study cohort. Am J Clin Nutr 2013;97(2):332–43. [DOI] [PMC free article] [PubMed] [Google Scholar]
- 14.Refsum H, Smith AD, Ueland PM, Nexo E, Clarke R, McPartlin J, Johnston C, Engbaek F, Schneede J, McPartlin C, et al. Facts and recommendations about total homocysteine determinations: an expert opinion. Clin Chem 2004;50(1):3–32. [DOI] [PubMed] [Google Scholar]
- 15.Hankinson SE, Willett WC, Manson JE, Colditz GA, Hunter DJ, Spiegelman D, Barbieri RL, Speizer FE. Plasma sex steroid hormone levels and risk of breast cancer in postmenopausal women. J Natl Cancer Inst 1998;90(17):1292–9 Available from: http://jnci.oxfordjournals.org/content/90/17/1292.full.pdf. [DOI] [PubMed] [Google Scholar]
- 16.Verhoef P, Rimm EB, Hunter DJ, Chen J, Willett WC, Kelsey K, Stampfer MJ. A common mutation in the methylenetetrahydrofolate reductase gene and risk of coronary heart disease: results among U.S. men. J Am Coll Cardiol 1998;32(2):353–9. [DOI] [PubMed] [Google Scholar]
- 17.Tworoger SS, Sluss P, Hankinson SE. Association between plasma prolactin concentrations and risk of breast cancer among predominately premenopausal women. Cancer Res 2006;66(4):2476–82. [DOI] [PubMed] [Google Scholar]
- 18.Nurk E, Tell GS, Nygard O, Refsum H, Ueland PM, Vollset SE. Plasma total homocysteine is influenced by prandial status in humans: the Hordaland Hhomocysteine Sstudy. J Nutr 2001;131(4):1214–6. [DOI] [PubMed] [Google Scholar]
- 19.Rosner B. Percentage points for a generalized ESD many-outlier procedure. Technometrics 1983;25:165–72. [Google Scholar]
- 20.Araki A, Sako Y. Determination of free and total homocysteine in human plasma by high-performance liquid chromatography with fluorescence detection. J Chromatogr 1987;422:43–52. [DOI] [PubMed] [Google Scholar]
- 21.Schernhammer E, Wolpin B, Rifai N, Cochrane B, Manson JA, Ma J, Giovannucci E, Thomson C, Stampfer MJ, Fuchs C. Plasma folate, vitamin B6, vitamin B12, and homocysteine and pancreatic cancer risk in four large cohorts. Cancer Res 2007;67(11):5553–60 Available from: http://cancerres.aacrjournals.org/content/67/11/5553.full.pdf. [DOI] [PubMed] [Google Scholar]
- 22.Brunelli T, Pepe G, Marcucci R, Giusti B, Prisco D, Abbate R, Fedi S. Comparison of three methods for total homocysteine plasma determination. Clin Lab 2001;47(7–8):393–7. [PubMed] [Google Scholar]
- 23.Rosner B, Cook N, Portman R, Daniels S, Falkner B. Determination of blood pressure percentiles in normal-weight children: some methodological issues. Am J Epidemiol 2008;167(6):653–66 Available from: http://aje.oxfordjournals.org/content/167/6/653.full.pdf. [DOI] [PubMed] [Google Scholar]
- 24.Konstantinova SV, Vollset SE, Berstad P, Ueland PM, Drevon CA, Refsum H, Tell GS. Dietary predictors of plasma total homocysteine in the Hordaland Homocysteine Study. Br J Nutr 2007;98(1):201–10. [DOI] [PubMed] [Google Scholar]
- 25.Bathum L, Petersen I, Christiansen L, Konieczna A, Sorensen TI, Kyvik KO. Genetic and environmental influences on plasma homocysteine: results from a Danish twin study. Clin Chem 2007;53(5):971–9. [DOI] [PubMed] [Google Scholar]
- 26.Refsum H, Nurk E, Smith AD, Ueland PM, Gjesdal CG, Bjelland I, Tverdal A, Tell GS, Nygard O, Vollset SE. The Hordaland Homocysteine Study: a community-based study of homocysteine, its determinants, and associations with disease. J Nutr 2006;136(6): Suppl:1731S–40S. [DOI] [PubMed] [Google Scholar]
- 27.Cho E, Zeisel SH, Jacques P, Selhub J, Dougherty L, Colditz GA, Willett WC. Dietary choline and betaine assessed by food-frequency questionnaire in relation to plasma total homocysteine concentration in the Framingham Offspring Study. Am J Clin Nutr 2006;83(4):905–11. [DOI] [PMC free article] [PubMed] [Google Scholar]
- 28.Panagiotakos DB, Pitsavos C, Zeimbekis A, Chrysohoou C, Stefanadis C. The association between lifestyle-related factors and plasma homocysteine levels in healthy individuals from the "ATTICA" Study. Int J Cardiol 2005;98(3):471–7. [DOI] [PubMed] [Google Scholar]
- 29.Ganji V, Kafai MR. Frequent consumption of milk, yogurt, cold breakfast cereals, peppers, and cruciferous vegetables and intakes of dietary folate and riboflavin but not vitamins B-12 and B-6 are inversely associated with serum total homocysteine concentrations in the US population. Am J Clin Nutr 2004;80(6):1500–7. [DOI] [PubMed] [Google Scholar]
- 30. Chrysohoou C, Panagiotakos DB, Pitsavos C, Zeimbekis A, Zampelas A, Papademetriou L, Masoura C, Stefanadis C. The associations between smoking, physical activity, dietary habits and plasma homocysteine levels in cardiovascular disease-free people: the 'ATTICA' study. Vascular medicine (London, England) 2004;2:117–23. [DOI] [PubMed]
- 31.Jacques PF, Bostom AG, Wilson PW, Rich S, Rosenberg IH, Selhub J. Determinants of plasma total homocysteine concentration in the Framingham Offspring cohort. Am J Clin Nutr 2001;73(3):613–21 Available from: http://ajcn.nutrition.org/content/73/3/613.full.pdf. [DOI] [PubMed] [Google Scholar]
- 32.Rasmussen LB, Ovesen L, Bulow I, Knudsen N, Laurberg P, Perrild H. Folate intake, lifestyle factors, and homocysteine concentrations in younger and older women. Am J Clin Nutr 2000;72(5):1156–63. [DOI] [PubMed] [Google Scholar]
- 33.Nygård O, Refsum H, Ueland PM, Vollset SE. Major lifestyle determinants of plasma total homocysteine distribution: the Hordaland Homocysteine Study. Am J Clin Nutr 1998;67(2):263–70. [DOI] [PubMed] [Google Scholar]
- 34.Selhub J, Jacques PF, Wilson PW, Rush D, Rosenberg IH. Vitamin status and intake as primary determinants of homocysteinemia in an elderly population. JAMA 1993;270(22):2693–8. [DOI] [PubMed] [Google Scholar]
- 35. Willett WC, Howe GR, Kushi LH. Adjustment for total energy intake in epidemiologic studies. The American journal of clinical nutrition 1997;4 Suppl:1220S–8S; discussion 9S–31S. [DOI] [PubMed]
- 36.Willett WC, Sampson L, Stampfer MJ, Rosner B, Bain C, Witschi J, Hennekens CH, Speizer FE. Reproducibility and validity of a semiquantitative food frequency questionnaire. Am J Epidemiol 1985;122(1):51–65. [DOI] [PubMed] [Google Scholar]
- 37.Rimm EB, Giovannucci EL, Stampfer MJ, Colditz GA, Litin LB, Willett WC. Reproducibility and validity of an expanded self-administered semiquantitative food frequency questionnaire among male health professionals. Am J Epidemiol 1992;135(10):1114–26,discussion 27–36. [DOI] [PubMed] [Google Scholar]
- 38.Giovannucci E, Stampfer MJ, Colditz GA, Rimm EB, Trichopoulos D, Rosner BA, Speizer FE, Willett WC. Folate, methionine, and alcohol intake and risk of colorectal adenoma. J Natl Cancer Inst 1993;85(11):875–84. [DOI] [PubMed] [Google Scholar]
- 39.Chiuve SE, Giovannucci EL, Hankinson SE, Zeisel SH, Dougherty LW, Willett WC, Rimm EB. The association between betaine and choline intakes and the plasma concentrations of homocysteine in women. Am J Clin Nutr 2007;86(4):1073–81. [DOI] [PMC free article] [PubMed] [Google Scholar]
- 40.Salvini S, Hunter DJ, Sampson L, Stampfer MJ, Colditz GA, Rosner B, Willett WC. Food-based validation of a dietary questionnaire: the effects of week-to-week variation in food consumption. Int J Epidemiol 1989;18(4):858–67. [DOI] [PubMed] [Google Scholar]
- 41.Feskanich D, Rimm EB, Giovannucci EL, Colditz GA, Stampfer MJ, Litin LB, Willett WC. Reproducibility and validity of food intake measurements from a semiquantitative food frequency questionnaire. J Am Diet Assoc 1993;93(7):790–6. [DOI] [PubMed] [Google Scholar]
- 42.Ganji V, Kafai MR. Demographic, health, lifestyle, and blood vitamin determinants of serum total homocysteine concentrations in the third National Health and Nutrition Examination Survey, 1988–1994. Am J Clin Nutr 2003;77(4):826–33. [DOI] [PubMed] [Google Scholar]
- 43.Nurk E, Tell GS, Vollset SE, Nygard O, Refsum H, Nilsen RM, Ueland PM. Changes in lifestyle and plasma total homocysteine: the Hordaland Homocysteine Study. Am J Clin Nutr 2004;79(5):812–9. [DOI] [PubMed] [Google Scholar]
- 44.Koehler KM, Baumgartner RN, Garry PJ, Allen RH, Stabler SP, Rimm EB. Association of folate intake and serum homocysteine in elderly persons according to vitamin supplementation and alcohol use. Am J Clin Nutr 2001;73(3):628–37. [DOI] [PubMed] [Google Scholar]
- 45.Halsted CH, Villanueva JA, Devlin AM, Chandler CJ. Metabolic interactions of alcohol and folate. J Nutr 2002;132(8): Suppl:2367S–72S. [DOI] [PubMed] [Google Scholar]
- 46.Boushey CJ, Beresford SA, Omenn GS, Motulsky AG. A quantitative assessment of plasma homocysteine as a risk factor for vascular disease. Probable benefits of increasing folic acid intakes. JAMA 1995;274(13):1049–57. [DOI] [PubMed] [Google Scholar]
- 47. Liao X, Morikawa T, Lochhead P, Imamura Y, Kuchiba A, Yamauchi M, Nosho K, Qian ZR, Nishihara R, Meyerhardt JA, et al. Prognostic role of PIK3CA mutation in colorectal cancer: cohort study and literature review. Clinical cancer research: an official journal of the American Association for Cancer Research 2012;18:2257–68. Available from: http://clincancerres.aacrjournals.org/content/18/8/2257.full.pdf. [DOI] [PMC free article] [PubMed]
- 48.Marti-Carvajal AJ, Sola I, Lathyris D, Karakitsiou DE, Simancas-Racines D. Homocysteine-lowering interventions for preventing cardiovascular events. Cochrane database of systematic reviews (Online). 2013:CD006612. Available from: http://onlinelibrary.wiley.com/doi/10.1002/14651858.CD006612.pub3/abstract. [DOI] [PubMed]
- 49.Marti-Carvajal AJ, Sola I, Lathyris D, Salanti G. Homocysteine lowering interventions for preventing cardiovascular events. Cochrane database of systematic reviews (Online). 2009;4:CD006612. Available from: http://onlinelibrary.wiley.com/doi/10.1002/14651858.CD006612.pub2/abstract. [DOI] [PMC free article] [PubMed]
- 50.Clarke R, Halsey J, Lewington S, Lonn E, Armitage J, Manson JE, Bonaa KH, Spence JD, Nygard O, Jamison R, et al. Effects of lowering homocysteine levels with B vitamins on cardiovascular disease, cancer, and cause-specific mortality: Meta-analysis of 8 randomized trials involving 37 485 individuals. Arch Intern Med 2010;170(18):1622–31 Available from: http://archinte.jamanetwork.com/data/Journals/InteMed/5782/ira05006_1622_1631.pdf. [DOI] [PubMed] [Google Scholar]
- 51.Zhou YH, Tang JY, Wu MJ, Lu J, Wei X, Qin YY, Wang C, Xu JF, He J. Effect of folic acid supplementation on cardiovascular outcomes: a systematic review and meta-analysis. PLoS ONE 2011;6(9):e25142. [DOI] [PMC free article] [PubMed] [Google Scholar]
- 52.Ueland PM, Clarke R. Homocysteine and cardiovascular risk: considering the evidence in the context of study design, folate fortification, and statistical power. Clin Chem 2007;53(5):807–9. [DOI] [PubMed] [Google Scholar]
- 53.Smulders YM, Blom HJ. The homocysteine controversy. J Inherit Metab Dis 2011;34(1):93–9. [DOI] [PMC free article] [PubMed] [Google Scholar]
- 54.Hazra A, Kraft P, Lazarus R, Chen C, Chanock SJ, Jacques P, Selhub J, Hunter DJ. Genome-wide significant predictors of metabolites in the one-carbon metabolism pathway. Hum Mol Genet 2009;18(23):4677–87. [DOI] [PMC free article] [PubMed] [Google Scholar]
- 55.Paré G, Chasman DI, Parker AN, Zee RR, Malarstig A, Seedorf U, Collins R, Watkins H, Hamsten A, Miletich JP, et al. Novel associations of CPS1, MUT, NOX4, and DPEP1 with plasma homocysteine in a healthy population: a genome-wide evaluation of 13 974 participants in the Women's Genome Health Study. Circ Cardiovasc Genet 2009;2:142–50. [DOI] [PMC free article] [PubMed] [Google Scholar]
- 56.Joh HK, Giovannucci EL, Bertrand KA, Lim S, Cho E. Predicted plasma 25-hydroxyvitamin D and risk of renal cell cancer. J Natl Cancer Inst 2013;105(10):726–32. [DOI] [PMC free article] [PubMed] [Google Scholar]
- 57.Summers CM, Mitchell LE, Stanislawska-Sachadyn A, Baido SF, Blair IA, Von Feldt JM, Whitehead AS. Genetic and lifestyle variables associated with homocysteine concentrations and the distribution of folate derivatives in healthy premenopausal women. Birth Defects Res A Clin Mol Teratol 2010;88(8):679–88. [DOI] [PMC free article] [PubMed] [Google Scholar]
- 58.Wolf AM, Hunter DJ, Colditz GA, Manson JE, Stampfer MJ, Corsano KA, Rosner B, Kriska A, Willett WC. Reproducibility and validity of a self-administered physical activity questionnaire. Int J Epidemiol 1994;23(5):991–9. [DOI] [PubMed] [Google Scholar]
- 59.Rimm EB, Stampfer MJ, Colditz GA, Chute CG, Litin LB, Willett WC. Validity of self-reported waist and hip circumferences in men and women. Epidemiology 1990;1(6):466–73. [DOI] [PubMed] [Google Scholar]
Associated Data
This section collects any data citations, data availability statements, or supplementary materials included in this article.