

Abstract
Objective
Brite adipocytes are inducible energy-dissipating cells expressing UCP1 which appear within white adipose tissue of healthy adult individuals. Recruitment of these cells represents a potential strategy to fight obesity and associated diseases.
Methods/Results
Using human Multipotent Adipose-Derived Stem cells, able to convert into brite adipocytes, we show that arachidonic acid strongly inhibits brite adipocyte formation via a cyclooxygenase pathway leading to secretion of PGE2 and PGF2α. Both prostaglandins induce an oscillatory Ca++ signaling coupled to ERK pathway and trigger a decrease in UCP1 expression and in oxygen consumption without altering mitochondriogenesis. In mice fed a standard diet supplemented with ω6 arachidonic acid, PGF2α and PGE2 amounts are increased in subcutaneous white adipose tissue and associated with a decrease in the recruitment of brite adipocytes.
Conclusion
Our results suggest that dietary excess of ω6 polyunsaturated fatty acids present in Western diets, may also favor obesity by preventing the “browning” process to take place.
Keywords: Polyunsaturated fatty acids, PGE2, PGF2α, PGI2, Calcium oscillation, UCP1
1. Introduction
Both overweight and obesity result from an imbalance between energy intake and energy expenditure. So far, regulation of energy intake by dietary and pharmacological treatments has met limited success. In the last few years, the characterization of functional brown adipose tissue (BAT) in adult humans has opened new perspectives for regulating energy expenditure. In contrast to white adipose tissue (WAT) involved in energy storage, BAT is endowed with a thermogenic activity and regulates body temperature by dissipating energy through heat production [1]. This process of non-shivering thermogenesis is due to the occurrence of the Uncoupling Protein 1 (UCP1) localized in BAT mitochondria and is induced in rodents in response to cold via β-adrenergic stimulation. The energy-dissipating properties of UCP1 lead to an increased oxidation of fatty acids and are important for body weight regulation [2]. Interestingly, another population of thermogenic adipocytes is present in rodent WAT and termed brite for “brown in white” or beige adipocytes [3,4]. These brown-like adipocytes appear in response to cold exposure or high-fat diets and stem either from progenitors or by direct conversion of mature white adipocytes [5–7], and have been recently found in adult humans [8–12]. Induction of their activity appears as an interesting strategy to fight obesity by enhancing body energy expenditure as increased oxidation of fatty acids within these cells limits their release into the general circulation. We isolated human Multipotent Adipose-Derived Stem (hMADS) cells as the first model of cells undergoing the conversion from white to brite functional phenotype [13,14]. This cell model appears suitable for studies aimed at delineating the role of key components of diets in this process, among which the possible involvement of essential ω6 polyunsaturated fatty acids (PUFAs).
Dietary fats are the source of the essential PUFAs, both ω6 linoleic acid (LA), a precursor of ω6 arachidonic acid (ARA), and ω3 α-linolenic acid, a precursor of ω3 eicosapentaenoic (EPA) and docosahexaenoic acid (DHA). These very long-chain PUFAs trigger a variety of biological responses and are required for a healthy development. Prostacyclin (PGI2) and other prostaglandins of the 2 series (PGD2, PGE2 and PGF2α) are prostanoids synthesized from ARA and are involved in the differentiation, maturation and function of white adipocytes. PGI2 triggers adipocyte differentiation in vitro [15] and in vivo [16,17], while PGF2α behaves as a strong inhibitor [18,19]. The role of PGE2 is more controversial, as it has been described to inhibit or to promote adipogenesis [20,21], and is likely due to the diversity of its receptors able to modulate differently both Ca++ and cAMP-dependent pathways [22].
During the last decade, dietary recommendations have taken into account the insufficient intake of ω3 PUFAs and the excess of ω6 PUFAs which is correlated with overweight/obesity [23,24]. Interestingly, high ω6/ω3 ratios are positively associated with adiposity of infants at 3 and 4 years of age [25,26]. ARA levels correlate positively with body mass index (BMI) and the associated metabolic syndrome [27–30]. Diets with higher ω6/ω3 ratio result in higher arachidonic acid and lower EPA + DHA levels in plasma and adipose tissue and enhance ARA availability to synthesize PGs of the 2 series in adipose tissue.
Since brite/brown adipocytes appear absent from obese patients [8], we therefore sought to analyze the possible role of ω6 ARA and its metabolites in human brown/brite adipocyte development and functions. Herein, we show a potent inhibitory effect of ARA on white to brown adipocyte conversion of hMADS cells. ARA inhibits the expression of UCP1 and leads to a decrease in the thermogenic capacity of hMADS adipocytes characterized by a lower mitochondrial activity and basal oxygen consumption. The effect of ARA is mediated via cyclooxygenase activities leading to increased synthesis and release of PGE2 and PGF2α. Thorough analysis of the role of PGE2 and PGF2α demonstrate that the ARA/prostaglandin/calcium pathway is responsible of impairing the browning process. Finally, we show that supplementing mice with an ARA-enriched diet leads to increased synthesis of both prostaglandins while lowering the occurrence of inducible brite adipocytes upon stimulation of the recruitment by β3-adrenergic receptor agonist.
2. Materials and methods
2.1. Animals
The experiments were conducted in accordance with the French and European regulations (directive 2010/63/EU) for the care and use of research animals and were approved by local experimentation committees (Nice University and Ciepal Azur: protocol NCE-2012-57). Ten-week-old C57Bl/6JRccHsd female mice were from Harlan and maintained at constant temperature (21 ± 2 °C) and 12:12-hour light–dark cycles, with ad libitum access to diet and water. Mice were fed for 4 weeks with ARA- or oleic acid (OA)-supplemented diet. Chronic β-adrenergic receptor stimulation was carried the last week of the diet by daily intra-peritoneal injections of CL316,243 (1 mg/kg/day in saline solution). Control mice were injected with vehicle only. Standard chow diets (ref. 2016, Harlan Lab., WI, USA) were enriched with 11 g/Kg of oleate–ethyl–ester or arachidonate–ethyl–ester (Harlan Lab., WI, USA, Nu-Chek-Prep, MIN, US) and 5 g/Kg of Safflower Oil to favor dispersion of ethyl esters in the diet. Blood, interscapular BAT (iBAT) and inguinal subcutaneous WAT (scWAT) were sampled and used for different analysis. Histology, protein and RNA extracts as well as further analysis are described in Supplemental procedures.
2.2. hMADS cell culture
The establishment and characterization of hMADS cells have been described in Refs. [13,31–33]. In the experiments reported herein hMADS-3 cells were used and came originally from the prepubic fat pad of a 4-month-old male. Cells were used between passages 14 and 25, and all experiments have been performed at least 3 times using different cultures. Cells were seeded at a density of 5000 cells/cm2 in Dulbecco's modified Eagle's medium (DMEM) supplemented with 10% FBS, 15 mM Hepes, 2.5 ng/ml hFGF2, 60 μg/ml penicillin, and 50 μg/ml streptomycin. hFGF2 was removed when cells reached confluence. Cells were triggered for differentiation at day 2 post-confluence (designated as day 0) in DMEM/Ham's F12 media supplemented with 10 μg/ml transferrin, 10 nM insulin, 0.2 nM triiodothyronine, 1 μM dexamethasone and 500 μM isobutyl-methylxanthine. Three days later, the medium was changed (dexamethasone and isobutyl-methylxanthine omitted) and 100 nM rosiglitazone were added. At day 9 rosiglitazone was withdrawn to enable white adipocyte differentiation (R3–9) but again included between days 14 and 17 to promote white to brite adipocyte conversion (R3–9/14–17). Media were changed every other day and cells used at day 17. Fatty acids and prostaglandins were bound to BSA (0.04% for 15 min at 37 °C) prior to inclusion to culture media. Analysis of secreted prostanoids was performed at day 17 after incubation of the cells for 10 min in fresh culture media. PGE2, PGF2α and 6-keto-PGF1α were quantified by EIA following manufacturer's instructions (Cayman, BertinPharma, Montigny le Bretonneux, France). Glycerol-3-phosphate dehydrogenase (GPDH) activity measurements and Oil Red O staining were performed as described previously in Ref. [34]. Immunostaining, Cytochrome c oxidase activity measurements, protein and RNA extracts preparation and further analyses are described in Supplemental procedures.
2.3. Prostanoid quantification in vivo by mass spectrometry analysis
All tissues were snap-frozen with liquid nitrogen immediately after collection and stored at −80 °C until extraction. For extraction, each frozen adipose tissue was crushed with a FastPrep®-24 Instrument (MP Biomedical) in 500 μL of HBSS (Invitrogen) and 5 μL of internal standard (Deuterium labeled compounds). After 2 crush cycles (6.5 m/s, 30 s), 20 μL were withdrawn for protein quantification and 300 μL of cold methanol (MeOH) were added. After centrifugation at 900 g for 15 min at 4 °C, supernatants were transferred into 2 ml 96-well deep plates and diluted in H2O to 2 ml. Samples were then submitted to solid phase extraction (SPE) using HRX 96-well plate (50 mg/well, Macherey Nagel) pretreated with MeOH (2 ml) and equilibrated with 10% MeOH (2 ml). After sample application, extraction plate was washed with 10% MeOH (2 ml). After drying under aspiration, lipid mediators were eluted with 2 ml of MeOH. Prior to LC-MS/MS analysis, samples were evaporated under nitrogen gas and reconstituted in 10 μL of MeOH.
LC-MS/MS analyses of prostanoids were performed as previously described in Ref. [35]. Briefly, lipid mediators were separated on a ZorBAX SB-C18 column (2.1 mm, 50 mm, 1.8 μm) using Agilent 1290 Infinity HPLC system coupled to an ESI-triple quadruple G6460 mass spectrometer (Agilent Technologies). Data were acquired in Multiple Reaction Monitoring (MRM) mode with optimized conditions (ion optics and collision energy). Peak detection, integration and quantitative analysis were done using Mass Hunter Quantitative analysis software (Agilent Technologies) based on calibration lines built with commercially available prostanoid standards (Cayman Chemicals).
2.4. Measurement of oxygen consumption
Oxygen consumption was measured using polarometric technique. Briefly, differentiated cells were introduced in a closed chamber (containing 1.5–2 ml of air-saturated culture medium) and oxygen level was measured using a Clark electrode (YSI53, USA). Decrease of oxygen in the chamber was monitored as a function of time using a Powerlab 8/35 acquisition system (AD instruments, UK).
2.5. Analysis of Ca++ flux
hMADS cells were seeded in 4 well plates and differentiated until day 17 into brite adipocytes (all results presented herein were reproduced with day 14 adipocytes and day 17 white adipocytes). Cells were incubated for 20 min at 37 °C with 5 μM of the fluorescent Ca++ sensitive probe Quest Fluo-8 (Euromedex) in PBS supplemented with 2 mM CaCl2 and 0.05% BSA. Cells were finally washed in PBS containing 2 mM CaCl2 or in Ca++-free PBS and installed on the stage of an inverted microscope maintained at 37 °C and illuminated with a xenon lamp through a dichroic filter (excitation 490 nm and emission over 510 nm). Digital images were recorded every 5 s with a low light level camera (Photonic Science) and processed for grey level analysis through imaging workbench software (v2.1).
2.6. Statistical analysis
Data are expressed as mean values ± sem and are analyzed using the 2-tailed Student's t test. Differences were considered statistically significant at p ≤ 0.01.
3. Results
3.1. Differential effect of ω6 PUFAs on white and brite adipocyte differentiation
hMADS cells were differentiated after 17 days into white (rosiglitazone treatment between days 3 and 9, R3–9) or brite (rosiglitazone treatment between days 3 and 9 and then between days 14 and 17, R3–9/14–17) adipocytes according to our published protocol [13,14] and treated or not with ARA between days 14 and 17. At the end of this treatment, UCP1 mRNA and protein levels were assessed. As shown in Figure 1A, ARA strongly inhibited UCP1 mRNA expression in cells acquiring the brite phenotype. This decrease in UCP1 expression was confirmed at the protein level (Figure 1B). Of note, using the same protocol, linoleic acid did not modulate UCP1 mRNA expression (data not shown).
Figure 1.
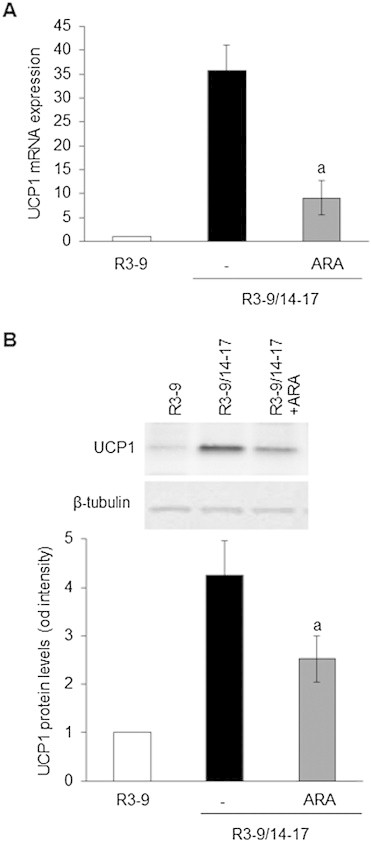
Differential effect of ARA on white to brite adipocyte conversion. hMADS cells were differentiated into white (R3–9) or brite (R3–9/14–17) adipocytes, and treated or not between days 14 and 17 with 10 μM ARA. (A) UCP1 mRNA expression determined by RT-qPCR and (B) UCP1 protein level analyzed by Western blot (whole cell lysates, 80 μg/lane). β-tubulin was used as loading control. Histograms represent mean ± SEM of 3 independent experiments. a: p < 0.01 vs R3–9/14–17.
In contrast to the effect on UCP1 gene expression, ARA treatment did not affect adipogenesis per se. Oil Red O staining, GPDH activity perilipin immunostaining and expression of various gene markers were not altered whereas a slight inhibitory effect was observed on adiponectin (ADPQ) and fatty acid binding protein 4 (FABP4) mRNA expression (Figure 2A–D). It appeared that ARA inhibits the expression of UCP1 and other PPARγ-target genes (such as ADPQ and FABP4) during brite adipocyte formation without affecting overall adipogenesis.
Figure 2.
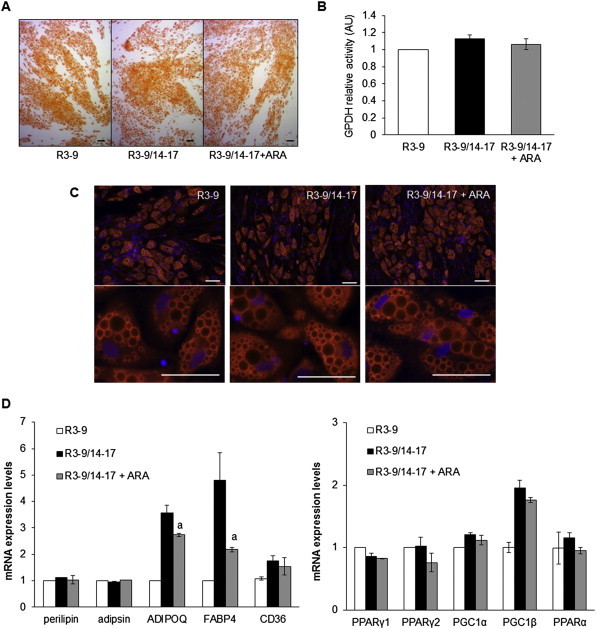
hMADS cells were maintained in the presence of 100 nM rosiglitazone from day 3 to day 9 (R3–9) or further exposed to rosiglitazone from day 14 to day 17 (R3–9/14–17) in the absence or presence of 10 μM ARA. Oil red O staining (A) and GPDH activity measurements (B) were carried out. (C) Immunodetection of perilipin (in red) was performed at day 17 and nuclei were counterstained with DAPI (in blue). (D) mRNA expression of adipogenic markers was determined by RT-qPCR. Histograms represent mean ± SEM of 3 independent experiments. a: p < 0.01 vs R3–9/14–17. Scale: 20 μm.
3.2. ARA inhibits the UCP1-associated function but not mitochondriogenesis
In order to further characterize ARA effects on the brite phenotype, we analyzed mRNA expression of several classical brite and mitochondrial markers. There was a significant decrease of FABP3 expression (a fatty acid binding protein preferentially expressed in brown adipocyte and promoted by PPARγ), a trend of non-significant decrease of CPT1-M and CIDEA expression, and no variation for PRDM16, ELOVL3, PAT2 and P2RX5 mRNA expression. Other mitochondrial markers (associated or not to the brite adipocyte phenotype) were not affected by ARA treatment (Figure 3A). TIMM23 (a specific transporter of the inner mitochondrial membrane) immunostaining showed no difference in the mitochondrial content of cells treated or not with ARA (Figure 3B) leading to similar maximal oxygen consumption (Figure 3C). ARA-induced inhibition of UCP1 was accompanied by a significant reduction in the basal oxygen consumption (Figure 3C) reflecting the reduction in UCP1 uncoupling activity. Similarly, Cytochrome c oxidase activity was significantly reduced in ARA-treated brite mitochondria (Figure 3D). Due to the reduced uncoupling activity of UCP1 in ARA-treated cells, mitochondrial complex IV activity was decreased through a regulation of Cytochrome c oxidase activity, in order to reach an oxidative phosphorylation activity equivalent to that of white adipocytes [36]. Collectively, these data demonstrate that ARA did not affect mitochondriogenesis per se whereas it inhibited mitochondrial activity associated with UCP1 expression.
Figure 3.

Changes in the brite phenotype of ARA-treated cells. hMADS cells were maintained in the presence of 100 nM rosiglitazone and treated or not from day 14 to day 17 with 10 μM ARA. Rosiglitazone-untreated cells were used as control. (A) Brown (CPT-1M and CIDEA) and mitochondrial markers (COX10, CYTC, MFN2, TOMM20 and TIMM23) mRNA expression were analyzed by RT-qPCR. (B) Mitochondria content analyzed by immunodetection of TIMM23 (red). Nuclei were counterstained with DAPI (blue). (C) Basal (untreated cells) and maximal (FCCP-treated cells) oxygen consumption levels measured in resuspended cells with an oxygraphic probe. (D) Cytochrome c oxidase activity was measured. Histograms represent mean ± SEM of 3 (A and D) or 4 (C) independent experiments. a: p < 0.01 vs R3–9/14–17. Scale: 20 μm.
3.3. ARA inhibitory effect is mediated through cyclooxygenase activity
As early steps of ARA metabolism are mediated through cyclooxygenase activity, we analyzed involvement of cyclooxygenase 1 (COX-1) and 2 (COX-2). As shown in Figure 4A, COX-1 and COX- 2 mRNA are expressed in hMADS adipocytes and their expression increased upon ARA treatment with a stronger effect on COX-2 mRNA. In order to determine whether COX activities were involved in the effects of ARA on brite adipocyte differentiation, indomethacin, a non-selective COX inhibitor, and celecoxib, a specific COX-2 inhibitor, were used. Clearly, both inhibitors were able to reverse the ARA inhibitory effect on UCP1 mRNA expression (Figure 4B) as well as that on FABP4 and ADPQ mRNA expression (Figure 4C). Of note, COX-2 mRNA expression was also regulated by COX inhibitors (Figure 4C), favoring the existence of an auto-regulatory loop. The expression of PPARγ (both PPARγ1 and PPARγ2), adipsin and perilipin were not affected by ARA and COX inhibitors (Figure 4C).
Figure 4.
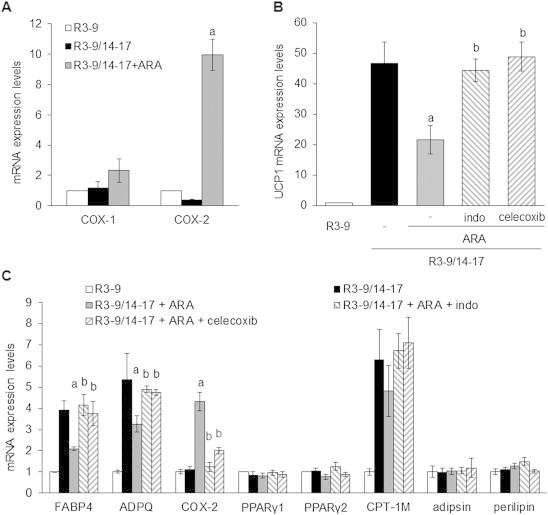
Cyclooxygenases drive ARA effect in hMADS cells. (A) Cyclooxygenases (COX-1 and COX-2) mRNA expression assessed by RT-qPCR in cells exposed to 100 nM rosiglitazone and treated or not with 10 μM ARA between days 14 and 17. Untreated cells were used as control. (B) and (C) hMADS adipocytes were treated with 100 nM rosiglitazone and 10 μM ARA supplemented or not with 1 μM indomethacin (indo) or 100 nM celecoxib. mRNA expression of various adipogenic markers was analyzed by RT-qPCR. Histograms represent mean ± SEM of 3 independent experiments. a: p < 0.01 vs R3–9/14–17; b: p < 0.01 vs R3–9/14–17 + ARA.
3.4. Prostaglandins E2 and F2α but not prostacyclin mediate the ARA inhibitory effect
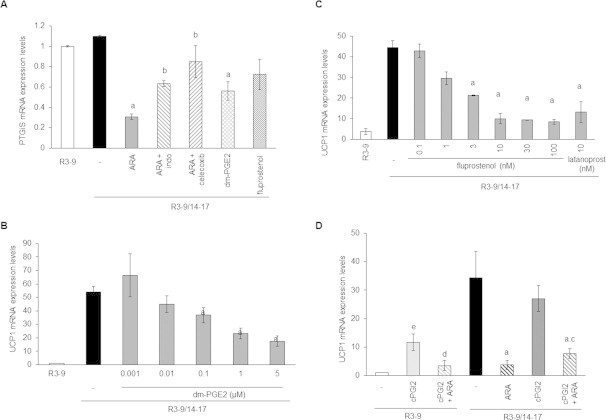
The conversion of ARA to PGH2 via the COX pathway leads to the synthesis of prostaglandins through a variety of prostaglandin synthases. Genes encoding for main prostaglandin synthases (PTGES1 and 2, AKR1B1, AKR1C3, CBR1, PTGIS and PTGDS) are expressed in hMADS adipocytes (data not shown) and were not significantly modulated by ARA except for PGI2 synthase (PTGIS) (Supplemental Figure 1). Expression of PTGIS decreased upon ARA treatment. This inhibitory effect involves COX activity as it was prevented in the presence of COX inhibitors (Supplemental Figure 1).
Under ARA treatment, differentiated brite adipocytes were able to synthesize and secrete PGE2 and PGF2α (Figure 5A). Despite the down-regulation of PTGIS gene expression, cells were not altered in their ability to synthesize PGI2 as shown by measurement of its stable secreted metabolite 6-keto-PGF1α (Figure 5A). As expected, the synthesis of these prostaglandins was dependent on COX-2 activity, evidenced by the inhibition of secreted PGF2α, PGE2 and 6-keto-PGF1α in the presence of celecoxib (Figure 5A).
Figure 5.
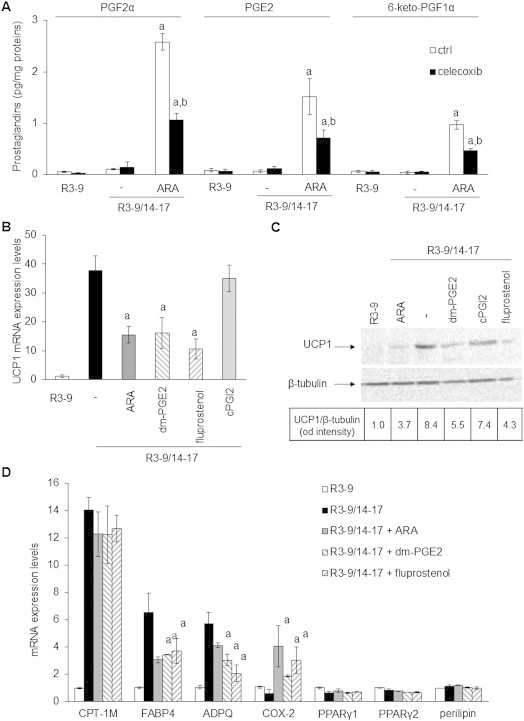
Prostaglandins drive ARA effects on brite adipogenesis. hMADS cells were treated or not with 100 nM rosiglitazone from day 14 to day 17. (A) Rosiglitazone-treated cells were exposed to 10 μM ARA in the presence or not of 100 nM celecoxib for the 3 days. After a last change PGF2α, PGE2 and 6-keto-PGF1α were quantified from culture medium after 10 min incubation by EIA. (B) UCP1 mRNA expression analyzed by RT-qPCR or (C) UCP1 protein level assessed by Western blotting (whole cell lysates, 80 μg/lane, β-tubulin was used as loading control) in rosiglitazone-treated cells exposed to 10 μM ARA, 1 μM 16,16-dm-PGE2 (dm-PGE2), 10 nM fluprostenol (agonist of PGF2α receptor) or 1 μM cPGI2 (stable analog of PGI2). (D) Effects of ARA, dm-PGE2 and fluprostenol on others mRNA expressions analyzed by RT-qPCR. Untreated cells were used as control. Histograms represent mean ± SEM of 3 independent experiments. a: p < 0.01 vs R3–9/14–17; b: p < 0.01 vs R3–9/14–17 + ARA.
In order to determine whether these prostaglandins were indeed responsible of the ARA inhibitory effect on UCP1 expression, specific prostaglandin receptor ligands were used. The 16,16-dimethyl-PGE2 (dm-PGE2), a stable analog of PGE2 which binds to its cognate receptors EP1-4 as well as two agonists of the PGF2α receptor FP, i.e. fluprostenol and latanoprost, were able to inhibit, in a dose dependent manner, UCP1 expression at the mRNA and protein levels (Figure 5B, Supplemental Figure 1B,C). The effects of dm-PGE2 and fluprostenol on other gene expression were similar to those observed in the presence of ARA (Figure 4D) except for PTGIS expression, which was significantly inhibited only by dm-PGE2 (Supplemental Figure 1A).
ARA is a precursor of prostacyclin in hMADS cells (Figure 5A) but its stable analog cPGI2 fails to inhibit UCP1 mRNA expression (Figure 5B). As previously described in other cells [37], cPGI2 was able to replace rosiglitazone in order to induce UCP1 mRNA expression. As found under rosiglitazone treatment, ARA inhibits this cPGI2 effect (Supplemental Figure 1D). Interestingly, cPGI2 and rosiglitazone did not induce additive effect (Figure 5B), and seem to have a common pathway as cPGI2 was unable to reverse the ARA-induced inhibition of UCP1 mRNA expression under rosiglitazone treatment (Supplemental Figure 1D). Altogether, these results indicated that ARA modulated the acquisition of the brite adipocyte phenotype in hMADS cells through the release of PGE2 and PGF2α.
3.5. ARA, PGE2 and PGF2α trigger intracellular calcium oscillations
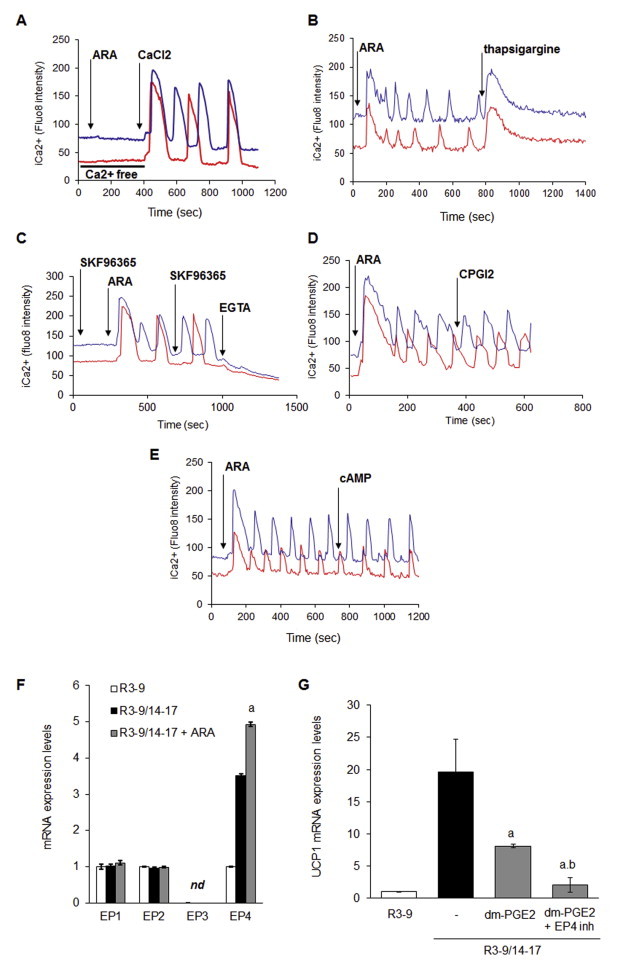
PGF2α and PGE2 receptors (FP and EP1 respectively) are known to be coupled to Gq and intra-cellular calcium signaling. Thus we assessed the possible effects of ARA and various prostaglandin receptor ligands on the changes of intracellular calcium levels in hMADS adipocytes. As shown in Figure 5A, ARA, dm-PGE2 and fluprostenol were able to trigger an intracellular calcium concentration (i[Ca++]) rise in brite adipocytes. This first rise was followed by oscillation of i[Ca++], with sustained frequency and intensity during at least 20 min (Figure 6A and Supplementary videos 1 and 2). LA and cPGI2, which were not effective in inhibiting UCP1 mRNA expression, did not induce i[Ca++] fluxes (Figure 6B).
Figure 6.
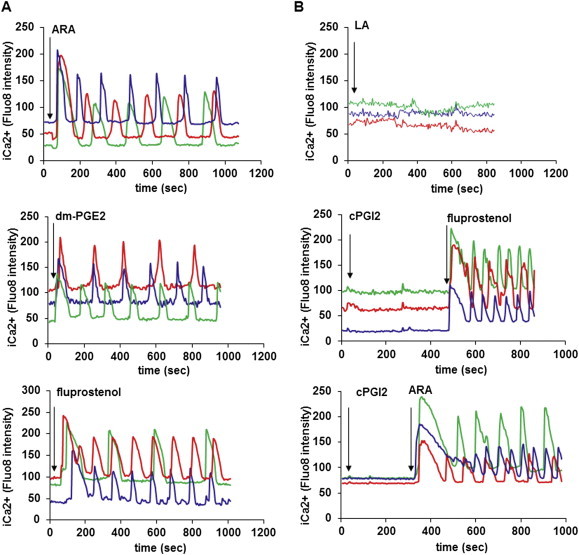
Intra-cellular Ca++ oscillations are induced by ARA and its metabolites. hMADS cells were differentiated into brite adipocytes in the presence rosiglitazone and incubated 15 min with a fluorescent sensitive Ca++ probe (Quest Fluo-8). Cells were analyzed by live fluoromicroscopy. (A) 100 μM ARA, 10 μM dm-PGE2 and 100 nM fluprostenol induce a transitory increase of i[Ca++], followed by i[Ca++] oscillations with a sustained frequency and intensity. (B) 100 μM LA and 10 μM cPGI2 did not trigger i[Ca++] rise. Each track represents integrated imaging of an individual cell. These data are representative of 5 independent experiments (10–50 cells recorded in each experiment).
i[Ca++] oscillations displayed by hMADS adipocytes were dependent on both external and internal pools of Ca++. In the absence of extracellular calcium ARA failed to induce i[Ca++] increase while addition of external calcium restored calcium oscillations (Supplemental Figure 2A). Moreover, i[Ca++] oscillations were completely abolished by the addition of thapsigargin (a non-competitive inhibitor of sarco-endoplasmic reticulum Ca++ ATPases) or EGTA (Supplemental Figure 2B,C). These i[Ca++] oscillations likely reflect the classical profile of Calcium-induced Calcium-release (CICR) phenomenon. The Calcium Release Activated Calcium (CRAC) mechanism might be excluded since the addition of the TRP inhibitor (SKF96365) showed no effect on the ARA-induced calcium oscillations (Supplemental Figure 2C).
PGE2 and cPGI2 are known to activate cAMP dependent pathway. In hMADS adipocytes, EP4 (PGE2 receptor) mRNA levels were up-regulated by ARA treatment (Supplemental Figure 2F). In this situation, EP4 would generate a cAMP compensatory pathway. Disruption of this pathway, using a specific EP4 inhibitor (AH23848), led to a stronger inhibition of UCP1 mRNA expression in response to ARA treatment (Supplemental Figure 2G). This compensatory effect was not associated with modulation of i[Ca++] fluxes, as treatment with cAMP-elevating agents such as 8-bromo-cAMP or cPGI2 did not affect these oscillations (Supplemental Figure 2D,E).
3.6. Inhibition of UCP1 gene expression is mediated by a Ca++/ERK signaling pathway
In order to obtain more insights into the mechanisms involved in ARA and PGs-induced inhibition of UCP1 gene expression, we focused our interest on the use of fluprostenol since its effects were mediated mainly through the cell surface FP receptor via Gq protein. As expected, decreasing extracellular Ca++ availability by EGTA was able to reverse fluprostenol-induced inhibition of UCP1 mRNA expression without affecting adipogenesis as shown by unaltered perilipin mRNA expression (Figure 7A).
Figure 7.
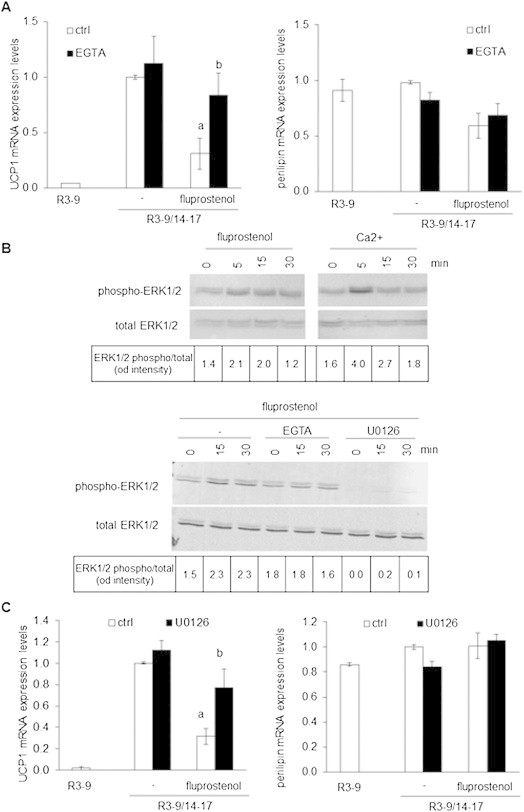
A Ca++/ERK pathway is involved in the inhibition of white to brite adipocyte conversion. (A–C) hMADS cells were treated or not with 100 nM rosiglitazone from day 14 to day 17. Rosiglitazone-treated cells were exposed or not to 10 nM fluprostenol. Unstimulated brite (R3–9/14–17) cells were used as control. (A) UCP1 and Perilipin mRNA expression analyzed by RT-qPCR in the absence or presence of 300 μM EGTA. (B) Upper panel: hMADS adipocytes deprived of Ca++ for 48 h in DMEM/BSA 0.5% and then exposed to 2 mM CaCl2 or 10 nM fluprostenol. Lower panel: deprived hMADS adipocytes pretreated for 10 min with 300 μM EGTA or 10 μM U0126, and then stimulated with 10 nM fluprostenol. Cells were lysed at the indicated times and analyzed by western blotting (whole cell lysate, 25 μg protein/line). Values correspond to ERK1/2 phosphorylated vs ERK1/2 total protein intensity ratio evaluated with fluorescent signal quantification. (C) UCP1 and Perilipin mRNA expression analyzed by RT-qPCR in the absence or presence of 10 μM U0126. Histograms represent mean ± SEM of 3 independent experiments. a: p < 0.01 vs R3–9/14–17; b: p < 0.01 vs R3–9/14–17 + fluprostenol.
It has been demonstrated in various cell types including preadipocytes that fluprostenol was able, via FP receptor, to activate the ERK pathway and to inhibit PPAR activity [16]. As shown in Figure 6B, fluprostenol induced a transient increase in ERK1/2 phosphorylation. Addition of CaCl2 to hMADS adipocytes, pre-incubated for 10 min in Ca++ free media, induced a similar transient phosphorylation of ERK1/2 (Figure 7B). As expected, pretreatment with EGTA or U0126, a widely used MEK/ERK inhibitor, abolished fluprostenol-induced ERK1/2 phosphorylation (Figure 7B). A chronic treatment with U0126 during the conversion of white to brite hMADS adipocytes between days 14 and 17 did not affect UCP1 mRNA induction and adipogenesis (as assessed by perilipin gene expression) but was able to reverse the inhibitory effect of fluprostenol (Figure 7C). Altogether, these data strongly suggest that inhibition of the conversion of white to brite adipocytes by ARA is a multi-step process involving the synthesis and secretion of prostaglandins PGF2α and PGE2. The signaling pathway appears to implicate, with respect to PGF2α, its binding to the cognate FP receptor, i[Ca++] oscillations and ERK phosphorylation leading in turn to a lower PPARγ activity characterized by a decreased expression of PPARγ-target genes, such as ADPQ, FABP4 and UCP1.
3.7. ARA-enriched diet inhibits the recruitment of brite adipocytes induced by a chronic treatment with β3-adrenergic receptor agonist
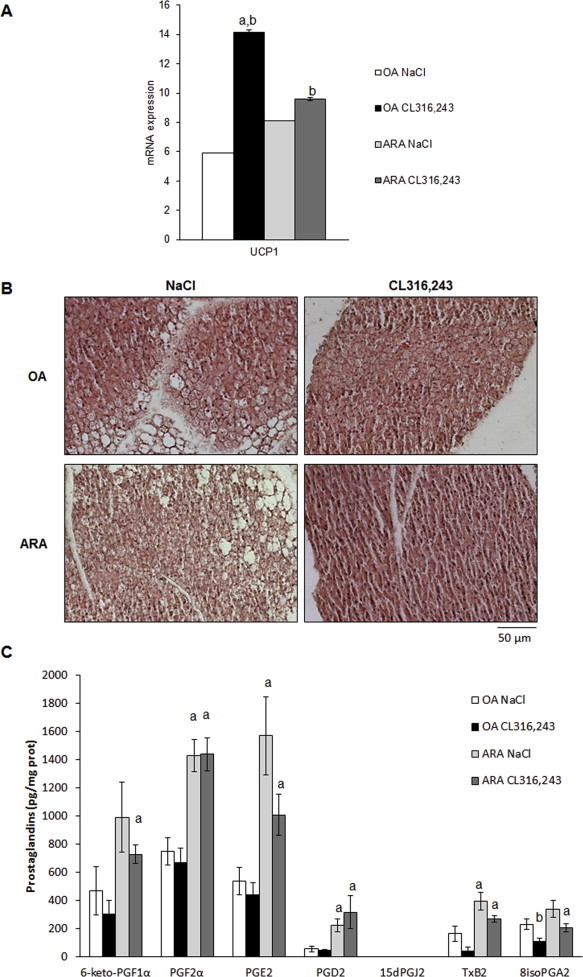
We aimed to investigate in vivo whether prostaglandin synthesis induced by ARA supply can attenuate β-adrenergic-induced UCP1 expression in WAT. For that purpose, we fed C57BL/6 mice a standard diet supplemented with ARA (arachidonate ethyl ester 1.1% w/w) for 4 weeks. We used as a control mice fed an isocaloric diet based on oleic acid (OA) enrichment (oleate ethyl ester 1.1% w/w), since OA does not induce prostaglandin synthesis and does not affect UCP1 expression in hMADS cells (data not shown). As expected, ARA or OA supplementations neither induce weight gain nor modify leptin plasma levels (Figure 8A). In order to investigate the ARA effects on brite adipocyte formation in white adipose tissue, ARA or OA-fed mice received during the last week a β3-adrenergic receptor agonist CL316,243 (1 mg/kg/day) or vehicle. Mice fed ARA-supplemented diet display a defective induction of “browning”. Indeed, molecular analysis of subcutaneous WAT (scWAT) showed an impaired increase of UCP1 mRNA and protein expression upon CL316,243 treatment in ARA-compared to OA-supplemented diet (Figure 8B,C). Histological analysis showed clearly a defect in the formation of multilocular adipocytes characterized by a low lipid droplet content and representative of activated brite/beige adipocytes (Figure 8D). Despite the limited browning found in ARA-fed mice, we detected an increased expression of brown/brite adipocyte markers CPT1-M, CIDEA, PLN5 PRDM16, PGC1α, PAT2 and P2RX5 mRNA as well as of the mitochondrial content marker Citrate Synthase (Figure 8C). Contrasted results were obtained for white adipocyte markers mRNA expression; PPARγ2, CD36 and ASC-1 mRNA increase with ARA-enriched diet differently to ADPQ mRNA which decrease as previously found in vitro with ARA treatment (Figures 2 and 8C).
Figure 8.
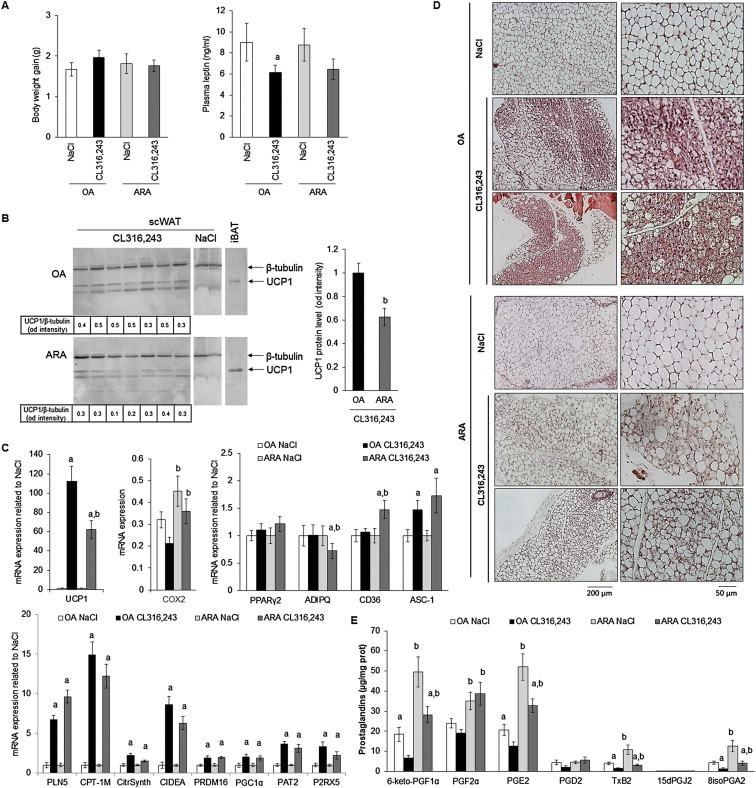
Impact of ARA metabolites production in scWAT on inducible brite adipocytes formation. 10-week-old C57BL/6RccHsd female mice fed standard diet supplemented with ARA or OA for 4 weeks. During the fourth week, mice subdivided in two groups, a first group was treated with CL316,243 and the second group with vehicle (NaCl). (A) Body weight gain between week 1 and 4 and plasma leptin levels were determined. (B) UCP1 protein level was assessed in scWAT (40 μg/lane). β-tubulin was used as loading control and iBAT protein extract (4 μg/lane) as UCP1 positive control. (C) UCP1, COX-2 and representative white and brite adipocyte markers mRNA were determined in scWAT by RT-qPCR. (D) Representative histological sections (4 μm, paraffin-embedded, HES staining) of scWAT from different treatment are shown. (E) Prostanoid amounts were measured by LC-MS/MS in scWAT of each group of mice. Histograms represent means ± SEM of 8–12 mice per group. a: p < 0.01 vs NaCl group and b: p < 0.01 vs OA group.
In order to assess whether ARA effect could be extended to all UCP1-expressing cells, i.e. brown adipocytes per se, the status of UCP1 was analyzed in interscapular BAT (iBAT). Mice fed ARA-supplemented diet and treated with CL316,243 displayed a lower content of UCP1 mRNA compared to control mice (Supplemental Figure 3A), despite the fact that histology analysis, i.e. the pattern of lipid droplets, was comparable whatever the diet (Supplemental Figure 3B).
ARA-supplemented diet enhanced COX-2 mRNA expression (Figure 8C), suggesting changes in the levels of ARA metabolites within scWAT (Figure 8E). Quantification of ARA metabolites has been performed on scWAT and iBAT. Among these metabolites, 6-keto-PGF1α, PGE2 and PGF2α are the most represented prostanoids found in both tissues and, as expected, were increased in mice fed ARA-supplemented diet compared to mice fed OA-supplemented diet. Of note, chronic treatment with CL316,243 led to a significant decrease of 6-keto-PGF1α and PGE2 levels in mice fed either diet, in contrast to PGF2α levels. Interestingly, PGD2 levels were not significantly altered by either diet or treatment and its metabolites 15dPGJ2, a reported PPARγ ligand, was not detected even after CL316,243 treatment. TxB2 and 8isoPGA2, two others ARA COX-derived prostanoids, were detected and their levels exhibited parallel patterns with respect to diets and to chronic CL316,243 treatment. As these prostanoids have not been clearly identified as adipocyte products they might be synthesized and secreted by other cell types present within adipose tissue. Similar observations were obtained for prostanoid levels in iBAT compared to scWAT of mice fed ARA- and OA-supplemented diet, in agreement with the ARA effect on UCP1 gene expression observed in both tissues (Supplemental Figure 3A vs 3C).
4. Discussion
The recent discovery of thermogenic competent adipocytes in adult healthy humans has opened new therapeutic perspectives for the treatment of obesity and type 2 diabetes which aim at increasing energy expenditure by enhancing the formation and activation of brown/brite adipocytes. However, in parallel to developing new treatments, it is of utmost interest to assess in humans the impact of dietary lipids on the conversion of white to brown adipocytes. This issue is highly relevant to body weight regulation since, besides the quantitative importance of hypercaloric high-fat diets leading to WAT excess, the qualitative importance of ω6 poly-unsaturated fatty acids in favoring weight gain has been established in rodents and suggested in recent studies in infants [23,24]. In the present work, we described a potential additional deleterious effect of ω6 fatty acids on the regulation of body weight. ARA treatment of hMADS adipocytes inhibits UCP1 mRNA expression during the acquisition of a brite phenotype and thus decreases oxygen consumption. Indeed, UCP1 induces an over-activity of mitochondria to compensate the increase in the uncoupling process between oxygen consumption and ATP synthesis. By contrast, ARA does not modulate mitochondriogenesis and maximal respiratory capacity of brite adipocytes. Whereas it has been reported that ARA increased DNA synthesis in differentiating preadipocytes [38], ARA treatment of hMADS cells does not modulate DNA synthesis when ARA-treatment was applied on differentiated cells (data not shown).
hMADS adipocytes display the complete machinery to metabolize ARA into PGs of the 2 series and were able to respond to PGs in an autocrine/paracrine manner. In these cells, PGs mediate the ARA effect as specific inhibition of COX-2 activity blunted these effects. Among secreted PGs in response to ARA treatment, PGI2 and PGE2 have been described to induce white to brite adipocyte conversion [37,39,40]. In hMADS cells, cPGI2 neither up-regulated UCP1 expression nor was able to reverse the inhibitory effect of ARA while dm-PGE2 inhibited UCP1 expression under rosiglitazone treatment. Furthermore, ARA appeared to inhibit PTGIS expression via the COX pathway, which could then favor PGF2α and PGE2 effects at the expense of PGI2, leading to inhibition of the browning process of white adipocytes.
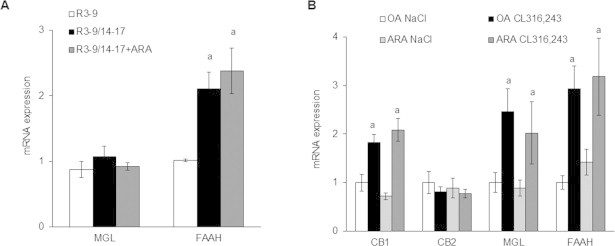
Endocannabinoid metabolism by COX-2 [41] represents another pathway linking ARA to its inhibitory effect of UCP1 expression, especially viavia the prostaglandins analogs, PG-glycerol esters and PG-ethanolamides, which are able to activate the same prostaglandin receptors. Interestingly, monoacylglycerol lipase (MGL) and fatty acid amide hydrolase (FAAH) mRNA expression, which encode for enzymes involved in the hydrolysis of endocannabinoids (N-arachidonoylethanolamine and 2-arachidonoylglycerol) in ARA, and presumably decreasing their availability, are increased under brite conditions (R3–9/14-–17 in vitro and under CL316,243 treatment in vivo). If our results are correlated to a decrease in enzyme activities, it is tempting to assume that a decrease in endocannabinoid levels will favor brite adipocyte recruitment under physiological conditions. Nevertheless, expression of cannabinoid receptors 1 and 2 in vivo, and FAAH and MGL in vivo and in vitro, was not affected by ARA treatment (Supplemental Figure 4) suggesting a minor role, if any, of endocannabinoids in ARA effect. Further experiments determining the levels on endocannabinoids and using pharmacological tools will shed light on the mechanisms involved in brite adipocyte recruitment. Disequilibrium between ω6 and ω3 polyunsaturated fatty acid metabolites could be involved in ARA-inhibitory effect. Lipooxygenase derived metabolites from DHA, such as resolvin D1 and D2, do not seem to be involved, as they were not detected in BAT. Moreover, resolvin D2 was detected in scWAT and its level was not affected in animals fed by ARA enriched diet (data not shown).
Extracellular PGE2 is able to bind to various receptors with different affinities [42]. hMADS adipocytes express three PGE2 receptors, i.e. EP1, EP2 and EP4 (Supplemental Figure 2F) allowing PGE2 to promote cAMP signaling (via EP2 and EP4 receptors) and Ca++ signaling (via EP1 receptor). In these cells, 16,16-dm-PGE2 induced a dose dependent inhibition of UCP1 mRNA expression, with a maximum effect at 5 μM while it activated i[Ca++] oscillations. Thus, we assume that ARA-derived PGE2 bound to the low-affinity EP1 receptor as well as to the FP receptor. It is worth noticing that PGE2 was able to promote white to brown/brite conversion at lower concentrations via its high-affinity EP4 receptor while inhibiting this process at higher concentrations via its low-affinity EP1 receptor (in this study). Indeed, activation of these two opposite pathways in hMADS adipocytes are in agreement with the potent inhibitory effect of high doses of 16,16-dm-PGE2 in the presence of a specific EP4 receptor antagonist when compared to 16,16-dm-PGE2 alone (Supplemental Figure 2G).
ARA also induced synthesis and secretion of PGF2α in hMADS adipocytes. This PG bound to its cognate FP receptor and inhibited the “browning” process as shown with two highly specific agonists, fluprostenol and latanoprost. Interestingly, ARA, fluprostenol and high concentrations of 16,16-dm-PGE2 were able to induce sustained i[Ca++] oscillations. It is known that human mesenchymal stem cells and preadipocytes displayed spontaneous i[Ca++] oscillations by contrast to mature adipocytes [43,44]. However, transient i[Ca++] flux controls early and late steps of human adipocyte differentiation [21,45] whereas in rodents, a potential regulation of glucose uptake by a non-canonical i[Ca++] oscillation implicates this pathway in adipocyte metabolism [46,47]. Moreover, TRPV4 as a potent Ca++ channel appears as an important player in the browning process [48].
Herein, we described for the first time the occurrence of i[Ca++] oscillations in the conversion of human white to brown adipocytes. Our data show that intracellular storage depletion was the first step of the ARA-mediated UCP1 inhibition, though the mechanism of extracellular Ca++ entry remained unknown. Two mechanisms could be proposed, i.e. i) a voltage-dependent calcium channel (Ca(V)), induced by membrane depolarization or ii) a store-operated calcium channel (SOCE) induced by reticulum depletion as several Ca(V), STIM, ORAI and TRPC proteins were expressed by hMADS adipocytes (data not shown). However, neither membrane depolarization (by addition of high KCl concentrations, data not shown) nor the use of SKF96365 (a non-specific inhibitor of SOCE) were able to inhibit i[Ca++] oscillations (Figure S3C). Cross-talk between Ca++ and cAMP signaling has been reported. It is known that cAMP signaling is highly important for white and brown adipocytes, whereas cAMP levels have been shown to reduce or delay Ca++ oscillations [49]. Interestingly, in hMADS adipocytes, neither 8-Br-cAMP nor cPGI2 were able to modulate i[Ca++] oscillations (Supplemental Figure 2D,E).
ARA, fluprostenol and 16,16-dm-PGE2 inhibited specifically UCP1, FABP4 and ADIPOQ mRNA expression which have been reported to be PPARγ target genes, strongly suggesting a specific inhibitory effect of PG-mediated pathway via PPARγ activity. It is known that Ca++ signaling controlled early and late steps of adipogenesis through inhibition of PPARγ expression and the involvement of Ca++/calcineurin pathway [18,50–52]. Our data rule out this possibility as treatment with FK506 (a specific calcineurin inhibitor), was unable to reverse the inhibition of UCP1 expression in the presence of ARA or PGs (data not shown).
PGF2α has been reported to activate Ca++ signaling and to induce PPARγ phosphorylation and thus its inactivation [16]. ERK1/2 signaling pathway appeared to be involved in this phenomenon in adenocarcinoma cells in which PGF2α via Gq/Ca++ signaling allowed phosphorylation of ERK1/2 which in turn led to PPARγ degradation through the ubiquitin/proteasome pathway [53,54]. In a similar way, inhibition of ERK1/2 phosphorylation in hMADS adipocytes reversed the fluprostenol-induced inhibition of UCP1 mRNA. As extracellular Ca++ and fluprostenol induced a transient phosphorylation of ERK1/2, our results are in favor of a mechanism involving a “PG- > Ca++- > ERK1/2- > PPARγ- > UCP1” pathway in controlling the conversion of white to brite adipocytes.
In vivo, COX pathway has been shown to be crucial for the induction of brite adipocytes in 129Sv mice, a strain resistant to obesity due to a high content in brown and brite adipocytes [37,40]. In C57BL/6 mice, a strain sensitive to high fat diets, a recent report describes in contrast an opposite role of the COX pathway. Indeed, inhibition of COX-1 and -2 by indomethacin in mice fed high fat diet prevents weight gain, partly due to enhanced recruitment of brite adipocytes in scWAT [55]. Our data obtained with C57BL/6 mice fed an ARA-supplemented diet are in agreement with this observation as increased prostanoid levels were associated with impairment of brite adipocyte formation. Moreover, chronic stimulation of the β3-adrenergic pathway in mice fed OA-supplemented diet induces a significant decrease of prostaglandins and prostacyclin levels, making unlikely the involvement of prostanoids in brite adipogenesis (Figure 8E). It is tempting to postulate that a strong but transient induction of prostanoids occurs within the first days of CL316,243 treatment and cold exposure [37,40,56] and is important for the induction of brown/brite adipocyte differentiation. However, a chronic excess in prostaglandins, due to a lipid supply change, leads to an inhibition of this differentiation and of UCP1 thermogenic activity.
5. Conclusion
Collectively, our data demonstrate the specific nutrient regulation of the browning process in WAT by ω6 ARA in addition to its role in stimulating the formation of white adipocytes. In aggregate, prevention of excessive consumption of ω6 fatty acids appears suitable as disequilibrium of polyunsaturated fatty acid metabolism may contribute to excessive adipose tissue development.
Author contributions
The author(s) have made the following declarations about their contributions: Conceived and designed the experiments: D.P., E.Z.A. Performed the experiments: D.P., R.G., G.B., P.L.F., J.C.C., M.D., M.G., M.T., C.D., E.Z.A. Analyzed the data: D.P., R.G., P.L.F., A.V., M.T., C.D., S.H., D.L., G.A., E.Z.A. Contributed reagents/materials/analysis tools: J.B.M., M.T., C.D. Wrote the manuscript: D.P., D.L., G.A., E.Z.A.
Acknowledgments
The authors greatly acknowledge of IRCAN Animal core facility. This work was supported by CNRS, EU FP7 project DIABAT (HEALTH-F2-2011-278373), French Agence Nationale de la Recherche (ANR-10-BLAN-1105 miRBAT), Nutricia Research Foundation (“2011–25”) and Société Française de Nutrition (2012 Research Prize).
Conflict of interest
The authors declare having no conflict of interest.
Appendix A. Supplementary data
The following are the supplementary data related to this article:
References
- 1.Cannon B., Nedergaard J. Brown adipose tissue: function and physiological significance. Physiological Reviews. 2004;84:277–359. doi: 10.1152/physrev.00015.2003. [DOI] [PubMed] [Google Scholar]
- 2.Feldmann H.M., Golozoubova V., Cannon B., Nedergaard J. UCP1 ablation induces obesity and abolishes diet-induced thermogenesis in mice exempt from thermal stress by living at thermoneutrality. Cell Metabolism. 2009;9:203–209. doi: 10.1016/j.cmet.2008.12.014. [DOI] [PubMed] [Google Scholar]
- 3.Petrovic N., Walden T.B., Shabalina I.G., Timmons J.A., Cannon B., Nedergaard J. Chronic peroxisome proliferator-activated receptor gamma (PPARgamma) activation of epididymally derived white adipocyte cultures reveals a population of thermogenically competent, UCP1-containing adipocytes molecularly distinct from classic brown adipocytes. Journal of Biological Chemistry. 2010;285:7153–7164. doi: 10.1074/jbc.M109.053942. [DOI] [PMC free article] [PubMed] [Google Scholar]
- 4.Ishibashi J., Seale P. Medicine. Beige can be slimming. Science. 2010;328:1113–1114. doi: 10.1126/science.1190816. [DOI] [PMC free article] [PubMed] [Google Scholar]
- 5.Wang Q.A., Tao C., Gupta R.K., Scherer P.E. Tracking adipogenesis during white adipose tissue development, expansion and regeneration. Nature Medicine. 2013;19:1338–1344. doi: 10.1038/nm.3324. [DOI] [PMC free article] [PubMed] [Google Scholar]
- 6.Cinti S. Transdifferentiation properties of adipocytes in the adipose organ. American Journal of Physiology. Endocrinology and Metabolism. 2009;297:E977–E986. doi: 10.1152/ajpendo.00183.2009. [DOI] [PubMed] [Google Scholar]
- 7.Rosenwald M., Perdikari A., Rulicke T., Wolfrum C. Bi-directional interconversion of brite and white adipocytes. Nature Cell Biology. 2013;15:659–667. doi: 10.1038/ncb2740. [DOI] [PubMed] [Google Scholar]
- 8.Cypess A.M., Lehman S., Williams G., Tal I., Rodman D., Goldfine A.B. Identification and importance of brown adipose tissue in adult humans. New England Journal of Medicine. 2009;360:1509–1517. doi: 10.1056/NEJMoa0810780. [DOI] [PMC free article] [PubMed] [Google Scholar]
- 9.Nedergaard J., Bengtsson T., Cannon B. Unexpected evidence for active brown adipose tissue in adult humans. American Journal of Physiology. Endocrinology and Metabolism. 2007;293:E444–E452. doi: 10.1152/ajpendo.00691.2006. [DOI] [PubMed] [Google Scholar]
- 10.van Marken Lichtenbelt W.D., Vanhommerig J.W., Smulders N.M., Drossaerts J.M., Kemerink G.J., Bouvy N.D. Cold-activated brown adipose tissue in healthy men. New England Journal of Medicine. 2009;360:1500–1508. doi: 10.1056/NEJMoa0808718. [DOI] [PubMed] [Google Scholar]
- 11.Virtanen K.A., Lidell M.E., Orava J., Heglind M., Westergren R., Niemi T. Functional brown adipose tissue in healthy adults. New England Journal of Medicine. 2009;360:1518–1525. doi: 10.1056/NEJMoa0808949. [DOI] [PubMed] [Google Scholar]
- 12.Zingaretti M.C., Crosta F., Vitali A., Guerrieri M., Frontini A., Cannon B. The presence of UCP1 demonstrates that metabolically active adipose tissue in the neck of adult humans truly represents brown adipose tissue. FASEB Journal. 2009;23:3113–3120. doi: 10.1096/fj.09-133546. [DOI] [PubMed] [Google Scholar]
- 13.Elabd C., Chiellini C., Carmona M., Galitzky J., Cochet O., Petersen R. Human multipotent adipose-derived stem cells differentiate into functional brown adipocytes. Stem Cells. 2009;27:2753–2760. doi: 10.1002/stem.200. [DOI] [PubMed] [Google Scholar]
- 14.Pisani D.F., Djedaini M., Beranger G.E., Elabd C., Scheideler M., Ailhaud G. Differentiation of human adipose-derived stem cells into “Brite” (Brown-in-White) adipocytes. Frontiers in Endocrinology. 2011;2:87. doi: 10.3389/fendo.2011.00087. [DOI] [PMC free article] [PubMed] [Google Scholar]
- 15.Negrel R., Gaillard D., Ailhaud G. Prostacyclin as a potent effector of adipose-cell differentiation. Biochemical Journal. 1989;257:399–405. doi: 10.1042/bj2570399. [DOI] [PMC free article] [PubMed] [Google Scholar]
- 16.Reginato M.J., Krakow S.L., Bailey S.T., Lazar M.A. Prostaglandins promote and block adipogenesis through opposing effects on peroxisome proliferator-activated receptor gamma. Journal of Biological Chemistry. 1998;273:1855–1858. doi: 10.1074/jbc.273.4.1855. [DOI] [PubMed] [Google Scholar]
- 17.Massiera F., Saint-Marc P., Seydoux J., Murata T., Kobayashi T., Narumiya S. Arachidonic acid and prostacyclin signaling promote adipose tissue development: a human health concern? Journal of Lipid Research. 2003;44:271–279. doi: 10.1194/jlr.M200346-JLR200. [DOI] [PubMed] [Google Scholar]
- 18.Liu L., Clipstone N.A. Prostaglandin F2alpha inhibits adipocyte differentiation via a G alpha q-calcium-calcineurin-dependent signaling pathway. Journal of Cellular Biochemistry. 2007;100:161–173. doi: 10.1002/jcb.21044. [DOI] [PubMed] [Google Scholar]
- 19.Ueno T., Fujimori K. Novel suppression mechanism operating in early phase of adipogenesis by positive feedback loop for enhancement of cyclooxygenase-2 expression through prostaglandin F2alpha receptor mediated activation of MEK/ERK-CREB cascade. FEBS Journal. 2011;278:2901–2912. doi: 10.1111/j.1742-4658.2011.08213.x. [DOI] [PubMed] [Google Scholar]
- 20.Vassaux G., Gaillard D., Darimont C., Ailhaud G., Negrel R. Differential response of preadipocytes and adipocytes to prostacyclin and prostaglandin E2: physiological implications. Endocrinology. 1992;131:2393–2398. doi: 10.1210/endo.131.5.1330499. [DOI] [PubMed] [Google Scholar]
- 21.Mater M.K., Pan D., Bergen W.G., Jump D.B. Arachidonic acid inhibits lipogenic gene expression in 3T3-L1 adipocytes through a prostanoid pathway. Journal of Lipid Research. 1998;39:1327–1334. [PubMed] [Google Scholar]
- 22.Borglum J.D., Pedersen S.B., Ailhaud G., Negrel R., Richelsen B. Differential expression of prostaglandin receptor mRNAs during adipose cell differentiation. Prostaglandins and Other Lipid Mediators. 1999;57:305–317. doi: 10.1016/s0090-6980(98)00082-3. [DOI] [PubMed] [Google Scholar]
- 23.Ailhaud G., Massiera F., Weill P., Legrand P., Alessandri J.M., Guesnet P. Temporal changes in dietary fats: role of n-6 polyunsaturated fatty acids in excessive adipose tissue development and relationship to obesity. Progress in Lipid Research. 2006;45:203–236. doi: 10.1016/j.plipres.2006.01.003. [DOI] [PubMed] [Google Scholar]
- 24.Muhlhausler B.S., Ailhaud G.P. Omega-6 polyunsaturated fatty acids and the early origins of obesity. Current Opinion in Endocrinology, Diabetes, and Obesity. 2013;20:56–61. doi: 10.1097/MED.0b013e32835c1ba7. [DOI] [PubMed] [Google Scholar]
- 25.Donahue S.M., Rifas-Shiman S.L., Gold D.R., Jouni Z.E., Gillman M.W., Oken E. Prenatal fatty acid status and child adiposity at age 3 y: results from a US pregnancy cohort. American Journal of Clinical Nutrition. 2011;93:780–788. doi: 10.3945/ajcn.110.005801. [DOI] [PMC free article] [PubMed] [Google Scholar]
- 26.Moon R.J., Harvey N.C., Robinson S.M., Ntani G., Davies J.H., Inskip H.M. Maternal plasma polyunsaturated fatty acid status in late pregnancy is associated with offspring body composition in childhood. Journal of Clinical Endocrinology & Metabolism. 2013;98:299–307. doi: 10.1210/jc.2012-2482. [DOI] [PMC free article] [PubMed] [Google Scholar]
- 27.Inoue K., Kishida K., Hirata A., Funahashi T., Shimomura I. Low serum eicosapentaenoic acid/arachidonic acid ratio in male subjects with visceral obesity. Nutrition & Metabolim (Lond) 2013;10:25. doi: 10.1186/1743-7075-10-25. [DOI] [PMC free article] [PubMed] [Google Scholar]
- 28.Savva S.C., Chadjigeorgiou C., Hatzis C., Kyriakakis M., Tsimbinos G., Tornaritis M. Association of adipose tissue arachidonic acid content with BMI and overweight status in children from Cyprus and Crete. British Journal of Nutrition. 2004;91:643–649. doi: 10.1079/BJN20031084. [DOI] [PubMed] [Google Scholar]
- 29.Williams E.S., Baylin A., Campos H. Adipose tissue arachidonic acid and the metabolic syndrome in Costa Rican adults. Clinical Nutrition. 2007;26:474–482. doi: 10.1016/j.clnu.2007.03.004. [DOI] [PMC free article] [PubMed] [Google Scholar]
- 30.Claria J., Nguyen B.T., Madenci A.L., Ozaki C.K., Serhan C.N. Diversity of lipid mediators in human adipose tissue depots. American Journal of Physiology. Cell Physiology. 2013;304:C1141–C1149. doi: 10.1152/ajpcell.00351.2012. [DOI] [PMC free article] [PubMed] [Google Scholar]
- 31.Rodriguez A.M., Elabd C., Delteil F., Astier J., Vernochet C., Saint-Marc P. Adipocyte differentiation of multipotent cells established from human adipose tissue. Biochemical and Biophysical Research Communications. 2004;315:255–263. doi: 10.1016/j.bbrc.2004.01.053. [DOI] [PubMed] [Google Scholar]
- 32.Rodriguez A.M., Pisani D., Dechesne C.A., Turc-Carel C., Kurzenne J.Y., Wdziekonski B. Transplantation of a multipotent cell population from human adipose tissue induces dystrophin expression in the immunocompetent mdx mouse. Journal of Experimental Medicine. 2005;201:1397–1405. doi: 10.1084/jem.20042224. [DOI] [PMC free article] [PubMed] [Google Scholar]
- 33.Zaragosi L.E., Ailhaud G., Dani C. Autocrine fibroblast growth factor 2 signaling is critical for self-renewal of human multipotent adipose-derived stem cells. Stem Cells. 2006;24:2412–2419. doi: 10.1634/stemcells.2006-0006. [DOI] [PubMed] [Google Scholar]
- 34.Negrel R., Grimaldi P., Ailhaud G. Establishment of preadipocyte clonal line from epididymal fat pad of ob/ob mouse that responds to insulin and to lipolytic hormones. Proceedings of the National Academy of Sciences of the United States of America. 1978;75:6054–6058. doi: 10.1073/pnas.75.12.6054. [DOI] [PMC free article] [PubMed] [Google Scholar]
- 35.Le Faouder P., Baillif V., Spreadbury I., Motta J.P., Rousset P., Chene G. LC-MS/MS method for rapid and concomitant quantification of pro-inflammatory and pro-resolving polyunsaturated fatty acid metabolites. Journal of Chromatography B: Analytical Technologies in the Biomedical and Life Sciences. 2013;932:123–133. doi: 10.1016/j.jchromb.2013.06.014. [DOI] [PubMed] [Google Scholar]
- 36.Klingenspor M., Ivemeyer M., Wiesinger H., Haas K., Heldmaier G., Wiesner R.J. Biogenesis of thermogenic mitochondria in brown adipose tissue of Djungarian hamsters during cold adaptation. Biochemical Journal. 1996;316(Pt 2):607–613. doi: 10.1042/bj3160607. [DOI] [PMC free article] [PubMed] [Google Scholar]
- 37.Vegiopoulos A., Muller-Decker K., Strzoda D., Schmitt I., Chichelnitskiy E., Ostertag A. Cyclooxygenase-2 controls energy homeostasis in mice by de novo recruitment of brown adipocytes. Science. 2010;328:1158–1161. doi: 10.1126/science.1186034. [DOI] [PubMed] [Google Scholar]
- 38.Garcia B., Martinez-de-Mena R., Obregon M.J. Arachidonic acid stimulates DNA synthesis in brown preadipocytes through the activation of protein kinase C and MAPK. Biochimica et Biophysica Acta. 2012;1821:1309–1315. doi: 10.1016/j.bbalip.2012.06.011. [DOI] [PubMed] [Google Scholar]
- 39.Garcia-Alonso V., Lopez-Vicario C., Titos E., Moran-Salvador E., Gonzalez-Periz A., Rius B. Coordinate functional regulation between microsomal prostaglandin e Synthase-1 (mPGES-1) and peroxisome proliferator-activated receptor gamma (PPARgamma) in the conversion of white-to-brown adipocytes. Journal of Biological Chemistry. 2013;288:28230–28242. doi: 10.1074/jbc.M113.468603. [DOI] [PMC free article] [PubMed] [Google Scholar]
- 40.Madsen L., Pedersen L.M., Lillefosse H.H., Fjaere E., Bronstad I., Hao Q. UCP1 induction during recruitment of brown adipocytes in white adipose tissue is dependent on cyclooxygenase activity. PloS One. 2010;5:e11391. doi: 10.1371/journal.pone.0011391. [DOI] [PMC free article] [PubMed] [Google Scholar]
- 41.Alhouayek M., Muccioli G.G. COX-2-derived endocannabinoid metabolites as novel inflammatory mediators. Trends in Pharmacological Sciences. 2014;35:284–292. doi: 10.1016/j.tips.2014.03.001. [DOI] [PubMed] [Google Scholar]
- 42.Kringelholt S., Simonsen U., Bek T. Dual effect of prostaglandins on isolated intraocular porcine ciliary arteries. Acta Ophthalmologica. 2013;91:498–504. doi: 10.1111/j.1755-3768.2012.02479.x. [DOI] [PubMed] [Google Scholar]
- 43.Hu R., He M.L., Hu H., Yuan B.X., Zang W.J., Lau C.P. Characterization of calcium signaling pathways in human preadipocytes. Journal of Cellular Physiology. 2009;220:765–770. doi: 10.1002/jcp.21823. [DOI] [PubMed] [Google Scholar]
- 44.Kawano S., Shoji S., Ichinose S., Yamagata K., Tagami M., Hiraoka M. Characterization of Ca(2+) signaling pathways in human mesenchymal stem cells. Cell Calcium. 2002;32:165–174. doi: 10.1016/s0143416002001240. [DOI] [PubMed] [Google Scholar]
- 45.Shi H., Halvorsen Y.D., Ellis P.N., Wilkison W.O., Zemel M.B. Role of intracellular calcium in human adipocyte differentiation. Physiological Genomics. 2000;3:75–82. doi: 10.1152/physiolgenomics.2000.3.2.75. [DOI] [PubMed] [Google Scholar]
- 46.Hardy R.W., Ladenson J.H., Hruska K.A., Jiwa A.H., McDonald J.M. The effects of extracellular calcium and epinephrine on cytosolic-free calcium in single rat adipocytes. Endocrinology. 1992;130:3694–3702. doi: 10.1210/endo.130.6.1597165. [DOI] [PubMed] [Google Scholar]
- 47.Turovsky E.A., Turovskaya M.V., Dolgacheva L.P., Zinchenko V.P., Dynnik V.V. Acetylcholine promotes Ca2+ and NO-oscillations in adipocytes implicating Ca2+-->NO-->cGMP-->cADP-ribose-->Ca2+ positive feedback loop–modulatory effects of norepinephrine and atrial natriuretic peptide. PloS One. 2013;8:e63483. doi: 10.1371/journal.pone.0063483. [DOI] [PMC free article] [PubMed] [Google Scholar]
- 48.Ye L., Kleiner S., Wu J., Sah R., Gupta R.K., Banks A.S. TRPV4 is a regulator of adipose oxidative metabolism, inflammation, and energy homeostasis. Cell. 2012;151:96–110. doi: 10.1016/j.cell.2012.08.034. [DOI] [PMC free article] [PubMed] [Google Scholar]
- 49.Tertyshnikova S., Yan X., Fein A. cGMP inhibits IP3-induced Ca2+ release in intact rat megakaryocytes via cGMP- and cAMP-dependent protein kinases. Journal of Physiology. 1998;512(Pt 1):89–96. doi: 10.1111/j.1469-7793.1998.089bf.x. [DOI] [PMC free article] [PubMed] [Google Scholar]
- 50.Chen Y.Y., Lee M.H., Hsu C.C., Wei C.L., Tsai Y.C. Methyl cinnamate inhibits adipocyte differentiation via activation of the CaMKK2-AMPK pathway in 3T3-L1 preadipocytes. Journal of Agricultural and Food Chemistry. 2012;60:955–963. doi: 10.1021/jf203981x. [DOI] [PubMed] [Google Scholar]
- 51.Fujimori K., Ueno T., Nagata N., Kashiwagi K., Aritake K., Amano F. Suppression of adipocyte differentiation by aldo-keto reductase 1B3 acting as prostaglandin F2alpha synthase. Journal of Biological Chemistry. 2010;285:8880–8886. doi: 10.1074/jbc.M109.077164. [DOI] [PMC free article] [PubMed] [Google Scholar]
- 52.Neal J.W., Clipstone N.A. Calcineurin mediates the calcium-dependent inhibition of adipocyte differentiation in 3T3-L1 cells. Journal of Biological Chemistry. 2002;277:49776–49781. doi: 10.1074/jbc.M207913200. [DOI] [PubMed] [Google Scholar]
- 53.Jabbour H.N., Sales K.J., Boddy S.C., Anderson R.A., Williams A.R. A positive feedback loop that regulates cyclooxygenase-2 expression and prostaglandin F2alpha synthesis via the F-series-prostanoid receptor and extracellular signal-regulated kinase 1/2 signaling pathway. Endocrinology. 2005;146:4657–4664. doi: 10.1210/en.2005-0804. [DOI] [PubMed] [Google Scholar]
- 54.Floyd Z.E., Stephens J.M. Interferon-gamma-mediated activation and ubiquitin-proteasome-dependent degradation of PPARgamma in adipocytes. Journal of Biological Chemistry. 2002;277:4062–4068. doi: 10.1074/jbc.M108473200. [DOI] [PubMed] [Google Scholar]
- 55.Fjaere E., Aune U.L., Roen K., Keenan A.H., Ma T., Borkowski K. Indomethacin treatment prevents high fat diet-induced obesity and insulin resistance but not glucose intolerance in C57BL/6J mice. Journal of Biological Chemistry. 2014;289:16032–16045. doi: 10.1074/jbc.M113.525220. [DOI] [PMC free article] [PubMed] [Google Scholar]
- 56.Lee Y.H., Petkova A.P., Granneman J.G. Identification of an adipogenic niche for adipose tissue remodeling and restoration. Cell Metabolism. 2013;18:355–367. doi: 10.1016/j.cmet.2013.08.003. [DOI] [PMC free article] [PubMed] [Google Scholar]
Associated Data
This section collects any data citations, data availability statements, or supplementary materials included in this article.