

Summary
Human bone marrow (BM) contains a rare population of nonhematopoietic mesenchymal stromal cells (MSCs), which are of central importance for the hematopoietic microenvironment. However, the precise phenotypic definition of these cells in adult BM has not yet been reported. In this study, we show that low/negative expression of CD140a (PDGFR-α) on lin−/CD45−/CD271+ BM cells identified a cell population with very high MSC activity, measured as fibroblastic colony-forming unit frequency and typical in vitro and in vivo stroma formation and differentiation capacities. Furthermore, these cells exhibited high levels of genes associated with mesenchymal lineages and HSC supportive function. Moreover, lin−/CD45−/CD271+/CD140alow/− cells effectively mediated the ex vivo expansion of transplantable CD34+ hematopoietic stem cells. Taken together, these data indicate that CD140a is a key negative selection marker for adult human BM-MSCs, which enables to prospectively isolate a close to pure population of candidate human adult stroma stem/progenitor cells with potent hematopoiesis-supporting capacity.
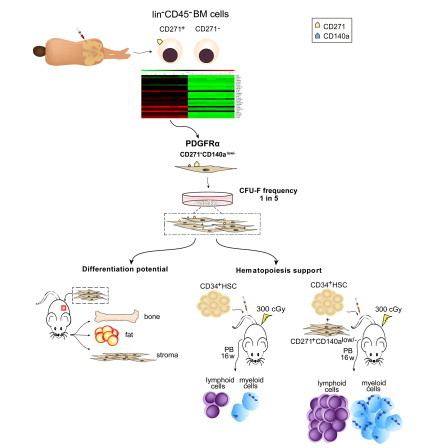
Graphical Abstract
Highlights
-
•
Comparative gene expression profiling identified MSC markers
-
•
Primary adult bone marrow MSCs are CD140 (PDGFR-α) low/negative
-
•
CD140alow/− cells have typical in vitro and in vivo MSC properties
-
•
Coculture with CD140alow/− cells effectively expanded transplantable CD34+ HSCs
Scheding and colleagues report that low/negative expression of PDGFR-α on lin−/CD45−/CD271+ bone marrow cells identified a cell population with very high CFU-F activity, typical in vitro and in vivo MSC properties, and HSC supportive function. These data indicate that PDGFR-α is a key marker for adult human BM-MSCs, which are critical for the definition of the putative stroma stem cells.
Introduction
Human bone marrow (BM) contains—besides the well-known hematopoietic stem cells (HSCs)—a population of nonhematopoietic mesenchymal stromal cells (MSCs), which are multipotent and can differentiate toward skeletal lineages in vivo (Sacchetti et al., 2007). In vitro, clonogenic cells, which are denoted as colony-forming unit-fibroblasts (CFU-Fs) (Friedenstein et al., 1970), can be assayed from the BM as plastic adherent cells giving rise to fibroblastic colonies. These CFU-F cells are considered to reflect the primary BM-MSC, and upon further proliferation in culture, their descendants make up the extensively studied cultured MSCs (Keating, 2012).
BM-MSCs are able to generate hematopoietic stroma upon transplantation in vivo, thus providing the specialized microenvironments for HSCs (Sacchetti et al., 2007). Furthermore, BM-MSCs have been shown to play an important role in regulating self-renewal and differentiation of HSCs (Méndez-Ferrer et al., 2010), and they have also been implicated in the development of hematological malignancies (Raaijmakers et al., 2010).
However, the precise in vivo identity and phenotypic signature of adult BM-MSCs have thus far remained elusive (Keating, 2012). Therefore, this current study aimed for a precise phenotypic characterization of the human BM stromal cell population by utilizing comparative gene expression profiling as a screening tool. Based on this screening, low/negative expression of CD140a (PDGFR-α) was identified as the key feature that enabled the isolation of a close to pure population of primary MSC in adult human BM nonhematopoietic CD271+ cells. In contrast, human fetal BM-MSCs were recently reported to be CD140a positive (Pinho et al., 2013), indicating that PDGFR-α expression is regulated developmentally.
Results and Discussion
Comparative Gene Expression Analysis of lin−/CD45−/CD271+ versus lin−/CD45−/CD271− BM Cells Identifies Human MSC Markers
We and others have shown that CFU-Fs were highly and exclusively enriched only in lin−/CD45−/CD271+ BM cells but not in the CD271− fraction (Churchman et al., 2012; Tormin et al., 2011). Therefore, an array-based gene expression analysis was performed comparing these two cell populations as a screening tool to identify potential MSC surface markers (the sorting strategy is presented in Figure S1 available online). In total, 219 genes were significantly upregulated in the CD271+ subset, including typical MSC genes as well as genes encoding for cytokines, growth factors, and extracellular matrix proteins (Table S1).
Twenty-eight upregulated genes were related to surface-expressed molecules (Figure 1A; Table S2). Only eight genes were cell surface markers that had been previously reported to be expressed on primary MSCs, i.e., LEPR/CD295, TGFBRIII, CDH11, and FGFRIII (Churchman et al., 2012); CD140b, CD10, CD106 (Battula et al., 2008; Bühring et al., 2007; Gronthos et al., 2003); and CD140a (Pinho et al., 2013). The remaining 20 genes, of which four were selected for validation by quantitative RT-PCR confirming the results of the gene array (Figure 1B), had not been reported in the context of MSC isolation.
Figure 1.
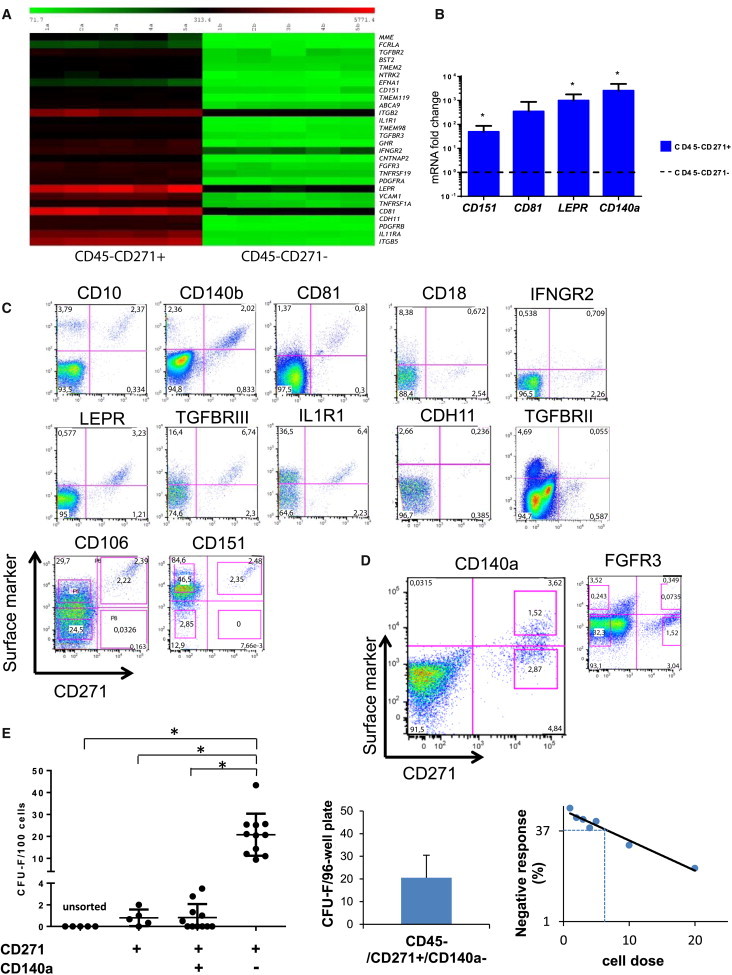
Gene Expression Analysis Identifies MSC Surface Markers of which CD140a Enables Isolation of a Highly Enriched CFU-F Population
(A) Heatmap of significantly upregulated surface molecule genes in lin−/CD45−/CD271+ versus lin−/CD45−/CD271− cells of five donors.
(B) Quantitative RT-PCR of lin−/CD45−/CD271− compared with CD271+ cells. Results are shown as mRNA fold change after standardizing with GAPDH levels. Data are from three individual experiments with duplicate measurements for each of the genes. ∗p < 0.05.
(C and D) Lineage depleted BM-MNCs were stained with antibodies as indicated and analyzed by flow cytometry. Representative plots of CD271 expression (x axis) versus expression of the indicated marker (y axis) are shown after forward-scatter/side-scatter gating, exclusion of dead cells (7-AAD), and gating on CD45-negative cells. Sorting gates are indicated in the CD106, CD151 (C), and CD140a and FGFR3 plots (D).
(E) CFU-F frequencies of primary lin−/CD45−/CD271+ BM cell populations sorted on CD140a expression. Data are presented as individual data (dots) from bulk sorting (left plot, n = 5–11 independent experiments with at least three replicates for each experiment), and three independent limiting dilution experiments with seven different cell concentrations for each experiment (right plot, each dot in the plot represents the average of the three experiments). Single cell sorting data were calculated from three independent experiment, and data are given as mean ± SD (middle plot). The sorting strategy is illustrated in Figure S3. ∗p < 0.05.
See also Figures S1 and S2 and Tables S1, S2, and S3.
Cell-Surface Expression Analysis of Potential MSC Markers on lin−/CD45−/CD271+ Cells
Next, protein expression was validated for those candidate surface markers for which antibodies were commercially available. Lin−/CD45−/CD271+ cells expressed high levels of CD10, CD140b, CD81, leptin receptor (LEPR), transforming growth factor beta receptor III (TGFBRIII), interleukin 1 receptor alpha (IL1R1), CD106, and CD151, while expression of CD18, interferon gamma receptor 2 (IFNGR2), cadherin-11 (CDH11), transforming growth factor beta receptor II (TGFBRII), CD140a, and fibroblast growth factor receptor 3 (FGFR3) was low/intermediate (Figures 1C and 1D). TNFR1 was the only candidate gene for which measurable protein expression levels were not detected (data not shown).
Most of the identified markers showed a staining pattern that paralleled CD271 expression; i.e., expression levels of the newly discovered marker increased with increasing CD271 levels (group I markers; Figure 1C). Therefore, these markers would not be expected to improve CFU-F enrichment in sorted CD271+ cells. Accordingly, experiments using CD151 as an example (Figure 1C, lower panel), demonstrated that CFU-F frequencies were not significantly different compared with isolation based on CD271 and other known MSC markers, such as CD106 (Figure 1C, lower panel; Figure S2A). As expected, sorted lin−/CD45−/CD271+/CD151+ cells showed all typical MSC properties in vitro (Figures S2A–S2F) and in vivo, i.e., formation of human MSC-derived bone, stroma invaded by murine hematopoietic cells, and an increase in vessel density (Figures S2G–S2I). LEPR is another group I marker that was recently reported to identify the majority of CFU-F in adult murine BM (Zhou et al., 2014). Our data showed that LEPR expression is conserved; i.e., that the majority of human adult CFU-F is contained in the LEPR+ fraction (Figure S2J).
Group II Marker CD140a, but Not FGFR3, Allows Isolation of a Close to Pure Population of CFU-F-Initiating Cells
On the other hand, CD140a and FGFR3 (group II markers) showed a more orthogonal staining pattern, allowing us to identify subpopulations of CD140a+, CD140alow/− and FGFR3+, FGFR3low/− cells, respectively (Figure 1D).
Whereas sorting based on FGFR3 expression did not improve CFU-F enrichment (data not shown), very high CFU-F frequencies were observed when CD271+ cells were sorted according to low/negative CD140a expression (Figure 1E). Mean CFU-F frequencies in bulk cultures seeded at clonal densities were as high as 20.8 ± 9.6 CFU-F per 100 cells in the CD140alow/− fraction compared with 0.8 ± 1.2 CFU-F per 100 plated CD140a+ cells and 0.8 ± 0.8 CFU-F per 100 plated CD271+ cells (Figure 1E, left graph). Similar results were obtained by single cell assays and limiting dilution analysis (Figure 1E, middle and right graphs, respectively). Considering that the high frequency of progenitor activity corresponds well to that reported for other immunophenotypically defined stem cell populations, such as HSCs, lin−/CD45−/CD271+/CD140alow/− cells are likely to represent a (close to) pure population of primary MSCs in human adult BM.
Recently, Mabuchi et al., (2013) reported comparable CFU-F frequencies by using a direct two-marker isolation approach (CD271, CD90). However, experiments in their study were performed with femoral bone fragments, which contain only few hematopoietic cells. In contrast, hematopoietically active BM as used in our study contains CD90+ hematopoietic cells, and CFU-F activity is also detected in CD90− cells (data not shown), which indicates that the CD271/CD90 two-marker approach is not suitable to enrich CFU-F from standard BM aspirations.
Primary lin−/CD45−/CD271+/CD140alow/− Cells Exhibit a Typical BM-MSC Phenotype and Give Rise to Typical Cultured MSCs
Cytospin preparations of lin−/CD45−/CD271+/CD140alow/− and CD140a+ cells showed a typical MSC morphology with cytoplasmic vacuoles and large, immature nuclei (Figure 2A). Furthermore, lin−/CD45−/CD271+/CD140alow/− cells expressed signature MSC markers, such as CD90, CD105, CD140b, and STRO-1 while lacking expression of CD31, CD34 (Figure 2B). As reported previously (Tormin et al., 2011), SSEA-4 and GD2 were not detected on primary BM-MSCs (Figure 2B), which might be due to differences in experimental protocols. Among lin−/CD45−/CD271+ cells, expression of pluripotency genes (Nanog, Oct4, Sox2) and cyclin-dependent kinase inhibitor gene p16 was higher in CD140alow/− than in CD140a+ cells (Figure 2C). Comparable gene expression was observed for differentiation genes (ALPL, PPARγ, ACAN), p21, and decoy receptor 2 (DCR2). Furthermore, short-term differentiation induction experiments (24 hr) increased expression of PPARγ and ACAN only in CD140alow/− MSCs but not in CD140+ cells (data not shown). Cell cycle distributions of CD140a+ and CD140alow/− cells were not significantly different, but a trend was observed toward more quiescent CD140a− cells (Figure 2D). These data indicate that CD140alow/− MSCs represent a distinct population of immature, quiescent stem/progenitor cells with multilineage potential.
Figure 2.
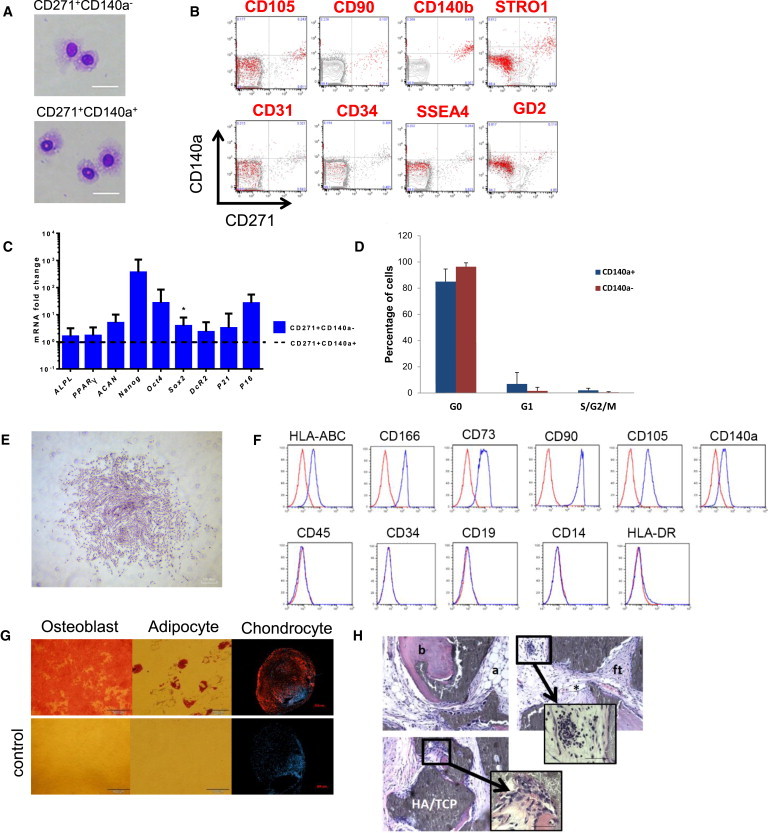
Properties of Primary and Cultured CD45−/CD271+/CD140alow/− Cells
(A) Cytospin preparations of CD45−/CD271+/CD140alow/− and CD45−/CD271+/CD140a+ cells (May-Grünwald/Giemsa staining). Scale bars represent 20 μm.
(B) FACS analysis of primary lin−/CD45− BM-MNC. Events are plotted for CD271 (x axis) against CD140a (y axis) expression. Red events indicate cells that coexpressed the marker listed on top, i.e., CD105, CD90, CD140b, STRO-1, CD31, CD34, SSEA4, and CD34, respectively, whereas gray events indicate lack of coexpression. One representative set of FACS plots of a total of three experiments is shown.
(C) Quantitative RT-PCR was performed on sorted lin−/CD45−/CD271+/CD140a+ and lin−/CD45−/CD271+/CD140alow/− cells. Results are shown as mRNA fold change after standardizing with GAPDH levels. Data are given as mean ± SD. Data are from three to eight individual experiments with duplicate measurements for each of the genes. ∗p < 0.05.
(D) Cell cycle analysis of the CD45−/CD271+/CD140alow/− and CD45−/CD271+/CD140a+ cells by KI67 and DNA staining (n = 3 independent experiments).
(E) Morphology of colonies derived from CD45−/CD271+/CD140alow/− cells (crystal violet staining). Scale bar represents 200 μm.
(F) Flow cytometric analysis of MSC marker expression of CD45−/CD271+/CD140alow/−-derived cultured stromal cells (blue line) and corresponding isotype controls (red line). A representative set of data of a total of three experiments is shown.
(G) In vitro differentiation capacity of stromal cells derived from bulk-sorted CD45−/CD271+/CD140alow/− cells toward the osteoblastic, adipogenic, and chondrogenic lineage (upper panel). Controls are shown in the lower panel. Scale bars represent 500 μm (osteoblast), 100 μm (adipocyte), and 200 μm (chondrocyte). A representative set of pictures from a total of three experiments is shown.
(H) Multiclonal cultures generated from CD45−/CD271+/CD140alow/− cells were transplanted subcutaneously (with HA/TCP particles) into NOD/SCID mice. Representative sections 8 weeks after transplantation are shown. Bone (b), adipocytes (a), fibroblastic tissue (ft), and capillaries (∗) are indicated (magnification 10×). Blowups are shown at 60× magnification. Invading hematopoietic cells (upper blowup) and megakaryocytes (lower blowup) could be detected. Scale bar represents 20 μm.
See also Figures S3 and S4 and Table S3.
Stromal cell cultures generated from sorted lin−/CD45−/CD271+/CD140alow/− cells (single-cell as well as bulk) were composed of typical adherent, spindle-shaped, fibroblastic-like cells (Figure 2E), with a typical MSC surface marker profile (Figure 2F). Interestingly, CD140a expression increased in culture, which might be influenced by cell attachment, cell density, and culture medium composition. Lin−/CD45−/CD271+/CD140a+ cells did not generate sufficient colonies for further studies. In contrast, CD140alow/−-derived cultured stromal cells demonstrated robust multilineage differentiation potential in vitro (Figure 2G). This was not only observed in multiclonal cultures from bulk-sorted cells, but also in single-cell-derived clones, of which 62%, 31%, and 7% exhibited trilineage, bilineage, and unilineage differentiation potential, respectively. Finally, in vivo differentiation potential was tested by subcutaneous implantation of lin−/CD45−/CD271+/CD140alow/−-derived cells into immunodeficient mice. In addition to bone, adipocytes, and stromal tissues, invading hematopoietic cells were clearly identified in the ectopic scaffolds (Figure 2H). These results thus demonstrate that CD140alow/− cells have the capacity to generate hematopoietic stroma in vivo, a key property of primary BM-MSCs (Sacchetti et al., 2007).
Hematopoiesis-Supporting Capacity of lin−/CD45−/CD271+/CD140alow/− Cells
We have recently shown that primitive BM-MSCs promote the ex vivo expansion of human umbilical cord blood (CB)-derived CD34+ cells (Isern et al., 2013). These results prompted us to assess the hematopoiesis-supporting capacity of lin−/CD45−/CD271+/CD140alow/− cells in coculture assays with CB CD34+ cells. CD34+ hematopoietic cells were evenly distributed and in close contact with the feeder cells only when cocultured with the lin−/CD45−/CD271+/CD140alow/− cells and their stromal derived progeny, i.e., cultured mesenchymal stroma cells (cMSCs) (Figures 3A and 3B). CD271−/CD140a+ cells did not form confluent feeder layers, and thus, CD34+ cocultures showed a similar distribution pattern as the nonfeeder cell cultures (Figure 3A).
Figure 3.
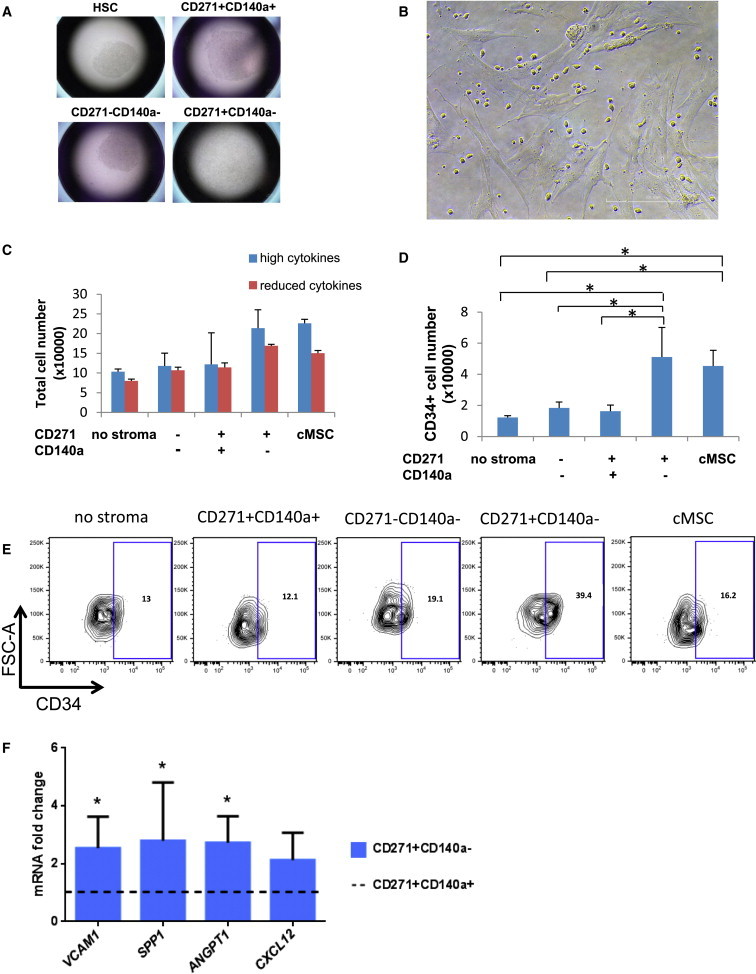
CD45−/CD271+/CD140alow/− Cells Promote the Ex Vivo Expansion of CB CD34+ Cells
(A) Representative pictures of individual culture wells. HSCs indicate well with CD34+ cells that were cultured without stromal support.
(B) Photomicrograph illustrating CB CD34+ coculture on CD45−/CD271+/CD140a low/− stromal cells. Scale bar represents 200 μm.
(C and D) Total number of hematopoietic cells (C) and CD34+ cells (D) produced after 1-week culture. Data are calculated from three individual experiments and provided as mean ± SD (n = 3). ∗p < 0.05.
(E) Representative FACS profile of coculture-generated cells.
(F) Quantitative RT-PCR of sorted lin−/CD45−/CD271+/CD140a+ and lin−/CD45−/CD271+/CD140alow/− cells. Results are shown as mRNA fold change after standardizing with GAPDH levels. Data are given as mean ± SD. Data are from three individual experiments with duplicate measurements for each of the genes. ∗p < 0.05.
CB CD34+ cells were cocultured for 1 week with CD45−/CD271+/CD140alow/−, CD45−/CD271+/CD140a+, CD45−/CD271−/CD140a− cells or standard cultured stromal cells (cMSCs). Cultures were supplemented with SCF, TPO, and Flt3L at concentrations of 25 or 100 ng/ml (reduced or high cytokines). See also Table S3.
One week coculture with lin−/CD45−/CD271+/CD140alow/− cells increased total cell production in cytokine-supported expansion cultures (Figure 3C), which was comparable with cMSC as feeder cells. Moreover, the number of CD34+ cells was the best in lin−/CD45−/CD271+/CD140alow/− supported cultures (Figure 3D), which showed a better preservation of the CD34+ phenotype compared with cMSC (Figure 3E). Correspondingly, lin−/CD45−/CD271+/CD140alow/− cells showed high expression of hematopoiesis-supporting genes (VCAM1, SPP1, CXCL12, and angiopoietin 1; Figure 3F). CD34+ cells expanded on lin−/CD45−/CD271+/CD140alow/− feeder cells or cMSCs were capable of efficient long-term hematopoietic multilineage reconstitution in immunodeficient mice (Figure 4).
Figure 4.
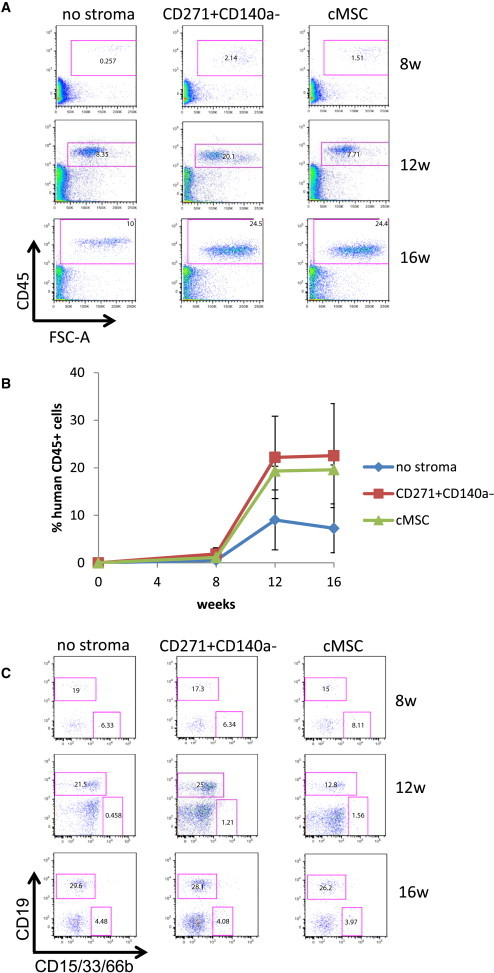
Engraftment Capacity of CB CD34+ Cells Ex Vivo Expanded on CD45−/CD271+/CD140alow/− Feeder Cells
Analysis of human hematopoietic cell engraftment following intravenous transplantation of the culture equivalent of 50,000 input CD34+ cells into NSG mice. CB blood CD34+ cells were cocultured for 1 week with or without feeder cells in cytokine-supplemented medium (SCF, TPO, Flt3L at 25 ng/ml). Engraftment was assessed after 8, 12, and 16 weeks using human-specific CD45 antibodies (A and B) and CD15/CD33/CD66 and CD19 antibodies (C). Representative FACS plots are shown. Data in (B) represent the mean ± SD of a total of four to six mice per time point.
CD140a, which is a long-known marker for murine MSCs, has only recently been reported as a positive marker to identify human fetal BM CFU-F-initiating cells (Pinho et al., 2013). However, adult BM cells are by far the most commonly used MSC source, and our data clearly demonstrate that MSCs are highly enriched within the CD140alow/− population but not in CD140+ cells. This distribution pattern is also observed in older adults, even though CFU-F frequencies in CD140alow/− cells are lower (Figure S4). On the other hand and consistent with previous work (Pinho et al., 2013), we found that fetal CD140a+ cells had an increased CFU-F frequency, clearly contrasting the results in adult BM cells. These data suggest that CD140a expression is progressively downregulated during development, which was also supported by examination of the CD140a expression of murine BM-MSCs at different developmental stages (Figure S4D).
Platelet-derived growth factor (PDGF) is a key signaling molecule in the complex bone formation process and a powerful mitogen and chemoattractant for MSCs, inducing proliferation as well as affecting directional mobility (Caplan and Correa, 2011). Increased PDGFR-α signaling in embryos leads to hyperplasia of stromal fibroblasts (Olson and Soriano, 2009). The MSC enrichment in the CD140a+ fraction during bone development and its progressive downregulation strongly suggest that it might be required for osteoprogenitor activity possibly also under pathological conditions, but our results suggest that this receptor may not necessarily be essential for the HSC niche function of BM-MSCs.
In summary, based on comparative gene expression analysis, we could demonstrate that low/negative expression of CD140a identified a close to pure population of the putative stromal stem/progenitor cells in human adult BM, which is likely to be a critical first step toward a better functional characterization of these important constituents of the hematopoietic microenvironment.
Experimental Procedures
BM Mononuclear Cells
A total of 111 BM samples were collected from 87 healthy adult donors (median age, 25 years; range 19–41) plus three additional older donors (52, 56, and 61 years). BM (60 ml) was aspirated from the iliac crest bone of consenting healthy donors. BM aspiration was approved by the local ethics committee. BM-MNCs were isolated by density gradient centrifugation (LSM 1077 Lymphocyte; PAA) with or without prior incubation with RosetteSep Human MSC Enrichment Cocktail (StemCell Technologies) for lineage depletion (CD3, CD14, CD19, CD38, CD66b, glycophorin A). The preparation of fetal BM cells is described in Figure S3.
Generation of Cultured MSCs and CFU-F Assays
Sorted BM-MNCs were cultured in standard MSC culture medium (NH Expansion Medium; Miltenyi Biosciences) and passaged as described (Tormin et al., 2011). CFU-F assays were performed as before (Tormin et al., 2011); a detailed description is provided in the Supplemental Experimental Procedures.
Microarray Expression Analysis
RNA from sorted cell populations was isolated, amplified, and analyzed for gene expression microarray analysis using Illumina Human HT-12 expression v4 BeadChips (Illumina). Detailed experimental procedures and data analysis are described in the Supplemental Experimental Procedures.
Fluorescence-Activated Cell Sorting
Lineage-depleted BM-MNCs were incubated in blocking buffer (Dulbecco’s PBS [DPBS] without Ca2+, Mg2+, 3.3 mg/ml human normal immunoglobulin [Octapharma], 1% fetal bovine serum [Life Technologies]), followed by staining with monoclonal antibodies against CD45, CD151, CD140a, and CD271 (for detailed information on all antibodies used in this study, please see the Supplemental Experimental Procedures). Sorting gates were set according to the corresponding fluorescence-minus-one controls. Cells were sorted on fluorescence-activated cell sorting (FACS) Aria I or FACS Aria III cell sorters (BD Bioscience). Dead cells were excluded by 7-amino-actinomycin staining (7-AAD; Sigma), and doublets were excluded by gating on forward scatter height versus forward scatter width and side scatter height versus side scatter width. Flow cytometry analysis is described in the Supplemental Experimental Procedures.
In Vitro Differentiation Assays
Cultured MSCs were differentiated toward the adipogenic, osteoblastic, and chondrogenic lineages as described previously (Tormin et al., 2011). Briefly, cells were cultured for 14 days in AdipoDiff medium (Miltenyi) and were stained with Oil red O (Sigma). For osteogenic differentiation, cells were cultured in osteogenesis induction medium (see the Supplemental Experimental Procedures) for 21 days and stained with alizarin red (Sigma). Chondrogenic differentiation was induced by culturing cell pellets (2.5 × 10⁵ cells/pellet) for 56 days in chondrogenesis-induction medium (see the Supplemental Experimental Procedures). Cryosections of paraformaldehyde-fixed pellets were stained against aggrecan as described previously (Tormin et al., 2011). Nuclei were stained with 4′,6-diamidino-2-phenylindole (Life Technologies). Sections were analyzed with an Axiovert 200M fluorescence microscope and an AxioCam HRm (both from Carl Zeiss).
Quantitative RT-PCR
RNA from sorted lin−/CD45−/CD271+/CD140alow/− and lin−/CD45−/CD271+/CD140a+ and lin−/CD45−/CD271+/CD151+ populations was isolated from at least three individual donors. cDNA was synthesized and quantitative RT-PCR analysis was performed (for more details and primers, see Supplemental Experimental Procedures and Table S3).
In Vivo Bone and Stroma Assay
For analysis of in vivo bone and stroma formation, cells were culture derived from sorted CD45−/CD271+/CD140alow/− and CD45−/CD271+/CD151+ cells from three different donors. Cells were loaded overnight on hydroxyapatite/tricalcium phosphate (HA/TCP) ceramic powder and implanted subcutaneously into 8-week-old female nonobese diabetic/severe combined immunodeficiency (NOD/SCID) mice (5 × 10⁵ cells, four implants per culture). Implants were removed after 8 weeks, fixed, decalcified, and paraffin embedded. Sections were stained with hematoxylin/eosin and analyzed as described (Abdallah et al., 2008). All animal procedures were approved by the local ethical committees on animal experiments.
CD34+ Cells Isolation from CB
Umbilical CB samples were obtained from full-term, normal deliveries with informed consent in accordance with institutional guidelines and as approved by the local ethical committee. Isolation and enrichment of CD34+ cells from CB samples were carried out on mononuclear cells by magnetic-activated cells sorting (Miltenyi) according to manufacturer’s instructions. Cells were subsequently frozen in freezing buffer (90% fetal calf serum plus 10% DMSO).
Coculture of CB CD34+ Cells with BM-MSCs
Different FACS-sorted primary BM stromal cell populations or culture-derived MSCs (third or fourth passage) were plated into 96-well plates at 1,000 cells per well and cultured in nonhematopoietic medium for 7–10 days. Then medium was removed, and 5,000 CB CD34+ cells were added onto the adherent stromal cells in serum-free expansion medium (StemCell Technologies) supplemented with 25 or 100 ng/ml of stem cell factor (SCF), thrombopoietin (TPO), and FLT3-ligand (FLT3L) (all from Peprotech). Cells were harvested, counted, and analyzed after 1 week of coculture.
In Vivo HSC Repopulation Assay
Eight- to 12-week old female NOD.Cg-PrkdcscidIl2rgtmlWjl/SzJ (NOD/SCID-IL2Rγc null; NSG) mice (Jackson Laboratory) were sublethally irradiated (300 cGy) 24 hr prior to transplantation. CB CD34+ cells were cultured for 1 week in cytokine-supported serum-free medium (25 ng/ml of SCF, TPO, and FLT3L) with or without feeder cells (no cells, short-term cultured CD45−/CD271+/CD140alow/− cells, or fourth passage cultured MSCs, respectively). Noncultured CB CD34+ cells served as an additional control. The culture equivalent of 50,000 input CD34+ cells was intravenously injected, and human engraftment was assessed 8, 12, and 16 weeks after transplantation by flow cytometry (human-specific antibodies against CD45, CD15/CD33/CD66b, and CD19). All animal experiments were approved by local animal ethics committee, Lund University.
Statistical Analysis
Data are expressed as mean ± SD. For a comparison of two samples, the two-tailed Student’s t test was used. For multiple comparisons, data were analyzed by one-way ANOVA using the Bonferroni posttest. Differences are reported significant when p < 0.05.
Acknowledgments
This work was supported by funds from the Swedish Research Council (VR), the HematoLinné and StemTherapy Program, the Swedish Cancer Foundation, the Swedish Childhood Cancer Foundation, Gunnar Nilsson’s Cancer Foundation, Gunnel Björk’s Testament, ALF (Government Public Health Grant), and the Skåne County Council’s Research Foundation. The authors thank Helene Larsson for help with the BM samples and the Lund Stem Cell Center FACS facility for excellent technical assistance.
Footnotes
This is an open access article under the CC BY-NC-ND license (http://creativecommons.org/licenses/by-nc-nd/3.0/).
Supplemental Information
References
- Abdallah B.M., Ditzel N., Kassem M. Assessment of bone formation capacity using in vivo transplantation assays: procedure and tissue analysis. Methods Mol. Biol. 2008;455:89–100. doi: 10.1007/978-1-59745-104-8_6. [DOI] [PubMed] [Google Scholar]
- Battula V.L., Treml S., Abele H., Bühring H.J. Prospective isolation and characterization of mesenchymal stem cells from human placenta using a frizzled-9-specific monoclonal antibody. Differentiation. 2008;76:326–336. doi: 10.1111/j.1432-0436.2007.00225.x. [DOI] [PubMed] [Google Scholar]
- Bühring H.J., Battula V.L., Treml S., Schewe B., Kanz L., Vogel W. Novel markers for the prospective isolation of human MSC. Ann. N.Y. Acad. Sci. 2007;1106:262–271. doi: 10.1196/annals.1392.000. [DOI] [PubMed] [Google Scholar]
- Caplan A.I., Correa D. PDGF in bone formation and regeneration: new insights into a novel mechanism involving MSCs. J. Orthop. Res. 2011;29:1795–1803. doi: 10.1002/jor.21462. [DOI] [PubMed] [Google Scholar]
- Churchman S.M., Ponchel F., Boxall S.A., Cuthbert R., Kouroupis D., Roshdy T., Giannoudis P.V., Emery P., McGonagle D., Jones E.A. Transcriptional profile of native CD271+ multipotential stromal cells: evidence for multiple fates, with prominent osteogenic and Wnt pathway signaling activity. Arthritis Rheum. 2012;64:2632–2643. doi: 10.1002/art.34434. [DOI] [PubMed] [Google Scholar]
- Friedenstein A.J., Chailakhjan R.K., Lalykina K.S. The development of fibroblast colonies in monolayer cultures of guinea-pig bone marrow and spleen cells. Cell Tissue Kinet. 1970;3:393–403. doi: 10.1111/j.1365-2184.1970.tb00347.x. [DOI] [PubMed] [Google Scholar]
- Gronthos S., Zannettino A.C., Hay S.J., Shi S., Graves S.E., Kortesidis A., Simmons P.J. Molecular and cellular characterisation of highly purified stromal stem cells derived from human bone marrow. J. Cell Sci. 2003;116:1827–1835. doi: 10.1242/jcs.00369. [DOI] [PubMed] [Google Scholar]
- Isern J., Martín-Antonio B., Ghazanfari R., Martín A.M., López J.A., del Toro R., Sánchez-Aguilera A., Arranz L., Martín-Pérez D., Suárez-Lledó M. Self-renewing human bone marrow mesenspheres promote hematopoietic stem cell expansion. Cell Rep. 2013;3:1714–1724. doi: 10.1016/j.celrep.2013.03.041. [DOI] [PubMed] [Google Scholar]
- Keating A. Mesenchymal stromal cells: new directions. Cell Stem Cell. 2012;10:709–716. doi: 10.1016/j.stem.2012.05.015. [DOI] [PubMed] [Google Scholar]
- Mabuchi Y., Morikawa S., Harada S., Niibe K., Suzuki S., Renault-Mihara F., Houlihan D.D., Akazawa C., Okano H., Matsuzaki Y. LNGFR(+)THY-1(+)VCAM-1(hi+) Cells Reveal Functionally Distinct Subpopulations in Mesenchymal Stem Cells. Stem Cell Rep. 2013;1:152–165. doi: 10.1016/j.stemcr.2013.06.001. [DOI] [PMC free article] [PubMed] [Google Scholar]
- Méndez-Ferrer S., Michurina T.V., Ferraro F., Mazloom A.R., Macarthur B.D., Lira S.A., Scadden D.T., Ma’ayan A., Enikolopov G.N., Frenette P.S. Mesenchymal and haematopoietic stem cells form a unique bone marrow niche. Nature. 2010;466:829–834. doi: 10.1038/nature09262. [DOI] [PMC free article] [PubMed] [Google Scholar]
- Olson L.E., Soriano P. Increased PDGFRalpha activation disrupts connective tissue development and drives systemic fibrosis. Dev. Cell. 2009;16:303–313. doi: 10.1016/j.devcel.2008.12.003. [DOI] [PMC free article] [PubMed] [Google Scholar]
- Pinho S., Lacombe J., Hanoun M., Mizoguchi T., Bruns I., Kunisaki Y., Frenette P.S. PDGFRα and CD51 mark human nestin+ sphere-forming mesenchymal stem cells capable of hematopoietic progenitor cell expansion. J. Exp. Med. 2013;210:1351–1367. doi: 10.1084/jem.20122252. [DOI] [PMC free article] [PubMed] [Google Scholar]
- Raaijmakers M.H., Mukherjee S., Guo S., Zhang S., Kobayashi T., Schoonmaker J.A., Ebert B.L., Al-Shahrour F., Hasserjian R.P., Scadden E.O. Bone progenitor dysfunction induces myelodysplasia and secondary leukaemia. Nature. 2010;464:852–857. doi: 10.1038/nature08851. [DOI] [PMC free article] [PubMed] [Google Scholar]
- Sacchetti B., Funari A., Michienzi S., Di Cesare S., Piersanti S., Saggio I., Tagliafico E., Ferrari S., Robey P.G., Riminucci M., Bianco P. Self-renewing osteoprogenitors in bone marrow sinusoids can organize a hematopoietic microenvironment. Cell. 2007;131:324–336. doi: 10.1016/j.cell.2007.08.025. [DOI] [PubMed] [Google Scholar]
- Tormin A., Li O., Brune J.C., Walsh S., Schütz B., Ehinger M., Ditzel N., Kassem M., Scheding S. CD146 expression on primary nonhematopoietic bone marrow stem cells is correlated with in situ localization. Blood. 2011;117:5067–5077. doi: 10.1182/blood-2010-08-304287. [DOI] [PMC free article] [PubMed] [Google Scholar]
- Zhou B.O., Yue R., Murphy M.M., Peyer J.G., Morrison S.J. Leptin-receptor-expressing mesenchymal stromal cells represent the main source of bone formed by adult bone marrow. Cell Stem Cell. 2014;15:154–168. doi: 10.1016/j.stem.2014.06.008. [DOI] [PMC free article] [PubMed] [Google Scholar]
Associated Data
This section collects any data citations, data availability statements, or supplementary materials included in this article.