

Abstract
Production of bioluminescence theoretically represents a cost, energetic or otherwise, that could slow Vibrio fischeri growth; however, bioluminescence is also thought to enable full symbiotic colonization of the Euprymna scolopes light organ by V. fischeri. Previous tests of these models have proven inconclusive, partly because they compared nonisogenic strains, or undefined and/or pleiotropic mutants. To test the influence of the bioluminescence-producing lux operon on growth and symbiotic competence, we generated dark ΔluxCDABEG mutants in strains MJ1 and ES114 without disrupting the luxR-luxI regulatory circuit. The MJ1 ΔluxCDABEG mutant out-competed its visibly luminescent parent ~26% per generation in a carbon-limited chemostat. Similarly, induction of luminescence in the otherwise dim ES114 strain slowed growth relative to ΔluxCDABEG mutants. Some culture conditions yielded no detectable effect of luminescence on growth, indicating that luminescence is not always growth limiting; however, luminescence was never found to confer an advantage in culture. In contrast to this conditional disadvantage of lux expression, ES114 achieved ~4-fold higher populations than its ΔluxCDABEG mutant in the light organ of E. scolopes. These results demonstrate that induction of luxCDABEG can slow V. fischeri growth under certain culture conditions and is a positive symbiotic colonization factor.
Keywords: Photobacterium, Aliivibrio, autoinduction, competition, evolution
Introduction
Vibrio fischeri serves as a model system for studies of both bioluminescence and symbiotic bacteria-animal interactions. This bacterium’s bioluminescence has been examined since the late 19th century (Harvey 1952), whereas studies of V. fischeri’s symbiotic interactions have gained recent momentum from the ability to reconstitute its symbiosis with the Hawaiian bobtail squid Euprymna scolopes in the laboratory (Wei and Young 1989; Stabb 2006). V. fischeri’s bioluminescence and symbiotic interactions are intimately interrelated. For example, the most obvious symbiotic role of V. fischeri is to generate bioluminescence in specialized light emitting organs of hosts, and bioluminescence is induced upon colonization – an effect that is particularly pronounced in symbionts of E. scolopes (Boettcher and Ruby 1990; Boettcher and Ruby 1995). Most interestingly, Visick et al. (2000) reported that bioluminescence acts as a colonization factor, and that without it V. fischeri does not fully colonize E. scolopes. Unfortunately, the parent strain used in that study was subsequently found to be attenuated in colonization (McCann et al. 2003), and we have now shown that the mutation yielding the dark phenotype also caused unexpected and negative pleiotropic effects. Thus, this role of bioluminescence as a symbiosis-specific colonization factor could be questioned.
If bioluminescence does enable V. fischeri to fully colonize the host, this would be especially interesting juxtaposed the seemingly paradoxical belief that bioluminescence has a negative impact on cells. This is a controversial topic with a long history. By the early 1890’s Beijerinck and others observed dark mutants arising after prolonged culturing, leading to speculation that the energy devoted to bioluminescence in wild-type strains might actually hinder growth or survival (for a review see (Harvey 1952)). In support of luminescence representing an energetic drain, growth in culture has been negatively correlated to luminescence, with relatively dark strains reportedly outgrowing brighter ones (Keynan and Hastings 1961; Hastings and Nealson 1977; Dunlap et al. 1995; Czyz et al. 2003; Pooley et al. 2004). On the other hand, one especially thorough study detected no effect of luminescence on ATP pools or growth (Karl and Nealson 1980). These reports and the discrepancies between them are difficult to interpret because they compared non-isogenic strains, induced both luminescence and non-target genes, or used undefined or pleiotropic lux mutants.
Although this topic remains unresolved, hypotheses predicting positive or negative effects of bioluminescence on V. fischeri can draw on a firm understanding of the biochemistry and genetics underlying this process (Hastings and Nealson 1977; Meighen 1994; Tu and Mager 1995). Bioluminescence results when luciferase, comprised of LuxA and LuxB, converts FMNH2, O2, and an aliphatic aldehyde (RCHO) to FMN, water, and an aliphatic acid. LuxC, LuxD, and LuxE (re)generate RCHO (Boylan et al. 1989), consuming additional reductant and hydrolyzing ATP, while LuxG and other flavin reductases regenerate FMNH2 (Zenno and Saigo 1994; Lin et al. 1998). The genes encoding these Lux proteins are co-transcribed with luxI, and the luxICDABEG operon is adjacent to and divergently transcribed from luxR (Engebrecht et al. 1983; Gray and Greenberg 1992b; Gray and Greenberg 1992a). Together LuxI and LuxR form a “quorum sensing” regulatory circuit that induces bioluminescence at high cell density (Fuqua et al. 1994).
In light of this detailed mechanistic understanding, any potential functional advantages of bioluminescence for light-producing bacteria must be weighed against apparently significant energetic costs (Stabb 2005). In this context, “bioluminescence” refers to the complete process of generating light, encompassing not only the emission of photons but also the synthesis of Lux proteins and their enzymatic activities concomitant with light production. There are at least three potential mechanisms of energy loss: (i) GTP hydrolysis devoted to Lux protein synthesis, (ii) ATP hydrolysis associated with regeneration of aldehyde substrate, and (iii) consumption of reducing power and oxygen without coupling this to the generation of a proton motive force to recover energy. The latter mechanism, which amounts to competition between luminescence and energy-generating respiratory pathways, has gained support from the observation that luminescence consumes a significant (>10%) share of the oxygen reduced in V. fischeri cells (Makemson 1986). As discussed below, hypotheses explaining potential symbiotic advantages of producing bioluminescence have also drawn on our understanding of the biochemistry underlying this process.
Our goal in this study was to test the effect of bioluminescence on V. fischeri and answer several longstanding questions: Can bioluminescence slow the growth of V. fischeri in culture under any circumstance? If so, is this always true or is it conditional? Finally, could we confirm the report by Visick et al. (2000) that luminescence is a positive colonization factor for V. fischeri cells colonizing the light organ of the Hawaiian bobtail squid, Euprymna scolopes? Our use of ΔluxCDABEG mutants and strains where luxCDABEG are specifically inducible enabled us to answer these questions.
Materials and Methods
Bacteria and media
Bacterial strains, plasmids, and oligonucleotides used in this study are described in Table 1. Plasmids were maintained in Escherichia coli strain DH5α, except plasmids containing the R6Kγ origin of replication, which were maintained in CC118λpir or DH5αλpir. E. coli was grown at 37°C in LB medium (Miller 1992) or Brain Heart Infusion (BHI) (Becton, Dickinson, and Co, Sparks Maryland). V. fischeri was grown in one of four media types: SWT, which contained 5 g of tryptone, 3 g of yeast extract, 3 ml of glycerol, and 700 ml of Instant Ocean (Aquarium Systems, Mentor, Ohio) per liter; SWTO, which was prepared by adding 170 mM NaCl to SWT to achieve an osmolarity near that of seawater; LBS, which contained, per liter of water, 10 g of tryptone, 5 g of yeast extract, 20 g of NaCl, and 50 mM Tris (pH 7.5); or BGMYE (modified from (Rosson and Nealson 1981)), which contained 940 ml Instant Ocean, 50 mM Tris (pH 7.5), 19 mM NH4Cl, 0.03% glycerol, 7 μM FeSO4-7H2O, 570 μM K2HPO4, and 10 mg yeast extract per liter. In most experiments we used SWTO, because we previously found that luminescence of V. fischeri was enhanced by its seawater-like osmolarity (Stabb et al. 2004). Agar (15 mg ml−1) was added to solidify media for plating experiments. When added to LB medium for selection of E. coli, ampicillin, chloramphenicol, and kanamycin were used at concentrations of 100, 20 and 40 μg ml−1, respectively. E. coli was grown on BHI medium for selection of resistance to 150 μg ml−1 erythromycin.
Table 1.
Bacterial strains, plasmids, and oligonucleotides
| Strain, plasmid(s), or oligonucleotide | Relevant characteristicsa | Source or reference |
|---|---|---|
| V. fischeristrains | ||
| ES114 | wild-type isolate from Euprymna scolopes | (Boettcher and Ruby 1990) |
| ESR1 | spontaneous rifR derivative of ES114 | (Graf et al. 1994) |
| EVS100 | ES114 ΔluxA::ermR (allele exchanged from pEVS139) | this study |
| EVS101 | ES114 luxR::ermR lacIq Ptac-luxI-luxCDABEG (allele exchanged from pEVS137) | (Stabb et al. 2004) |
| EVS102 | ES114 ΔluxCDABEG (allele exchanged from pEVS153) | this study |
| EVS103 | MJ1 ΔluxCDABEG (allele exchanged from pEVS165) | this study |
| JB22 | ES114 lacIq PA1/34-luxCDABEG (allele exchanged from pJLB101) | this study |
| JB23 | ES114 lacIq PA1/34-Δ luxCDABEG (allele exchanged from pJLB102) | this study |
| MJ1 | wild-type isolate from Monocentris japonica | (Ruby and Nealson 1976) |
| Plasmids | ||
| pCR-BluntII-TOPO | PCR-product cloning vector; ColE1 oriV, kanR | Invitrogen |
| pEVS79 | ColE1 oriV, oriTRP4, chmR | (Stabb and Ruby 2002) |
| pEVS94S | R6Kγ oriV, oriTRP4, ermR | (Stabb and Ruby 2002) |
| pEVS104 | R6Kγ oriV, kanR RP4-derived conjugative plasmid | (Stabb and Ruby 2002) |
| pEVS118 | R6Kγ oriV, oriTRP4, chmR | (Dunn et al. 2005) |
| pEVS137 | KpnI-digested pEVS118 in pKV44 KpnI site | this study |
| pEVS139 | BglII-digested pEVS118 in Bam HI-BglII-digested pKV17 | this study |
| pEVS141 | P15A oriV, kanR | (Dunn et al. 2006) |
| pEVS143 | lacIq, Ptac XhoI cassette (Diederich et al. 1994) in SalI- digested pEVS141 | this study |
| pEVS147 | PCR product (primers Lux1 and Lux2, ES114 template) in pCR-BluntII-TOPO | this study |
| pEVS148K | PCR product (primers Lux3 and Lux4, ES114 template) in pCR-BluntII-TOPO; Kpn I digest, self ligated | this study |
| pEVS149K | PCR product (primers Lux5 and Lux6, ES114 template) in pCR-BluntII-TOPO; Kpn I digest, self-ligated | this study |
| pEVS151 | pEVS118 SpeI-AvrII in pEVS147 SpeI/NheI sites; BamH I digested, filled, self-ligated | this study |
| pEVS153 | NotI-digested pEVS151 fused with NotI-digested pEVS149K; ApaI digest, self-ligate; ΔluxCDABEG and flanking sequence from ES114 | this study |
| pEVS162 | PCR product (primers Lux5 and Lux6), MJ1 template, in pCR-BluntII-TOPO | this study |
| pEVS163 | pEVS162 PstI-KpnI fragment in pEVS94S PstI/KpnI sites | this study |
| pEVS165 | NotI-digested pJLB62 fused with NotI-digested pEVS163, ΔluxCDABEG and flanking sequence from MJ1 | this study |
| pJLB62 | PCR product (primers Lux1 and Lux2MJ1, MJ1 template) in SmaI-digested pEVS79 | this study |
| pJLB72 | NotI-digested pEVS151 fused with NotI-digested pEVS148K; ApaI digest, self-ligate; linker inserted between ES114 luxI and luxC | this study |
| pJLB97 | lacIq PCR product (primers EVS116 and EVS117, pEVS143 template) in pCR-BluntII-TOPO; NotI digest, self-ligate; oligo1 and oligo2 annealed, and ligated into EcoRI and SpeI sites, forming the PA1/34promoter b | this study |
| pJLB101 | pJLB97 lacIq-PA1/34 BamHI-NotI fragment in pJLB72, lacIq-PA1/34-luxCDABEG | this study |
| pJLB102 | pJLB97 lacIq-PA1/34 BamHI-NotI fragment in pEVS153, lacIq-PA1/34-ΔluxCDABEG | this study |
| pKV44 | ColE1 oriV, ampR, luxR::ermR-lacIq-Ptac::luxI− and flanking sequence from ES114 | (Visick et al. 2000) |
| pKV17 | ColE1 oriV, ampR, ΔluxA::ermR and flanking sequence from ES114 | (Visick and Ruby 1996) |
| pVSV3 | pES213 oriV, kanR, lacZ (full), oriTRP4 | (Dunn et al. 2006) |
| Oligonucleotidesc | ||
| EVS116 | GAG GCG GCC GCC TCG GTT CAA AGA GTT GGT AGC TCA GAG | this study |
| EVS117 | CCG TGC AGT CGA TAA GCC CGG ATC AGC TTG C | this study |
| Lux1 | GGG GTC TAG AGC TTT AGA AAT ACT TTG GCA GCG G | this study |
| Lux2 | GGA TCC GCT AGC GCG GCC GCC TAA CTA TAT GTA TTA TGT TCG AG | this study |
| Lux2MJ1 | GGA TCC GCT AGC GCG GCC GCC TTA GTA TTT AAA ATA AAT TAA TG | this study |
| Lux3 | GCG GCC GCG CTA GCG GAT CCT AGG GGA AAT AAT GAT TAA ATG TAT TCC G | this study |
| Lux4 | GGG GGG TAC CAA TTT GTC TTC TTC TAA GTA ACG CG | this study |
| Lux5 | GCG GCC GCG CTA GCG GAT CCG CCG ATG CTT TTG CAT ACA TAT AAA GAG | this study |
| Lux6 | GGG GGG TAC CCC AAC AAT GGC ATA AGC CCC CAC AGT CG | this study |
| Lux7 | GTC ATC GCA TTG GTG ATA AGG AG | this study |
| Lux9 | AGA CTT CTT ATC TCG TTG GGG TG | this study |
| Oligo1 | AAT TTT TAT CAA AAA GAG TGT TGA CTT GTG AGC GGA TAA CAA TGA TAC TTA GAT TCA ATT GTG AGC GGA TAA CAA TTT CAC ACA G | this study |
| Oligo2 | CTA GCT GTG TGA AAT TGT TAT CCG CTC ACA ATT GAA TCT AAG TAT CAT TGT TAT CCG CTC ACA AGT CAA CAC TCT TTT TGA TAA A | this study |
Drug resistance abbreviations used: ampR, ampicillin resistance (bla); chmR, chloramphenicol resistance (cat); ermR, erythromycin resistance; kanR, kanamycin resistance (aph); and rifR, rifampicin resistance.
Derived from the phage T7 A1 promoter by placing lac operators at the transcriptional start and between −10 and −35 elements, the PA1/34 promoter is a hybrid of PA1/03 and PA1/04 promoters (Lanzer and Bujard 1988).
Oligonucleotide sequences are provided in the 5′-3′ orientation.
When added to LBS medium for selection in V. fischeri, chloramphenicol, erythromycin, and kanamycin were used at concentrations of 2, 5, 100 μg ml−1, respectively. Isopropyl-β-D-thiogalactoside (IPTG), 5-bromo-4-chloro-3-indolyl-β-D-galactoside (X-Gal), and N-3-oxo-hexanoyl homoserine lactone (3-oxo-C6-HSL) were added to media at final concentrations of 2 mM, 120 μM, and 1 μM, respectively.
Genetic techniques and analyses
We generated plasmids using standard molecular cloning techniques. Klenow fragment, DNA ligase, and restriction enzymes were obtained from New England Biolabs (Beverly, Mass.), and oligonucleotides were synthesized by Integrated DNA Technologies (Coralville, Iowa). Specifics of plasmid construction are outlined in Table 1. Plasmids were purified using Qiagen Mini-prep kits (Qiagen Inc., Valencia Calif.), and DNA was recovered from restriction and ligation reactions with the DNA Clean and Concentrator-5 Kit (Zymo Research, Orange, Calif.). We used the ZeroBlunt-TOPO PCR Cloning Kit (Invitrogen, Carlsbad, Calif.) to clone PCR products into pCR-BluntII-TOPO. PCR was performed with an iCycler (BioRad Laboratories, Hercules, Calif.) using KOD HiFi DNA Polymerase (Novagen, Madison, Wisc.). In addition to using a high-fidelity polymerase, we sequenced the cloned PCR products to ensure that unintended base-pair alterations were not incorporated into our constructs. DNA sequencing was conducted at the University of Georgia Molecular Genetics Instrumentation Facility or at the University of Michigan DNA sequencing Core Facility, and sequences were compared using Sequencher 4.1.2 (Gene Codes Corp., Ann Arbor, Mich) and DNA Strider.
The construction of mutant alleles is described below and in more specific detail in Table 1. We used previously described luxR::ermR-lacIq-Ptac::luxI- and ΔluxA::ermR alleles on pKV44 (Visick and Ruby 1996) and pKV17 (Visick et al. 2000), respectively, by adding mobilization origins to these plasmids. Our strategy to generate each ΔluxCDABEG allele was to amplify a 1.5-kb fragment containing luxI and part of luxR and fuse this to an amplified 1.5-kb fragment containing sequences downstream of luxG, such that a small linker region replaced the luxCDABEG genes in an otherwise normal gene arrangement. Because of sequence differences between MJ1 and ES114, two separate strain-specific constructs were generated. The luxI gene upstream from luxC and the transcriptional terminator downstream of luxG were unaltered in these constructs. To place the luxCDABEG genes under control of an inducible promoter without disrupting luxI or luxR, a cassette consisting of three transcriptional terminators, lacIq, and a LacIq-controlled promoter designated PA1/34 was cloned between luxI and luxC in pJLB101. As a control, the same cassette was cloned downstream of luxI in a ΔluxCDABEG mutant generating construct pJLB102. The alleles on pJLB101 and pJLB102 were then exchanged onto the V. fischeri chromosome as described below.
Mutant alleles were transferred to V. fischeri from E. coli by triparental mating using conjugative helper plasmid pEVS104 (Stabb and Ruby 2002). Recombinational marker exchange was scored by screening for the appropriate antibiotic-resistance and/or luminescence phenotypes, and was confirmed by PCR. The mutant allele from ΔluxCDABEG strain EVS102 was PCR amplified, cloned, and sequenced to confirm the marker exchange method. The mutant alleles on plasmids pEVS137 (luxR::ermR-lacIq-Ptac::luxI-), pEVS139 (ΔluxA::ermR), pEVS153 (ΔluxCDABEG), pJLB101 (lacIq-PA1/34-luxC), and pJLB102 (lacIq-PA1/34-Δlux) were crossed into the genome of ES114 to generate mutants EVS101, EVS100, EVS102, JB22 and JB23, respectively. The ΔluxCDABEG allele on pEVS165 was crossed into the MJ1 genome to generate mutant EVS103. The genotypes of these strains are illustrated in Figure 1.
Fig. 1.
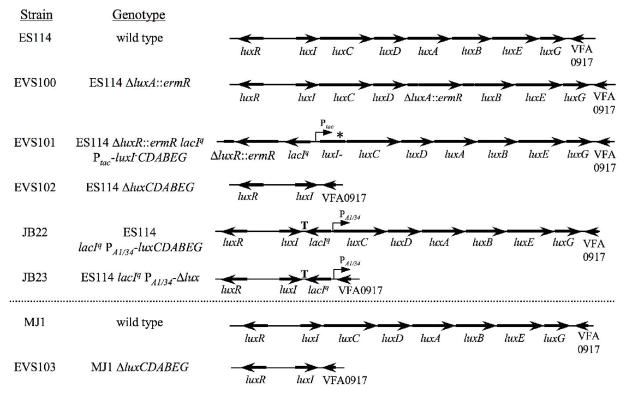
Schematic representation of chromosomal gene organization in lux mutants. Black arrows indicate the direction of transcription of lux or other genes. An asterisk denotes location of a frame-shifting 4-bp insertion in strain EVS101 resulting in a non-functional LuxI. “T” indicates where three bidirectional transcriptional terminators were added between luxI and lacIq in strains JB22 and JB23.
Growth, OD595, and luminescence measurements
Unless noted otherwise, overnight cultures were diluted 1:1000 in 50 ml of SWTO in 250-ml flasks and incubated at 24°C with shaking (200 rpm). 500-μl samples were taken from two or three parallel cultures at regular intervals and optical density at 595 nm (OD595) was determined on these undiluted samples with a BioPhotometer (Brinkman Instruments, Westbury, NY). The OD595 of undiluted samples diverges somewhat from a linear relationship with cell density, leading to an underestimation of cell density that becomes more pronounced at higher OD595 (e.g. OD595 >1). For example, an undiluted culture with an OD595 of 2.0 when diluted and measured in the linear range has an actual OD595 of ~2.4. We compared the OD595 of cultures grown in SWTO at 24°C before and after ten-fold dilution, and found that the relationship between measured OD595 of an undiluted culture (X) and the OD595 calculated from diluted culture (Y) can be described as Y=0.042X3 + 0.02X2 + X (r2=0.98). We used this conversion to calculate the OD595 values presented (and those used in growth rate calculation) from values taken on undiluted samples. Strain comparisons are not affected by this conversion, nor are any of our conclusions altered.
We calculated growth rate (min per OD595 doubling) by plotting log(OD595) as a function of time and determining the slope of the best-fit line through a particular time point and the two flanking data points. Relative luminescence was determined using a TD-20/20 or TD-20/20n luminometer (Turner Designs, Sunnyvale, Calif.), immediately after vigorous shaking to oxygenate the sample. Each luminescence value was determined by integration over a 10 sec measurement, and kinetic analyses of a dense (OD595=3) bright culture of strain MJ1 for several consecutive 1 sec measurements indicated that there was no significant decay in luminescence over a >10 sec period. Moreover, diluting this culture sample ten fold results in a ~ten-fold reduction in the luminescence reading, further suggesting that high density samples do not become self-limiting by consuming oxygen over the course of these measurements.
Mixed-strain competitions
To determine the relative competitiveness of EVS103 (ΔluxCDABEG) in batch co-culture with its parent MJ1, we used methodology similar to that described previously (Stabb and Ruby 2003; Dunn et al. 2006; Hussa et al. 2007). The two strains were incubated at 24°C with shaking (200 rpm) in 10 ml of SWTO in 125-ml flasks until reaching an OD595 of ~2.4. At this point, designated generation 0, aliquots of the cultures were plated, the cultures were diluted 4-fold, re-grown through two generations to re-achieve an OD595 of ~2.4, and plated again. This procedure of dilution and re-growth to starting OD595 was repeated for later generations. Plates were incubated overnight, at least 200 colonies were patched onto solid media, and the patches were scored for luminescence after overnight incubation to determine the ratio of EVS103 to MJ1. The ratio of EVS103 to MJ1 at each generation was divided by this ratio at generation 0 to determine the relative competitive index (RCI).
To determine the competitiveness of EVS103 relative to MJ1 in a carbon-limited chemostat, a mix of the two strains was pre-grown at 24°C with shaking (200 rpm) in 25 ml of BGMYE in baffled 125-ml flasks until reaching an OD595 between 0.11 and 0.18. This mix was diluted 1:10 in a 100-ml chemostat and incubated at 24°C with aeration (breathable air bubbled through the medium at 100 ml min−1 using a diffuser) until reaching an OD595 between 0.11 and 0.16, at which point the in-flow pump was started (designated as time = 0) at a rate of ~7 ml hr−1. Following 0.25 retention times (4.5 hrs), the out-flow pump was initiated and the volume returned to 100 ml. At the indicated generation, samples were removed and used for determining OD595 and luminescence. The steady-state OD595 varied between 0.04 and 0.15 in different experiments, but luminescence of MJ1 and the competitiveness values were similar in each case. The mutant to wild type ratio was determined by counting the number of luminescent and non-luminescent colonies following dilution plating. Upon completion of the experiment, presence of the ΔluxCDABEG allele was confirmed in ten non-luminescent colonies by PCR using primers Lux7 and Lux9 (Table 1). We confirmed that carbon (glycerol) availability was limiting growth in this experiment by increasing glycerol concentration, resulting in faster growth until a higher cell density was reached.
Relative competitiveness of ES114 and EVS102 during colonization of the squid was assessed essentially as described previously (Visick et al. 2000; Fidopiastis et al. 2002; Lupp et al. 2002; McCann et al. 2003; Millikan and Ruby 2004; Dunn et al. 2006; Bose et al. 2007; Hussa et al. 2007). RCI values were determined by dividing the ratio of EVS102 to ES114 colonizing each animal by this ratio in the inoculum, with strain ratios determined by marking ES114 or EVS102 with pVSV3 and determining that strain’s population in the mixture by plating on LBS containing X-Gal. By alternately tagging ES114 or EVS102 with pVSV3, we eliminated the possibility that pVSV3 was responsible for observed differences in competitiveness, confirming our earlier observations that pVSV3 (data not shown) and the related plasmid pVSV103 (Dunn et al. 2006) do not significantly affect competitiveness. Methods for inoculating E. scolopes and recovering the bacteria colonizing each animal are described below. Calculations of the RCI average, confidence interval, and significance were performed on log-transformed data.
Colonization of Euprymna scolopes
E. scolopes hatchlings were infected with V. fischeri using previously described inoculation procedures (Ruby and Asato 1993; Stabb and Ruby 2003) and overnight exposures of squid to V. fischeri. Inoculant strains were pre-grown unshaken in 5 ml of SWT in 50-ml conical tubes at 28°C such that the OD595 was between 0.3 and 1.0, cultures were diluted in Instant Ocean to between 1000 and 3000 total CFU ml−1, and juvenile E. scolopes were exposed to inocula for between 12- to 14-h before being rinsed in V. fischeri-free Instant Ocean. Within each experiment, similar concentrations of mutant or wild-type cells were present in the respective inocula. Squid were homogenized at 48 h post-inoculation, and homogenates were serially diluted and plated onto LBS or LBS supplemented with X-Gal. Following overnight incubation, colonies were counted to determine CFU per animal. In the case of competition experiments plated on LBS with X-Gal, colonies were scored for their blue or white color to determine strain ratios (see mixed strain competitions above).
Results
3-oxo-C6-HSL induces luminescence and slows growth of V. fischeri ES114
We began studying the effects of luminescence on V. fischeri by examining wild-type strain ES114, which was isolated from an E. scolopes light organ (Boettcher and Ruby 1990). Like most isolates from E. scolopes, ES114 is relatively dim in culture (Lee and Ruby 1994) and produces little 3-oxo-C6-HSL autoinducer (Boettcher and Ruby 1990), which stimulates luminescence by activating the quorum sensing transcriptional regulator LuxR. Supplementing media with 3-oxo-C6-HSL induced maximal light production ~1500-fold (Fig. 2a and Table 2) and also slowed the growth of ES114 (Fig. 2b), reflected in longer doubling times (Fig. 2c). This phenomenon was not specific to growth in SWTO at 24 °C because it also occurred when cells were grown in LBS at 28°C (Fig. 2d).
Fig. 2.

Effect of 3-oxo-C6-HSL on the growth and luminescence of V. fischeri ES114 in culture. ES114 was grown with (filled symbols) or without (empty symbols) addition of 1 μM 3-oxo-C6-HSL. For cells grown in SWTO at 24°C (panels a, b, and c), the data shown include the specific luminescence plotted as a function of culture density (panel a), the culture density over time (panel b), and the doubling time as a function of OD595 (panel c). The doubling time as a function of OD595 is also reported for cells grown in LBS at 28°C (panel d).
Table 2.
Relative luminescence V. fischeri of strains
| Strain | Conditiona | Luminescence relative to ES114b | Photons/sec per cellc |
|---|---|---|---|
| ES114 | 1 | 3.3 | |
| ES114 | in squid | 860d | 2800 |
| ES114 | + 3-oxo-C6-HSL | 1500 | 5000 |
| ES114 | + IPTG | 1 | 3.3 |
| ESR1 | 0.11 | 0.36 | |
| EVS101 | 17 | 56 | |
| EVS101 | + IPTG | 340 | 1100 |
| JB22 | 9.4 | 31 | |
| JB22 | + IPTG | 4300 | 14000 |
| MJ1 | 13000 | 43000 | |
| MJ1 | C-limited chemostat | 7000e | 23000 |
Except as noted, strains were grown in SWTO medium at 24°C.
Maximum specific luminescence (luminescence/OD595) relative to ES114.
Maximum luminescence converted to photons/sec per cell based on the maximal luminescence of ES114 (3.3 photons/sec per cell) reported in similar conditions (Boettcher and Ruby 1990).
Specific luminescence was determined by dividing luminescence per CFU in the E. scolopes light organ by luminescence per CFU for ES114 cells grown in SWTO medium.
Specific luminescence in BGMYE medium during continuous culture at OD595 0.1 ± 0.05.
Interestingly, in both media types the increase in doubling time was most evident when culture OD595 was between 0.5 and 2.4, and was not seen when OD595 was <0.5 (Fig. 2c and 2d). This indicates that luminescence was not growth-limiting when cultures were below 0.5 OD595; however, it is important to note that specific luminescence also did not reach its maximum until culture OD595 was >1 (Fig. 2a). Although 3-oxo-C6-HSL was present throughout growth, quorum-sensing inhibitors present in complex media must be metabolized before luminescence is induced (Eberhard 1972), which is consistent with this rise in specific luminescence. In experiments described below with strains JB22 and EVS101, IPTG induced luminescence from the beginning of growth, yet luminescence-dependent attenuation of growth rate was similarly dependent on the growth stage of the culture (i.e. OD595>0.5), so the lag in luminescence induction seen in Figure 2 may not be related to the observation that luminescence-dependent growth attenuation only became evident after cultures reached an OD595>0.5.
It is intriguing that Figure 2 shows an increase in doubling time associated with 3-oxo-C6-HSL addition and brighter luminescence. This is consistent with the idea that the process of producing luminescence can slow growth; however, 3-oxo-C6-HSL also activates LuxR to stimulate non-lux genes (Callahan and Dunlap 2000), so luminescence cannot be pinpointed as the cause of decreased growth rate.
Construction of new lux mutants in V. fischeri
To focus specifically on effects of luxCDABEG induction, we sought defined lux mutants of V. fischeri for comparative experiments. To our knowledge, no defined dark lux mutant has been reported in a wild-type V. fischeri strain. A ΔluxA::ermR mutant allele has been generated (Visick and Ruby 1996; Visick et al. 2000), but this was crossed into ESR1 (Graf et al. 1994), which is a spontaneous rifampicin-resistant mutant of strain ES114. Rifampicin-resistant mutants often have pleiotropic phenotypes (Yanofsky and Horn 1981; Jin and Gross 1989; Blanc-Potard et al. 1995; Björkman et al. 1998) and ESR1 has notable differences from the wild type, including a reduced ability to colonize E. scolopes (McCann et al. 2003). We found that ESR1 has about one tenth the specific luminescence of ES114 when grown in SWTO (Table 2), and out of concern that ESR1 is an inappropriate parent strain for investigations of bioluminescence we placed the luxA::ermR allele in strain ES114, generating mutant EVS100.
Surprisingly, EVS100 grew more slowly than wild type in SWTO medium, and this was slightly exacerbated by the addition of 3-oxo-C6-HSL (Fig. 3). This growth defect of EVS100 and influence of 3-oxo-C6-HSL also occurred in SWT and LBS media (data not shown). These data could indicate that bioluminescence confers some growth advantage, but it could also reflect deleterious effects from expressing the ermR marker and/or from Lux-mediated production of RCHO and FMNH2 without the turnover of these products by luciferase. Given this uncertainty, we believe that the influence of the luxA::ermR allele on growth of V. fischeri is not interpretable, and we sought alternative genetic approaches so that we would not have to base any conclusions about the importance of bioluminescence on this pleiotropic mutant.
Fig. 3.

Relative growth of strains EVS100 and ES114. The ΔluxA::ermR mutant EVS100 (triangles) and wild type ES114 (diamonds) were grown in SWTO medium at 24°C with (filled symbols) or without (empty symbols) addition of 1 μM 3-oxo-C6-HSL.
We reasoned that a more interpretable approach was to generate strains wherein all the lux structural genes were eliminated (ΔluxCDABEG) or disconnected from the LuxR/LuxI quorum-sensing regulon and placed under control of an inducible promoter. We generated such strains using as parent strains either ES114 or the visibly bright V. fischeri strain MJ1, an isolate from the light organ of a pinecone fish, Monocentris japonica (Ruby and Nealson 1976). The genotypes of these mutants are illustrated in Figure 1. Each of the ΔluxCDABEG strains, like the ΔluxA::ermR mutant EVS100, produces no detectable luminescence, and the relative luminescence of the lux+ strains under various conditions is listed in Table 2.
Specific induction of luxCDABEG slows growth under certain conditions
We tested the effect of specifically inducing bioluminescence in EVS101 and JB22, in which the luxCDABEG genes are controlled by LacIq and the Ptac or PA1/34 promoters, respectively. Using IPTG to induce luminescence in these strains offered two advantages over inducing their wild-type parent ES114 with 3-oxo-C6-HSL. First, IPTG will specifically induce luxCDABEG in EVS101 and JB22 without also stimulating the entire LuxR regulon as addition of 3-oxo-C6-HSL does. Second, an inhibitor of 3-oxo-C6-HSL activity present in complex media must be catabolized by cells before the autoinducer is active, but this should not affect induction with IPTG.
In the presence of IPTG, specific luminescence of EVS101 (ΔluxR::ermR lacIq Ptac-luxI-CDABEG) was induced 20-fold to levels ~340-fold brighter than ES114, although this was still dimmer than ES114 cells exposed to 3-oxo-C6-HSL or growing in the squid light organ (Table 2). When induced by IPTG, EVS101 also displayed longer doubling times when the culture was between OD595 of 0.5 and 1.5 (Fig. 4a). Similarly, IPTG induced the luminescence of JB22 (lacIq PA1/34-luxCDABEG) ~460-fold and slowed growth when the OD595 was >0.5 (Fig. 4b). Upon induction with IPTG, JB22 was ~13-fold brighter than EVS101 (Table 2) and also suffered a more dramatic growth rate reduction (Fig. 4). IPTG did not induce luminescence in control strain JB23 (lacIq PA1/34-Δlux) or ES114 (Table 2) and did not slow growth of these strains (Fig. 4b).
Fig. 4.

Specific induction of bioluminescence affects growth of strains EVS101 and JB22. Doubling time is reported as a function of culture OD595 for cells grown in SWTO at 24°C with (filled symbols) or without (empty symbols) addition of 0.5 mg ml−1 IPTG. a Growth of wild type ES114 (diamonds) and luxR::ermR lacIq Ptac-luxI-luxCDABEG mutant EVS101 (triangles). b Growth of ES114 (diamonds), the lacIq PA1/34-luxCDABEG mutant JB22 (squares), or the dark lacIq PA1/34-ΔluxCDABEG control strain JB23 (circles). c Specific luminescence of ES114 (diamonds), EVS101 (triangles), and JB22 (squares).
Interestingly, neither EVS101 nor JB22 displayed a growth defect when culture OD595 was <0.5, even though the IPTG-induced Ptac and PA1/34 promoters drove expression of bioluminescence at such low cell densities (Fig 4c). This observation that luminescence only affects growth above a certain culture OD595 is not due to LuxR/LuxI-mediated quorum sensing, because LuxR/LuxI does not regulate luminescence in these strains. Indeed, luxR and luxI are disrupted in EVS101. This phenomenon also parallels the effect of 3-oxo-C6-HSL on the growth of ES114 shown in Figure 2.
We considered the possibility that oxygen might be replete at low OD595 but growth-limiting once OD595 is >0.5. If this were the case, then oxygen consumption by luciferase in induced JB22 and EVS101 cells could account for their reduced growth rate once cultures reach this threshold OD595. However, changing the degree of culture aeration by adjusting culture volume from 25 to 100 ml per 250-ml flask did not detectably affect the OD595 at which the growth rate of induced and uninduced cultures diverged (data not shown). We also compared the growth of JB22 and ES114 in filter-sterilized medium in which JB22 cells had previously been grown to an OD595 of 1.0 and then removed. In such partially-spent medium, induction of luminescence in JB22 caused an immediate reduction in growth rate, even at very low optical density when the cells are well aerated (data not shown). Together, these data suggest that competition for oxygen is not what limits the growth of highly luminescent cells when batch cultures reach OD595 >0.5.
Comparison of ΔluxCDABEG mutants to their wild-type parents
To test whether bioluminescence attenuates growth when the lux genes are under LuxR regulatory control, we compared ΔluxCDABEG mutants to their respective wild-type parents. Growth comparisons were made between distinct clonal cultures of mutant and wild type, and also by mixing the strains and determining their relative competitiveness. We first compared ΔluxCDABEG mutant EVS102 to its wild-type parent ES114. This wild type produces little light in culture unless 3-oxo-C6-HSL is added, and we saw no difference in the growth of ES114 and EVS102 in the absence of 3-oxo-C6-HSL (Fig. 5). However, addition of 3-oxo-C6-HSL induced luminescence and slowed the growth of ES114 but had relatively little effect on the doubling time of EVS102 (Fig. 5). Thus, the reduced growth rate of ES114 in the presence of 3-oxo-C6-HSL (Fig. 2) can be attributed to induction of luxCDABEG.
Fig. 5.

3-oxo-C6-HSL slows growth of ES114 but not ΔluxCDABEG mutant. Doubling time is reported as a function of culture OD595 for wild type ES114 (diamonds) or ΔluxCDABEG mutant EVS102 (triangles) grown in SWTO at 24°C with (filled symbols) or without (empty symbols) addition of 1 μM 3-oxo-C6-HSL.
We next compared ΔluxCDABEG mutant EVS103 to its visibly luminescent wild-type parent MJ1. Despite the bright luminescence of MJ1 (Table 2), we did not detect a growth difference between MJ1 and EVS103 when the strains were cultured individually in SWTO (data not shown). However, subtle differences in growth can be detected by monitoring the ratio of two strains in co-culture, and in a mixed-culture competition in SWTO the relative competitiveness index (RCI) of EVS103 was 1.055 per generation, equal to a 5.5% growth advantage for the dark mutant (Fig. 6a). We speculated that this disadvantage for the luminescent wild type might be exacerbated under low-nutrient conditions, and when MJ1 and EVS103 were similarly competed in a carbon-limited chemostat, the RCI of EVS103 was 1.26 per generation, equal to a 26% growth advantage for this ΔluxCDABEG mutant (Fig. 6b).
Fig. 6.

ΔluxCDABEG mutant EVS103 out-competes wild-type parent MJ1. In each panel data is from one representative experiment of three. a Relative competitiveness (RCI) of EVS103 (ΔluxCDABEG) co-cultured with MJ1 in SWTO at 24°C. The dotted line follows the best fit of the data (RCI=1.05 per generation). b RCI of EVS103 and MJ1 co-cultured continuously in a carbon-limited chemostat in BGMYE with 4 mM glycerol at 24°C (see Materials and Methods), conditions under which they are highly luminescent (Table 2). The dotted line follows the best fit of the data (RCI=1.26 per generation). RCI is defined as the ratio of EVS103 to MJ1 at each generation divided by the ratio of these strains at the start of the experiment.
Bioluminescence confers an advantage during colonization of E. scolopes
In contrast to the conditional disadvantage of expressing luxCDABEG in culture described above, a previous report suggested that bioluminescence is advantageous for cells colonizing the E. scolopes light organ. Specifically, Visick et al. found that a Δlux::ermR mutant colonizes E. scolopes at a lower level than its parent, ESR1 (Visick et al. 2000); however, two recent findings led us to reconsider the significance of this result. First, McCann et al. found that the rifampicin-resistant ESR1 does not colonize E. scolopes as effectively as does its wild-type parent ES114 (McCann et al. 2003), which could indicate that the factors limiting symbiotic colonization by ESR1 and its derivatives are not representative of normal infections. Second, we found that the same ΔluxA::ermR allele used previously also attenuated growth of strain EVS100 relative to that of its wild-type parent ES114 (Fig. 3), raising the possibility that the symbiotic deficiency associated with this mutation reflected a general attenuation and not a symbiosis-specific defect.
Therefore, to reexamine the importance of bioluminescence in colonization of the E. scolopes light organ, we compared the symbiotic competence of ES114 to mutants EVS100 (ΔluxA::ermR) and EVS102 (ΔluxCDABEG). We found that EVS100 and EVS102 each achieved populations three- to four-fold lower than ES114 colonization levels 48h after inoculation (Fig. 7a). Moreover, when squid were exposed to a mixed (~1:1) inoculum of EVS102 and ES114, the mutant was out-competed ~3-fold by wild type as evidenced by an average RCI ~0.3 (Fig. 7b). This competitive defect was significant (p<0.01), and a 95% confidence interval for the data presented in Figure 7B indicates an RCI between 0.2 and 0.5, which encompasses the RCI observed by Visick et al. (2000). Taken together, our data support the conclusion that bioluminescence contributes to the symbiotic competence of V. fischeri.
Fig. 7.

Symbiotic colonization of E. scolopes by lux mutants and wild type. a Average colonization levels 48h after inoculation with the indicated strain. Error bars represent standard error (n=17). Asterisks denote a significant (p<0.005) difference from wild type. b Competitiveness of EVS102 (ΔluxCDABEG) when presented in a mixed (~1:1) inoculum with wild type and recovered from squid after 48 h. Either ES114 (solid symbols) or EVS102 (empty symbols) contained pVSV3 (lacZ), which enabled strain identification by blue/white screening after patching on LBS plates supplemented with 50 μg/ml X-Gal. Each symbol represents the RCI determined from one squid, defined as the ratio of EVS102:ES114 in the squid divided by the ratio in the inoculum. An arrow marks the average RCI of 0.32, which was significantly <1 (p<0.01).
Discussion
By generating and characterizing V. fischeri mutants wherein the luxCDABEG genes are deleted or specifically inducible, we have demonstrated two apparently antithetical effects of bioluminescence induction in V. fischeri. Using a fully colonization-proficient wild-type strain, we have shown that bioluminescence contributes to the ability of V. fischeri to colonize E. scolopes (Fig 7). This confirms an earlier report by Visick et al. (2000) that reached a similar conclusion but used a symbiotically attenuated parent strain and a deleteriously pleiotropic luxA::ermR mutation. We also show that the poor colonization by the ΔluxCDABEG mutant is symbiosis-specific and cannot be attributed to a general attenuation associated with the loss of luminescence. On the contrary, we demonstrate that in culture luminescence can slow the growth of V. fischeri (Figs. 4 and 5) and put luminescent cells at a competitive disadvantage when mixed with a ΔluxCDABEG mutant (Fig. 6). This is consistent with decades-old speculation that the energetic commitment to bioluminescence, encompassing both the synthesis and enzymatic activity of Lux proteins, might represent an appreciable drag on culture-grown cells (reviewed in (Ziegler and Baldwin 1981)), although it may alternatively (or in addition) reflect a negative impact of luminescence on cells independent of energetic considerations.
Negative effect of luminescence on growth in culture
Our demonstration that expression of luxCDABEG can slow growth and our measurements of this effect are consistent with previous theoretical estimates of the energy devoted to bioluminescence in relation to the energy economy of the cell (Hastings and Nealson 1977; Karl and Nealson 1980; Tu and Mager 1995), although as discussed below such comparisons must be viewed cautiously. Hastings and Nealson (1977) calculated that the energy of each photon emitted is equivalent to the hydrolysis of six ATP molecules, and that in bright cultures this corresponds to ~6 × 10⁵ ATP hydrolyzed sec−1 cell−1, with even more energy required if luciferase sometimes consumes substrates without producing light, as is likely the case. Theoretically, there is less, but still substantial, energy devoted to Lux protein synthesis, which was estimated for luciferase as equivalent to ~1 × 10⁵ ATP hydrolyzed sec−1 cell−1 in bright cells (Karl and Nealson 1980). For comparison, theoretical calculations suggest active E. coli cells hydrolyze at least 2 × 10⁶ ATP sec−1 cell−1 (Peterson and Moller 2000), and experimentally determined values for E. coli were ~5 × 10⁶ ATP hydrolyzed sec−1 cell−1 (Holms et al. 1972; Neidhardt et al. 1990). Based on these estimates, the energy devoted to bioluminescence could be equivalent to ≥10% of the ATP turnover in bright cells. Karl and Nealson (1980) similarly estimated that the bioluminescence of strain MJ1 could account for 1% to 10% of cellular energy, and noted that the real energetic costs could be higher when considering the energy committed to Lux protein synthesis and inefficiency of luciferase. Our results were in line with these calculations, as we found that bright strain MJ1 was out-competed 5.5–26% per generation by a ΔluxCDABEG mutant (Fig. 6).
While such theoretical estimates may bring a useful perspective to the data, the fraction of cellular energy devoted to luminescence provides at best an overly simplified view of far more complex biology, and at worst it can be misleading. Similarly, it is tempting to look for a direct relationship between bioluminescence output and the extent of growth inhibition, but such a relationship, if it exists, should not be expected to hold across different growth conditions or even strain backgrounds. A key issue in this regard is that the ability of cells to generate energy will not be growth-limiting under all conditions, and if the longstanding model is correct that the energy committed to luminescence is responsible for luminescence-dependent growth inhibition, there may be no growth inhibition when energy is not growth limiting. So, for example, one might question why strain EVS101 has the same luminescence output when OD595 is 0.25 or 1.0, yet luminescence only inhibits growth in the latter instance. A simple explanation consistent with the model described above is that cell growth is limited by different parameters at these different growth stages. If something other than the ability to generate energy, for example translation, limits growth at low optical density (where growth rates are highest), this could account for the observation that ES114, EVS101, and JB22 did not display any luminescence-dependent growth inhibition at OD595 <0.5. This point highlights a limitation of the current study: most of the experiments were performed in batch culture where the factor limiting growth rate is an ever-moving target. At best one might expect bioluminescence output and the extent of growth inhibition to correlate for near-isogenic strains at the same growth phase in batch culture under the same conditions, and indeed it does appear to hold true that at OD595 of 1.0 in SWTO the relative luminescence output of ES114, EVS101, and JB22 (Table 2) corresponds with the relative magnitude of luminescence-dependent growth inhibition in these strains (Figs. 4 and 5). One might expect given the much brighter luminescence of strain MJ1 (Table 2) that it would suffer a greater luminescence-dependent growth inhibition than ES114; however, MJ1 and its derivatives grew more slowly than ES114 and its derivatives (data not shown), so again the factors governing growth may be different making such comparisons invalid.
With these caveats in mind, our data do seem consistent with the hypothesis that the energy committed to luminescence is responsible for luminescence-dependent growth inhibition. Specifically, the growth inhibition by luminescence was more pronounced under low nutrient conditions as would be expected if luminescence were draining resources away from ATP generation. For example, no luminescence-dependent growth inhibition was seen during growth in fresh rich media, but it became evident once the medium was partially spent. Even more strikingly ΔluxCDABEG mutant EVS103 had a greater co-culture growth advantage in a carbon-limited chemostat than it did in the rich medium SWTO.
It remains possible that luxCDABEG expression imposes some burden on cells apart from the loss of energy that is reflected in emitted photons and Lux protein synthesis, and such an alternative mechanism may be responsible for the slowing of growth that we have observed when bioluminescence is induced. For example, production of reactive oxygen species by luciferase or other stresses associated with expression of the lux operon might limit growth. However, microarray comparisons of mRNA from ES114 and the ΔluxCDABEG do not reveal clear differences reflective of a specific identifiable stress (e.g., relative induction of oxidative stress responses) (E.G. Ruby, personal communication). Perhaps a more plausible alternative model is that growth slows not because of the energy devoted to luminescence per se, but rather because luminescence disrupts the physiological balance that cells must maintain while growing and generating energy. This might be expected in particular in instances where luminescence was artificially induced (e.g. in strains EVS101 and JB22), because in these circumstances luminescence might be imposed on cells that under natural induction conditions would modify their physiology to accommodate the luminescence process but do not do so under these artificial induction conditions.
We also cannot rule out the possibility that altogether different mechanisms account for the competitiveness of dark mutants over wild type in mixed cultures. Some of our most striking data show that a ΔluxCDABEG mutant can out-compete its wild-type parent in a chemostat by as much as 26% (Fig. 6), similar to previous reports that spontaneous dark mutants can take over chemostat cultures of bioluminescent bacteria (Pooley et al. 2004). A simple explanation for these observations is that non-bioluminescent cells do not expend energy that can instead be used for other cellular processes, and that they therefore outgrow wild-type cells. An alternative explanation is that non-bioluminescent mutants somehow inhibit the growth of wild type in mixed cultures. The physiology of dark mutants might differ from that of wild type sufficiently that the release and reuptake of metabolic products (e.g., pyruvate (Ruby and Nealson 1977)) is coordinated differently with respect to culture conditions. This could theoretically result in an attenuation of the overall growth of wild type by a mechanism that is dependent on the presence of mutant cells. It is therefore important that we also observed an affect of luminescence on growth in clonal batch cultures (Figs. 2, 4, and 5), not just in co-culture (Fig. 6).
Although Karl and Nealson (1980) did not detect a growth rate reduction attributable to bioluminescence, there are several possible explanations for the discrepancy between their results and ours. For example, competition studies such as those shown in Figure 6 can detect subtle growth differences that might be missed by growth curve comparisons. Along these lines, different factors could limit growth at different times in batch culture, so dark mutants may only have an advantage during a specific window that might easily be missed in a comparison of batch cultures. Indeed, as discussed above, we found that the effect of lux expression on growth was conditional. Another potential reason that Karl and Nealson did not see an effect of bioluminescence on growth is that ΔluxCDABEG mutants have not been available until now, and other mutations (e.g. ΔluxA::ermR), non-isogenic strains, or addition of autoinducer to stimulate bioluminescence may lead to secondary effects that confound efforts to understand the specific effects of bioluminescence.
Bioluminescence as a colonization factor: potential benefits of expressing luxICDABEG
Our demonstration that bioluminescence enhances the ability of wild-type V. fischeri to colonize E. scolopes is intriguing, especially in light of the neutral or negative effects of bioluminescence that we have now documented in culture. Strains of many host-associated Vibrio species produce bioluminescence, raising the possibility that bioluminescence acts as a colonization factor in other host-microbe interactions as well. For example, it was recently reported that a Vibrio salmonicida mutant harboring a suicide-plasmid insertion in luxA was attenuated in the rate at which it caused mortality in Atlantic salmon (Nelson et al. 2007); however, our finding that a luxA insertion mutant of V. fischeri has unexpected pleiotropic effects might indicate that the effect on pathogenesis seen with V. salmonicida is due to similar unexpected factors. In the future, deletion mutants cleanly lacking the full complement of lux bioluminescence genes will be useful in determining whether lux plays a role in other bacteria-host interactions.
In the case of V. fischeri, the properties of the E. scolopes light organ that render bioluminescence useful remain to be determined and warrant further investigation. Several hypotheses offer explanations for how bioluminescence might be advantageous (for a review see (Stabb 2005)). One model proposed that luminescence might substitute for cytochrome-dependent respiration under conditions where this system cannot operate (Makemson and Hastings 1986), such as iron limitation, which might be experienced in some host tissues. However, an essential prediction of this model was that energy would be recovered during the reduction of FMN from the NADH pool, but it now seems clear that neither LuxG nor the other enzymes catalyzing this step are tied to ATP generation or Na+/H+ pumping (Duane and Hastings 1975; Watanabe and Hastings 1982; Lei et al. 1994; Lin et al. 1998). Other hypotheses suggest that luminescence may counteract oxidative stress imposed by the host (Visick et al. 2000), or it may act as a sink to consume excess reductant (Bourgois et al. 2001). In these models, the important function of the Lux proteins is to consume oxygen or reductant, respectively, and light itself can be considered a byproduct. Our recent finding that luminescence in V. fischeri is repressed under more reducing conditions by the ArcAB system is more consistent with the notion that luminescence is used as a response to oxidative stress (Bose et al. 2007).
Other hypotheses propose a central role for light itself. In one such hypothesis, it was proposed that luminescence could stimulate photolyase-mediated DNA repair (Czyz et al. 2000; Czyz et al. 2003; Kozakiewicz et al. 2005); however, we have demonstrated that this is not the mechanism by which luminescence benefits symbiotic V. fischeri cells in the E. scolopes light organ (Walker et al. 2006). It has also been proposed that the host may detect symbiotic bioluminescence, perhaps using cryptochromes, and impose some sanctions against dark infections (M. McFall-Ngai and C. Whistler, personal communication). Sanctions could be imposed by withholding nutrients or by increasing the production of antimicrobial peptides or reactive oxygen species, which the squid produce (Weis et al. 1996; Davidson et al. 2004). This model has evolutionary appeal, in that it provides a mechanism to assure that the host receives benefits from the symbionts.
Some of these hypotheses attempting to explain the symbiotic benefit of bioluminescence can be tested, in part, by examining the relative growth of bright cells and ΔluxCDABEG mutants under specifically manipulated culture conditions. While it is clear that in this study culture conditions do not reflect those in the host environment, in the future, culture conditions wherein luminescence attenuates growth may ultimately serve to elucidate the how bioluminescence helps symbionts fully colonize the host.
Acknowledgments
We thank Melissa Butler, Alecia Septer, Deanna Colton, Anne Dunn, Dawn Adin, and Noreen Lyell for technical assistance, and Karen Visick for sharing strains. Genome information was provided by the Vibrio fischeri Genome Project, at http://ergo.integratedgenomics.com/Genomes/VFI, supported by the W.M. Keck Foundation. This work was supported by a CAREER award to EVS from the National Science Foundation (MCB-0347317), by National Institutes of Health grant R01AI50661, and by a STIR grant from the Army Research Office (49549LSII).
References
- Björkman J, Hughes D, Andersson DI. Virulence of antibiotic-resistant Salmonella typhimurium. Proc Natl Acad Sci USA. 1998;31:3949–3953. doi: 10.1073/pnas.95.7.3949. [DOI] [PMC free article] [PubMed] [Google Scholar]
- Blanc-Potard A, Gari E, Spirito F, Figueroa-Bossi N, Bossi L. RNA polymerase (rpoB) mutants selected for increased resistance to gyrase inhibitors in Salmonella typhimurium. Molec Gen Genet. 1995;247:680–692. doi: 10.1007/BF00290399. [DOI] [PubMed] [Google Scholar]
- Boettcher KJ, Ruby EG. Depressed light emission by symbiotic Vibrio fischeri of the sepiolid squid Euprymna scolopes. J Bacteriol. 1990;172:3701–3706. doi: 10.1128/jb.172.7.3701-3706.1990. [DOI] [PMC free article] [PubMed] [Google Scholar]
- Boettcher KJ, Ruby EG. Detection and Quantifiction of Vibrio fischeri autoinducer from symbiotic squid light organs. J Bacteriol. 1995;177:1053–1058. doi: 10.1128/jb.177.4.1053-1058.1995. [DOI] [PMC free article] [PubMed] [Google Scholar]
- Bose JL, et al. Bioluminescence in Vibrio fischeri is controlled by the redox-responsive regulator ArcA. Mol Microbiol. 2007;65:538–553. doi: 10.1111/j.1365-2958.2007.05809.x. [DOI] [PubMed] [Google Scholar]
- Bourgois J-J, Sluse FE, Baguet F, Mallefet J. Kinetics of light emission and oxygen consumption by bioluminescent bacteria. J Bioengerg Biomembr. 2001;33:353–363. doi: 10.1023/a:1010615508916. [DOI] [PubMed] [Google Scholar]
- Boylan M, Miyamoto C, Wall L, Grahm A, Meighen E. LuxC, D, and E genes of the Vibrio fischeri luminescence operon code for the reductase, transferase, and synthetase enzymes involved in aldehyde biosyntheses. Photochem Photobiol. 1989;49:681–688. doi: 10.1111/j.1751-1097.1989.tb08441.x. [DOI] [PubMed] [Google Scholar]
- Callahan SM, Dunlap PV. LuxR- and acyl-homoserine-lactone-controlled non-lux genes define a quorum sensing regulon in Vibrio fischeri. J Bacteriol. 2000;182:2811–2822. doi: 10.1128/jb.182.10.2811-2822.2000. [DOI] [PMC free article] [PubMed] [Google Scholar]
- Czyz A, Plata K, Wegrzyn G. Stimulation of DNA repair as an evolutionary drive for bacterial bioluminescence. Luminescence. 2003;18:140–144. doi: 10.1002/bio.715. [DOI] [PubMed] [Google Scholar]
- Czyz A, Wrobel B, Wegrzyn G. Vibrio harveyi bioluminescence plays a role in stimulation of DNA repair. Microbiol. 2000;146:283–288. doi: 10.1099/00221287-146-2-283. [DOI] [PubMed] [Google Scholar]
- Davidson SK, Koropatnick TA, Kossmehl R, Sycuro L, McFall-Ngai MJ. No means “yes” in the squid-vibrio symbiosis: nitric oxide (NO) during the initial stages of a beneficial association. Cellular Microbiology. 2004;6:1139–1151. doi: 10.1111/j.1462-5822.2004.00429.x. [DOI] [PubMed] [Google Scholar]
- Diederich L, Roth A, Messer W. A versatile plasmid vector system for the regulated expression of genes in Escherichia coli. Biotechniques. 1994;16:916–923. [PubMed] [Google Scholar]
- Duane W, Hastings JW. Flavin mononucleotide reductase of luminous bacteria. Mol Cell Biochem. 1975;6:53–64. doi: 10.1007/BF01731866. [DOI] [PubMed] [Google Scholar]
- Dunlap PV, Kita-Tsukamoto K, Waterbury JB, Callahan SM. Isolation and characterization of a visibly luminous variant of Vibrio fischeri strain ES114 from the sepiolid squid Euprymna scolopes. Arch Microbiol. 1995;164:194–202. [Google Scholar]
- Dunn AK, Martin MO, Stabb EV. Characterization of pES213, a small mobilizable plasmid from Vibrio fischeri. Plasmid. 2005;54:114–134. doi: 10.1016/j.plasmid.2005.01.003. [DOI] [PubMed] [Google Scholar]
- Dunn AK, Millikan DS, Adin DM, Bose JL, Stabb EV. New rfp- and pES213-derived tools for analyzing symbiotic Vibrio fischeri reveal patterns of infection and lux expression in situ. Appl Environ Microbiol. 2006;72:802–810. doi: 10.1128/AEM.72.1.802-810.2006. [DOI] [PMC free article] [PubMed] [Google Scholar]
- Eberhard A. Inhibition and activation of bacterial luciferase synthesis. J Bacteriol. 1972;109:1101–1105. doi: 10.1128/jb.109.3.1101-1105.1972. [DOI] [PMC free article] [PubMed] [Google Scholar]
- Engebrecht J, Nealson K, Silverman M. Bacterial bioluminescence: isolation and genetic analysis of functions from Vibrio fischeri. Cell. 1983;32:773–781. doi: 10.1016/0092-8674(83)90063-6. [DOI] [PubMed] [Google Scholar]
- Fidopiastis PM, Miyamoto C, Jobling MG, Meighen EA, Ruby EG. LitR, a new transcriptional activator in Vibrio fischeri, regulates luminescence and symbiotic light organ colonization. Mol Microbiol. 2002;45:131–143. doi: 10.1046/j.1365-2958.2002.02996.x. [DOI] [PubMed] [Google Scholar]
- Fuqua WC, Winans SC, Greenberg EP. Quorum sensing in bacteria: the LuxR-LuxI family of cell density-responsive transcriptional regulators. J Bacteriol. 1994;176:269–275. doi: 10.1128/jb.176.2.269-275.1994. [DOI] [PMC free article] [PubMed] [Google Scholar]
- Graf J, Dunlap PV, Ruby EG. Effect of transposon-induced motility mutations on colonization of the host light organ by Vibrio fischeri. J Bacteriol. 1994;176:6986–6991. doi: 10.1128/jb.176.22.6986-6991.1994. [DOI] [PMC free article] [PubMed] [Google Scholar]
- Gray KM, Greenberg EP. Physical and functional maps of the luminescence gene cluster in an autoinducer-deficient Vibrio fischeri strain isolated from a squid light organ. J Bacteriol. 1992a;174:4384–4390. doi: 10.1128/jb.174.13.4384-4390.1992. [DOI] [PMC free article] [PubMed] [Google Scholar]
- Gray KM, Greenberg EP. Sequencing and analysis of luxR and luxI, the luminescence regulatory genes from the squid light organ symbiont Vibrio fischeri ES114. Molecular Marine Biology and Biotechnology. 1992b;1:414–419. [Google Scholar]
- Harvey EN. Bioluminescence. Academic Press; New York: 1952. [Google Scholar]
- Hastings JW, Nealson KH. Bacterial bioluminescence. Annu Rev Microbiol. 1977;31:549–595. doi: 10.1146/annurev.mi.31.100177.003001. [DOI] [PubMed] [Google Scholar]
- Holms WH, Hamilton ID, Robertson AG. The rate of turnover of the adenosine triphosphate pool of Escherichia coli growing aerobically in simple defined media. Arch Mikrobiol. 1972;83:95–109. doi: 10.1007/BF00425016. [DOI] [PubMed] [Google Scholar]
- Hussa EA, O’Shea TM, Darnell CL, Ruby EG, Visick KV. Two-component response regulators of Vibrio fischeri: Identification, mutagenesis, and characterization. J Bacteriol. 2007;189:5825–5838. doi: 10.1128/JB.00242-07. [DOI] [PMC free article] [PubMed] [Google Scholar]
- Jin DJ, Gross CA. Characterization of the pleiotropic phenotypes of rifampin-resistant rpoB mutants of Escherichia coli. J Bacteriol. 1989;171:5229–5231. doi: 10.1128/jb.171.9.5229-5231.1989. [DOI] [PMC free article] [PubMed] [Google Scholar]
- Karl D, Nealson KH. Regulation of cellular metabolism during synthesis and expression of the luminous system in Beneckea and Photobacterium. J Gen Microbiol. 1980;117:357–368. [Google Scholar]
- Keynan A, Hastings JW. The isolation and characterization of dark mutants of luminous bacteria. Biol Bull. 1961;121:375. [Google Scholar]
- Kozakiewicz J, Gajewska M, Lyzen R, Czyz A, Wegrzyn G. Bioluminescence-mediated stimulation of photoreactivation in bacteria. FEMS Microbiol Lett. 2005;250:105–110. doi: 10.1016/j.femsle.2005.06.047. [DOI] [PubMed] [Google Scholar]
- Lanzer M, Bujard H. Promoters largely determine the efficiency of repressor action. Proc Natl Acad Sci U S A. 1988;85:8973–8977. doi: 10.1073/pnas.85.23.8973. [DOI] [PMC free article] [PubMed] [Google Scholar]
- Lee K-H, Ruby EG. Competition between Vibrio fischeri strains during initiation and maintenance of a light organ symbiosis. J Bacteriol. 1994;176:1985–1991. doi: 10.1128/jb.176.7.1985-1991.1994. [DOI] [PMC free article] [PubMed] [Google Scholar]
- Lei B, Liu M, Huang S, Tu S-C. Vibrio harveyi NADPH-flavin oxidoreductase: cloning, sequencing and overexpression of the gene and purification and characterization of the cloned enzyme. J Bacteriol. 1994;176:3552–3558. doi: 10.1128/jb.176.12.3552-3558.1994. [DOI] [PMC free article] [PubMed] [Google Scholar]
- Lin JW, Chao YF, Weng SF. Characteristic analysis of the luxG gene encoding the probable flavin reductase that resides in the lux operon of Photobacterium leiognathi. Biochem Biophys Res Commun. 1998;246:446–452. doi: 10.1006/bbrc.1998.8641. [DOI] [PubMed] [Google Scholar]
- Lupp C, Hancock RE, Ruby EG. The Vibrio fischeri sapABCDF locus is required for normal growth, both in culture and in symbiosis. Arch Microbiol. 2002;179:57–65. doi: 10.1007/s00203-002-0502-7. [DOI] [PubMed] [Google Scholar]
- Makemson JC. Luciferase-dependent oxygen consumption by bioluminescent Vibrios. J Bacteriol. 1986;165:461–466. doi: 10.1128/jb.165.2.461-466.1986. [DOI] [PMC free article] [PubMed] [Google Scholar]
- Makemson JC, Hastings JW. Luciferase-dependent growth of cytochrome-deficient Vibrio harveyi. FEMS Microbiol Ecol. 1986;38:79–85. [Google Scholar]
- McCann J, Stabb EV, Millikan DS, Ruby EG. Population dynamics of Vibrio fischeri during infection of Euprymna scolopes. Appl Environ Microbiol. 2003;69:5928–5934. doi: 10.1128/AEM.69.10.5928-5934.2003. [DOI] [PMC free article] [PubMed] [Google Scholar]
- Meighen EA. Genetics of bacterial bioluminescence. Annu Rev Genet. 1994;28:117–139. doi: 10.1146/annurev.ge.28.120194.001001. [DOI] [PubMed] [Google Scholar]
- Miller JH. A short course in bacterial genetics. Cold Spring Harbor Laboratory Press; New York: 1992. [Google Scholar]
- Millikan DS, Ruby EG. Vibrio fischeri flagellin A is essential for normal motility and for symbiotic competence during initial squid light organ colonization. J Bacteriol. 2004;186:4315–4325. doi: 10.1128/JB.186.13.4315-4325.2004. [DOI] [PMC free article] [PubMed] [Google Scholar]
- Neidhardt FC, Ingraham JL, Schaechter M. Physiology of the bacterial cell: A molecular approach. Sinauer Associates, Inc; Sunderland, Mass: 1990. [Google Scholar]
- Nelson EJ, Tunsjo HS, Fidopiastis PM, Sorum H, Ruby EG. A novel lux operon in the cryptically bioluminescent fish pathogen Vibrio salmonicida is associated with virulence. Appl Environ Microbiol. 2007;73:1825–1833. doi: 10.1128/AEM.02255-06. [DOI] [PMC free article] [PubMed] [Google Scholar]
- Peterson C, Moller LB. Invariance of the nucleoside triphosphate pools of Escherichia coli with growth rate. J Biol Chem. 2000;275:3931–3935. doi: 10.1074/jbc.275.6.3931. [DOI] [PubMed] [Google Scholar]
- Pooley DT, et al. Continuous culture of photobacterium. Biosens Bioelectron. 2004;19:1457–1463. doi: 10.1016/j.bios.2003.09.003. [DOI] [PubMed] [Google Scholar]
- Rosson RA, Nealson KH. Autoinduction of bacterial bioluminescence in a carbon limited chemostat. Arch Microbiol. 1981;129:299–304. [Google Scholar]
- Ruby EG, Asato LM. Growth and flagellation of Vibrio fischeri during initiation of the sepiolid squid light organ symbiosis. Arch Microbiol. 1993;159:160–167. doi: 10.1007/BF00250277. [DOI] [PubMed] [Google Scholar]
- Ruby EG, Nealson KH. Symbiotic association of Photobacterium fischeri with the marine luminous fish Monocentris japonica: A model of symbiosis based on bacterial studies. Biol Bull. 1976;151:574–586. doi: 10.2307/1540507. [DOI] [PubMed] [Google Scholar]
- Ruby EG, Nealson KH. Pyruvate production and excretion by the luminous marine bacteria. Appl Environ Microbiol. 1977;34:164–169. doi: 10.1128/aem.34.2.164-169.1977. [DOI] [PMC free article] [PubMed] [Google Scholar]
- Stabb EV. Shedding light on the bioluminescence “paradox”. ASM News. 2005;71:223–229. [Google Scholar]
- Stabb EV. The Vibrio fischeri-Euprymna scolopes light organ symbiosis. In: Thompson FL, Austin B, Swings J, editors. The Biology of Vibrios. ASM Press; Washington, D.C: 2006. pp. 204–218. [Google Scholar]
- Stabb EV, Butler MS, Adin DM. Correlation between osmolarity and luminescence of symbiotic Vibrio fischeri strain ES114. J Bacteriol. 2004;186:2906–2908. doi: 10.1128/JB.186.9.2906-2908.2004. [DOI] [PMC free article] [PubMed] [Google Scholar]
- Stabb EV, Ruby EG. RP4-based plasmids for conjugation between Escherichia coli and members of the Vibrionaceae. Methods Enzymol. 2002;358:413–426. doi: 10.1016/s0076-6879(02)58106-4. [DOI] [PubMed] [Google Scholar]
- Stabb EV, Ruby EG. Contribution of pilA to competitive colonization of Euprymna scolopes by Vibrio fischeri. Appl Environ Microbiol. 2003;69:820–826. doi: 10.1128/AEM.69.2.820-826.2003. [DOI] [PMC free article] [PubMed] [Google Scholar]
- Tu S-C, Mager HIX. Biochemistry of bacterial bioluminescence. Photochem Photobiol. 1995;62:615–624. doi: 10.1111/j.1751-1097.1995.tb08708.x. [DOI] [PubMed] [Google Scholar]
- Visick KG, Ruby EG. Construction and symbiotic competence of a luxA-deletion mutant of Vibrio fischeri. Gene. 1996;175:89–94. doi: 10.1016/0378-1119(96)00129-1. [DOI] [PubMed] [Google Scholar]
- Visick KL, Foster J, Doino J, McFall-Ngai M, Ruby EG. Vibrio fischeri lux genes play an important role in colonization and development of the host light organ. J Bacteriol. 2000;182:4578–4586. doi: 10.1128/jb.182.16.4578-4586.2000. [DOI] [PMC free article] [PubMed] [Google Scholar]
- Walker EL, Bose JL, Stabb EV. Photolyase confers resistance to UV light but does not contribute to the symbiotic benefit of bioluminescence in Vibrio fischeri ES114. Appl Environ Microbiol. 2006;72:6600–6606. doi: 10.1128/AEM.01272-06. [DOI] [PMC free article] [PubMed] [Google Scholar]
- Watanabe H, Hastings JW. Specificities and properties of three reduced pyridine nucleotide-flavin mononucleiotide reductases coupling to bacterial luciferase. Mol Cell Biochem. 1982;44:181–187. doi: 10.1007/BF00238506. [DOI] [PubMed] [Google Scholar]
- Wei SL, Young RE. Development of symbiotic bacterial bioluminescence in a nearshore cephalopod, Euprymna scolopes. Mar Biol. 1989;103:541–546. [Google Scholar]
- Weis VM, Small AL, McFall-Ngai MJ. A peroxidase related to the mammalian antimicrobial protein myeloperoxidase in the Euprymna-Vibrio mutualism. Proc Natl Acad Sci USA. 1996;93:13683–13688. doi: 10.1073/pnas.93.24.13683. [DOI] [PMC free article] [PubMed] [Google Scholar]
- Yanofsky C, Horn V. Rifampicin resistance mutations that alter the efficiency of transcription termination at the tryptophan operon attenuator. J Bacteriol. 1981;145:1334–1341. doi: 10.1128/jb.145.3.1334-1341.1981. [DOI] [PMC free article] [PubMed] [Google Scholar]
- Zenno S, Saigo K. Identification of the genes encoding NAD(P)H-flavin oxidoreductases that are similar in sequence to Escherichia coli Fre in four species of luminous bacteria: Photorhabdus luminescens, Vibrio fischeri, Vibrio harveyi, and Vibrio orientalis. J Bacteriol. 1994;176:3544–3551. doi: 10.1128/jb.176.12.3544-3551.1994. [DOI] [PMC free article] [PubMed] [Google Scholar]
- Ziegler MM, Baldwin TO. Current topics in bioenergetics. Academic Press, Inc; Chestnut Hill, MA: 1981. Biochemistry of bacterial bioluminescence; pp. 65–113. [Google Scholar]