

Abstract
Objective
The C57Bl/6J (Bl/6J) mouse is the most widely used strain in metabolic research. This strain carries a mutation in nicotinamide nucleotide transhydrogenase (Nnt), a mitochondrial enzyme involved in NADPH production, which has been suggested to lead to glucose intolerance and beta-cell dysfunction. However, recent reports comparing Bl/6J to Bl/6N (carrying the wild-type Nnt allele) under normal diet have led to conflicting results using glucose tolerance tests. Thus, we assessed glucose-stimulated insulin secretion (GSIS), insulin sensitivity, clearance and central glucose-induced insulin secretion in Bl/6J and N mice using gold-standard methodologies.
Methods
GSIS was measured using complementary tests (oral and intravenous glucose tolerance tests) and hyperglycemic clamps. Whole-body insulin sensitivity was assessed using euglycemic-hyperinsulinemic clamps. Neurally-mediated insulin secretion was measured during central hyperglycemia.
Results
Bl/6J mice have impaired GSIS compared to Bl/6N when glucose is administered intravenously during both a tolerance test and hyperglycemic clamp, but not in response to oral glucose. First and second phases of GSIS are altered without changes in whole body insulin sensitivity, insulin clearance, beta-cell mass or central response to glucose, thereby demonstrating defective beta-cell function in Bl/6J mice.
Conclusions
The Bl/6J mouse strain displays impaired insulin secretion. These results have important implications for choosing the appropriate test to assess beta-cell function and background strain in genetically modified mouse models.
Keywords: Beta-cell, Insulin secretion, Insulin sensitivity, Genetic background, Mouse strain
Abbreviations: DI, disposition index; FSIVGTT, frequently sampled intravenous glucose tolerance test; GIR, glucose infusion rate; GSIS, glucose-stimulated insulin secretion; IDE, insulin degrading enzyme; IVGTT, intravenous glucose tolerance test; MI, insulin sensitivity index; NNT, nicotinamide nucleotide transhydrogenase; OGTT, oral glucose tolerance test
1. Introduction
In the past twenty years, numerous transgenic and gene knock-out mouse models have been generated to assess the molecular and cellular mechanisms regulating beta-cell function and to better understand the process involved in defective insulin secretion and the etiology of type 2 diabetes (T2D) (reviewed in Ref. [1]). The most commonly used mouse strains to generate genetic models are inbred and include FVB, 129, DBA and C57Bl/6. The methodology required to produce these models often results in animals with mixed genetic background. However, it is well established that the background strain has a strong influence on glucoregulatory responses and beta-cell function [2–4]. For instance, DBA mice show a strong insulin secretion in response to glucose compared to C57Bl/6 [5] or FVB mice [4]. As a result, single strain or backcrossing has been used as a way to circumvent confounding effect of the background on processes involved in the control of glucose homeostasis. In metabolic studies, the C57Bl/6 strain has been widely used as a control strain mainly because of its high susceptibility to develop obesity and hyperglycemia when fed with a high-fat diet compared to other strains [3,6]. However, the C57Bl/6 mouse exhibits glucose intolerance compared to other strains even when fed on a regular chow diet [7–9]. Most importantly, it was recently established that C57Bl/6 mice supplied by the Jackson Laboratory (Bl/6J) carry a five-exon deletion in Nnt which encodes the nicotinamide nucleotide transhydrogenase (NNT), a mitochondrial enzyme involved in NADPH production [5,9]. In contrast, C57Bl/6 supplied by Taconic or Charles River (Bl/6N) do not harbor the mutation. The Nnt mutation has been associated in some studies with impaired glucose-stimulated insulin secretion (GSIS) and glucose intolerance compared to mouse strains carrying the wild-type Nnt [5,9]. In addition, transgenic expression of the wild-type Nnt gene in Bl/6J rescues beta-cell function and glucose tolerance [10]. While these findings strongly support the role of NNT in insulin secretion, recent studies have led to conflicting results showing that GSIS and glucose tolerance during glucose tolerance tests are similar in Bl/6J compared to Bl/6N [11,12]. While the reasons for this discrepancy are not clear, it is important to mention that none of these studies used the hyperglycemic clamps, the gold-standard methodology to measure beta-cell function [13]. In addition, it is still unclear whether impaired insulin secretion in Bl/6J mice involves changes in pancreatic beta-cell mass and/or insulin sensitivity. Finally, although NNT is expressed at high levels in other organs including the brain, the impact of the Nnt mutation on central glucose sensing has not been investigated.
Based on these conflicting results and the important implications of this issue for choosing the appropriate background strain in genetically modified mouse models, we assessed beta-cell function using complementary tests as well as beta-cell mass, insulin sensitivity and central glucose-induced insulin secretion in the Bl/6J vs. N mice.
2. Methods
2.1. Animals
Male C57Bl/6 mice (12–14 weeks old) were purchased from the Jackson Laboratory (Bl/6J) and Charles River (Bl/6N). Animals were housed on a 12-h light/dark cycle at 21 °C with free access to water and standard chow diet for at least ten days before starting the experimentation. All procedures using animals were approved by the institutional animal care and use committee (Comité Institutionnel de Protection de Animaux, protocol #An12012TArs) of Centre de Recherche du Centre Hospitalier de l'Université de Montréal (CRCHUM) and the animal experimentation committee of Université de Bourgogne (protocol #105, C2EA, Dijon, France).
2.2. DNA extraction and genotyping
The presence of the NNT mutation was verified by PCR performed on DNA extracted from the liver using the protocol and primers described on the Jackson Laboratory website: http://jaxmice.jax.org/protocolsdb/f?p=116:2:0::NO:2:P2_MASTER_PROTOCOL_ID,P2_JRS_CODE:7470,012371.
PCR products were subjected to electrophoresis using 2% agarose gel.
2.3. Oral (OGTT) and intravenous (IVGTT) glucose tolerance tests
Oral glucose tolerance was assessed in overnight-fasted mice by measuring tail blood glucose 0, 15, 30, 45, 60, 90, and 120 min after oral administration of 2 g/kg glucose by gavage. Plasma samples were collected at 0, 15, 30 and 60 min for insulin measurement.
Intravenous glucose tolerance tests were performed in conscious, free-moving mice using modifications of a protocol previously described [14]. Briefly, a catheter was inserted into the right jugular vein under general anesthesia. Animals were allowed to recover for 5–6 days. Insulin secretion in response to intravenous glucose (0.75 g/kg) was measured at 0, 2.5, 5, 10, 15 and 30 min in mice fed ad libitum before the test. Plasma insulin was measured using a bead-based AlphaLISA insulin immunoassay kit (Perkin Elmer, Waltham, MA).
2.4. Assessment of insulin secretion and sensitivity by hyperglycemic and euglycemic-hyperinsulinemic clamps
One-step hyperglycemic clamps were performed on conscious animals (fed ad libitum before the clamp) as described [15]. A 20% dextrose solution was infused through the jugular vein to clamp plasma glucose at 320 mg/dl for 70 min and was adjusted based on glucose measurements (Roche Accu-Check; Roche, Indianapolis, IN). At 60 min, an arginine bolus injection was performed (1 mmol/kg; Sandoz Canada) to assess the maximal insulin response. Plasma samples were collected from the tail at several time points during the clamp for insulin measurements using the AlphaLISA kit. Plasma samples for C-peptide measurements were collected at 45 min and analyzed using a mouse C-peptide ELISA kit (Alpco Diagnostics). Two-hour hyperinsulinemic-euglycemic clamps were performed in 4 h food-restricted mice as previously described [15]. Briefly, following a 1-min bolus insulin infusion (85 mU/kg; Humulin R), insulin was infused at 8 mU/kg/min. Twenty percent dextrose was infused starting 5 min after the insulin infusion to clamp glycemia at ∼120 mg/dl. Insulin levels during the steady state were measured at 90 and 120 min using the AlphaLISA kit. The insulin sensitivity index (M/I) was calculated as the glucose infusion rate (M) divided by the average insulinemia during the last 30 min of the clamp (I). The Disposition Index (DI) was calculated by multiplying the insulin sensitivity during the euglycemic hyperinsulinemic clamp by insulin secretion during the hyperglycemic clamp (AUC insulin 0–60 min). Insulin clearance was calculated by dividing the insulin infusion rate by the Δ increase in circulating insulin levels during the steady state of the hyperinsulinemic euglycemic clamp as described previously [13].
2.5. Beta-cell mass
Whole pancreata were dissected and placed in ice-cold PBS. After removing all the surrounding fat, lymph nodes, connective tissue and excess buffer, pancreata were weighted and fixed in freshly prepared 10% formalin in PBS at room temperature for 24 h, followed by embedding in paraffin blocks. Cross pancreatic sections were cut at 5-μm thickness and collected at 50 μm intervals. At least 6 slides from each pancreas were processed for beta-cell mass measurement. Paraffin sections were rehydrated, heated at 95 °C in 10 mmol/l citrate (pH 6) for 45 min, blocked, immunostained with anti-guinea pig insulin antibody (DAKO) and anti-guinea pig alkaline phosphatase conjugated secondary antibody (Jackson Immunoresearch), and finally developed with the Vector Red alkaline phosphatase substrate kit (Vector Laboratories). Harris-modified hematoxylin was used for counter-staining before mounting the slides with Vectamount medium (Vector Laboratories). The slides were scanned using a Super Cool Scan 9000 scanner (Nikon) and the images were analyzed using the image processing program Image J (National Institutes of Health) to assess the beta-cell area and the whole pancreas area.
2.6. Central glucose-induced insulin secretion
The test was adapted from a protocol previously developed in rats [16,17]. Briefly, a sylastic catheter was implanted into the left carotid artery in the cranial direction of anesthetized mice (pentobarbital, 60 mg/kg) and secured in place with sutures. Fifteen minutes after the surgery, a bolus of glucose (25 mg/kg in 30 μl, osmolarity adjusted to 300–310 mOsM with NaCl) was administered through the catheter over 30 s. Blood samples were collected from the tail vein 0, 1, 3 and 5 min post-injection to measure blood glucose (Roche Accu-Check) and plasma insulin levels (AlphaLISA kit).
2.7. Expression of data and statistics
Data are expressed as means ± SEM. Intergroup comparisons were performed by ANOVA with Bonferroni post hoc adjustments for two-by-two comparisons (analysis of insulin and glucose levels during the course of the GTT and hyperglycemic clamp), or Student's t test, as appropriate. P < 0.05 was considered significant.
3. Results and discussion
As expected, PCR genotyping for the mutation indicates that Bl/6J mice carry the mutated Nnt allele (750 bp band) while Bl/6N mice carry the wild-type allele (570 bp band) (Figure 1A). Body weights were similar in 12–14 weeks old Bl/6J and Bl/6N male mice (26.6 ± 0.4 vs. 26.1 ± 0.5 g, n = 18–21, NS). Blood glucose levels in the fasted (82 ± 3 vs. 86 ± 3 mg/dl, n = 8, NS) and fed states (140 ± 4 vs. 134 ± 3 mg/dl, n = 16, NS) were not different. Insulin levels after an overnight fast were similar (0.26 ± 0.1 vs. 0.20 ± 0.04 ng/ml, n = 8, NS). However, in agreement with the report of Alonso et al. [12], fed insulin levels were significantly lower in Bl/6J compared to Bl/6N (0.42 ± 0.06 vs. 0.73 ± 0.13 ng/ml, n = 14–16, p < 0.05).
Figure 1.

Glucose and insulin levels during oral or intravenous glucose tolerance tests. (A) Detection of the mutated Nnt allele by PCR performed on liver DNA from Bl/6J and N mice. The band at 750 bp indicates the truncated form while the band at 570 bp indicates the full-length wild-type form. Glucose (B) and insulin (C) levels during an oral glucose tolerance test (OGTT, 2 g/kg) in 12–14 weeks old Bl/6J and N mice. Glucose (D) and insulin (E) levels during an intravenous glucose tolerance test (IVGTT, 0.75 g/kg) in Bl/6J and N mice. Values are expressed as means ± SEM of 7–9 mice per group. *p < 0.05, **p < 0.01 and ***p < 0.001 compared to Bl/6N mice.
Glucose tolerance assessed by oral glucose tolerance test (OGTT, 2 g/kg) was not significantly different in Bl/6N and Bl/6J mice despite a trend towards decreased tolerance in Bl/6J mice (Figure 1B). Insulin secretion during the course of the OGTT was not affected by the mouse strain (Figure 1C). In contrast, plasma glucose and insulin levels were significantly decreased in Bl/6J compared to Bl/6N (Figure 1D and E) during the intravenous GTT (IVGTT, 0.75 g/kg) suggesting that Bl/6J mice have a defective GSIS when glucose is administered intravenously. Based on the marked decrease in insulin levels during the IVGTT, a more pronounced glucose intolerance would have been expected in Bl/6J mice. This could be in part explained by the fact that glucose disposal is also dependent on glucose effectiveness in an insulin-independent manner (reviewed in Ref. [18]).
To validate the IVGTT results, insulin secretion was measured using hyperglycemic clamps. The glucose infusion rate (GIR, Figure 2B) required to maintain glycemia at ∼320 mg/dl (Figure 2A) was significantly decreased in Bl/6J compared to Bl/6N. Hyperglycemia induced a biphasic insulin secretion in Bl/6N mice, a response which was almost absent in Bl/6J mice (Figure 2C). First and second phase of insulin secretion were respectively decreased by ∼5 and ∼3 fold in Bl/6J compared to Bl/6N mice (Figure 2E). In addition, potentiation of insulin secretion by arginine was ∼3 fold lower in Bl/6J vs. Bl/6N mice (Figure 2D and E). Accordingly, C-peptide level during the steady-state was significantly decreased in Bl/6J animals (Figure 2F). Importantly, beta-cell mass was not different between Bl/6J and Bl/6N mice suggesting that the impairment in insulin secretion does not involve a decrease in beta-cell mass (Figure 2G). These results are in line with those of Wong et al. [11] reporting similar pancreatic insulin content in Bl/6J and N mice.
Figure 2.

Hyperglycemic clamps. Glucose (A), glucose infusion rate (GIR 30–60 min) (B), plasma insulin levels (C and D) during the course of the hyperglycemic clamp in 12–14 weeks old Bl/6J and N mice. (E) Area under the curve (AUC) for insulin. (F) C-peptide levels at 45 min. (G) Beta-cell mass. Values are expressed as means ± SEM of 7–8 mice per group. *p < 0.05, **p < 0.01 and ***p < 0.001 compared to Bl/6N mice.
To assess if the decreased insulin secretion is related to changes in whole body insulin sensitivity, hyperinsulinemic-euglycemic clamps were performed. The GIR (Figure 3B) required to maintain glycemia at ∼120 mg/dl (Figure 3A) was similar in both strains. Insulin levels during the steady state were similar in Bl/6J and N mice (3.1 ± 0.3 vs. 2.9 ± 0.4 ng/ml, n = 7–8, NS). As a result, no difference was observed between strains when calculating the insulin sensitivity index (M/I) (Figure 3C) suggesting that the defective insulin secretion is not compensated for by increased insulin sensitivity in Bl/6J mice. These results are in line with those of Wong et al. showing similar insulin sensitivity in Bl/6J and N mice using insulin tolerance tests [11]. The DI (calculated by combining insulin sensitivity data from hyperinsulinemic euglycemic clamps and insulin secretion from hyperglycemic clamps) was 11.2 ± 1.9 and 2.5 ± 0.8 (p < 0.01; N = 8) in Bl/6N and Bl/6J respectively, demonstrating impaired beta-cell function in Bl/6J mice.
Figure 3.
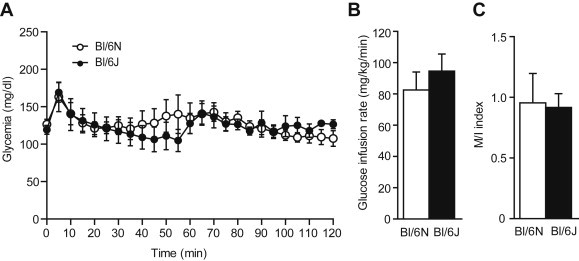
Hyperinsulinemic-euglycemic clamps. Glucose levels (A) and glucose infusion rate (GIR 60–120 min) (B) during the course of the hyperinsulinemic-euglycemic clamp in 12–14 weeks old Bl/6J and N mice. (C) Insulin sensitivity index (M/I). Values are expressed as means ± SEM of 7–8 mice per group.
Of importance, a copy number variation has been described in Bl/6J for the gene encoding insulin degrading enzyme (IDE), a protein known to regulate insulin levels, leading to altered IDE expression [19]. During the hyperinsulinemic euglycemic clamp, we did not observe differences in insulin clearance in Bl/6J and N mice (137 ± 10 vs. 144 ± 18 ml/kg/min respectively, NS) suggesting that IDE genomic variation does not affect insulin clearance rate in Bl/6J animals.
Finally, based on the expression of NNT in the brain and the role of the hypothalamo-pancreatic axis in beta-cell function, we assessed whether the central response to glucose was affected in Bl/6J mice. Glucose injection towards the brain via the carotid artery did not affect peripheral glucose levels (Figure 4A) but triggered a rapid and transient increase in plasma insulin which was not different in Bl/6J compared to Bl/6N mice (Figure 4B). Although we can not rule out that other functions regulated by central glucose, i.e. feeding and hepatic glucose production, may be altered by the Nnt mutation, these results suggest that the acute response to central glucose and neural control of insulin secretion are not affected by the strain background.
Figure 4.
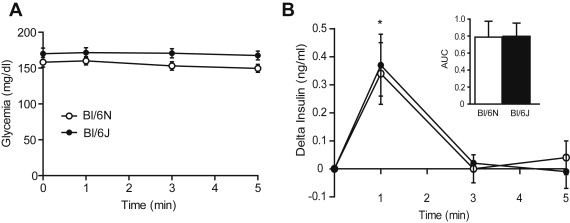
Central glucose-induced insulin secretion. Glucose levels (A) and insulin secretion (B) after injection of a glucose bolus (25 mg/kg) via the carotid artery towards the brain in 12–14 weeks old Bl/6J and N mice. Values are expressed as means ± SEM of 7–9 mice per group. *p < 0.05 compared to basal.
Taken together, our results demonstrate that Bl/6J mice have impaired GSIS compared to Bl/6N when glucose is administered intravenously during both a tolerance test and hyperglycemic clamp but not in response to oral glucose. This defect is characterized by impairment of both first and second phase insulin secretion, as well as its potentiation by arginine, without changes in whole body insulin sensitivity, insulin clearance or beta-cell mass. It is important to mention that GSIS was measured in male mice only. Based on the well-documented insulinotropic action of estrogens (reviewed in Ref. [20]), we can not rule out that female Bl/6J mice have an improved or normal response to glucose compared to male Bl/6J mice.
Overall, our findings agree with previous studies showing decreased glucose tolerance and GSIS during intraperitoneal GTT or in islets isolated from Bl/6J compared to other strains [2,5,9] and that transgenic expression of wild-type NNT rescues GSIS in Bl/6J [10]. However, they contrast with more recent reports showing that insulin secretion during IVGTT is similar in Bl/6J and N animals [11,12]. The reason for this discrepancy is unclear but could involve differences in the type of test, IVGTT vs. frequently sampled IVGTT (FSIVGTT) [12]; the feeding status, no food restriction in the current study vs. overnight fasting [11]; the site of blood sampling, tail vein vs. retro-orbital sinus [11] and carotid artery [12]; and the fact that the test was performed in conscious vs. anesthetized mice [11]. Finally, we choose the glucose doses and glucose infusion rate to obtain similar level of hyperglycemia (∼320 mg/dl) during the different tests. The hyperglycemia achieved during IVGTT [11] or FSIVGTT [12] were higher ∼500 and 400 mg/dl respectively. Therefore, it is possible that Bl/6J may secrete more insulin at higher glycemia.
It is important to mention that although no difference was observed in insulin secretion during FSIVGTT performed in Bl/6J and N in a previous study [12], a strong variation was observed among Bl/6J mice with insulin secretion that varied between 6-fold and 42-fold in response to IV glucose. Interestingly, we did not observe such a heterogeneous response to glucose in the current study during IVGTT (2.1–3.9-fold increase in Bl/6N vs. 1.5 to 3.8 in Bl/6J) or hyperglycemic clamp (1.7–3.9-fold increase in Bl/6N vs. 0.6 to 2.2 in Bl/6J).
Despite these differences in the experimental conditions and results compared to previous studies, our findings unequivocally demonstrate using complementary tests and the hyperglycemic clamp that Bl/6J mice have impaired GSIS compared to Bl/6N and therefore have important implications.
First, they demonstrate that the test and experimental conditions used to assess beta-cell function and/or glucose homeostasis have a significant impact on the results and their interpretations. These aspects have been thoroughly discussed by McGuiness et al. [21] and are exemplified in the current study and previous studies from our groups in which no differences were observed in glucose clearance or insulin secretion during GTT [14,22] whereas insulin secretion was altered during hyperglycemic clamp [15] in the same mouse model. In addition, the current OGTT data suggest that the oral route of administration and the associated release of gut incretins, i.e. Glucagon Like Peptide-1 and Gastric Inhibitory Polypeptide, may compensate and therefore mask the defective insulin secretion observed when glucose is administered intravenously during an IVGTT and a hyperglycemic clamp in Bl/6J animals. The compensatory effect of incretins during an OGTT may involve potentiation of GSIS and/or increased glucose effectiveness [23]. Thus, based on these findings, one would advise to perform an OGTT plus an IVGTT or hyperglycemic clamp to accurately assess beta-cell function in rodents. Importantly, the hyperglycemic clamp presents several strengths compared to other tests because it allows measuring the two phases of insulin secretion and C-peptide release during the steady state of hyperglycemia. C-peptide is secreted in a 1:1 molar ratio with insulin but is not cleared like insulin thereby limiting data misinterpretation due to strain-related differences in insulin clearance.
Second, our results suggest that the defective GSIS observed in Bl/6J might contribute to the phenotypic differences in glucoregulatory responses observed during diet-induced obesity [24]. Indeed, when fed with a high fat diet, Bl/6J mice gain more weight and display worsened glucose intolerance compared to Bl/6NJ mice, a substrain from the Jackson Laboratory that do not carry the Nnt mutation [24]. In contrast, other studies reported either no difference in body weight gain under high fat diet in Bl/6N vs. Bl/6J [25] or increased body weight gain and hyperinsulinemia in Bl6/N compared to Bl/6J [26,27]. However, glucose homeostasis and insulin levels were not systematically assessed in these studies making it difficult to speculate on the potential involvement of the Nnt mutation in the response to high fat feeding. In addition, recent reports identified new genetic loci that may contribute to the differential body weight gain in Bl/6N and Bl/6J when challenged with high fat diet [25,28]. Additional studies using similar Bl/6J and N substrains, high fat diet, duration of high fat feeding and housing conditions will be required to determine if NNT contributes to the alteration of glucoregulatory responses induced by high fat feeding.
Third, our findings have important implications for choosing the appropriate strain background when generating genetically modified mouse models. The Jackson Laboratory offers an important repository of Cre-expressing transgenic mice for loss of function studies which have been backcrossed for one to several generations with Bl/6J animals. As a result, most of the Cre-expressing mice strains commercially available carry the NNT mutation (heterozygous or homozygous) including pancreas and beta-cell specific Cre-strains such as Sox9, Pdx1, RIP and MIP-Cre mice (reviewed in Ref. [1]). If the status of the mutation is not verified in Cre-expressing breeders, this could lead to a mix of experimental control and knock-out mice carrying or not the mutated NNT locus and thus have confounding effect on glucoregulatory responses. The same issue applies for whole-body knock-out or knock-in animals generated using classical transgenesis. As a result, caution should be taken when attributing an altered phenotype or disease only on the genetic manipulation in knock-out animals of the C57Bl/6 strain if the genetic background is not known and/or controlled for.
In conclusion, our study validates that the Bl/6J strain is characterized by an impaired insulin secretion and thus suggests that caution should be taken when studying beta-cell function in animals with the mutated Nnt locus.
Author contributions
Conceived and designed the experiments: TA, VP, XF. Performed the experiments: GF, ME, MG, CA, CC, XF. Contributed reagents/materials/analysis tools: MP, EJ, CA. Analyzed the data: TA, VP, CC, XF, EJ. Wrote the manuscript: TA. Reviewed the manuscript: VP, MP, EJ and XF.
Acknowledgments
This work was supported by grants from the Canadian Institutes of Health Research (MOP115042 to TA, MOP77686 to VP and MOP243919 to MP), the US National Institutes of Health (R01DK58096 to VP), Marie Curie Foundation (CIG NeuROSenS to XF) PCIG09-GA-2011-293738 and Société Francophone du Diabète (to TA and XF).
TA was supported by a salary award from Fonds de Recherche Québec-Santé (FRQS).
VP holds the Canada Research Chair in Diabetes and Pancreatic Beta-Cell Function. MP holds the Canada Research Chair in Diabetes and Metabolism. We thank the Rodent Metabolic Phenotyping core and Biology and Imaging core of CRCHUM.
Conflict of interest
None declared.
References
- 1.Magnuson M.A., Osipovich A.B. Pancreas-specific Cre driver lines and considerations for their prudent use. Cell Metabolism. 2013;18:9–20. doi: 10.1016/j.cmet.2013.06.011. [DOI] [PMC free article] [PubMed] [Google Scholar]
- 2.Kooptiwut S., Zraika S., Thorburn A.W., Dunlop M.E., Darwiche R., Kay T.W. Comparison of insulin secretory function in two mouse models with different susceptibility to beta-cell failure. Endocrinology. 2002;143:2085–2092. doi: 10.1210/endo.143.6.8859. [DOI] [PubMed] [Google Scholar]
- 3.Andrikopoulos S., Massa C.M., Aston-Mourney K., Funkat A., Fam B.C., Hull R.L. Differential effect of inbred mouse strain (C57BL/6, DBA/2, 129T2) on insulin secretory function in response to a high fat diet. Journal of Endocrinology. 2005;187:45–53. doi: 10.1677/joe.1.06333. [DOI] [PubMed] [Google Scholar]
- 4.Berglund E.D., Li C.Y., Poffenberger G., Ayala J.E., Fueger P.T., Willis S.E. Glucose metabolism in vivo in four commonly used inbred mouse strains. Diabetes. 2008;57:1790–1799. doi: 10.2337/db07-1615. [DOI] [PMC free article] [PubMed] [Google Scholar]
- 5.Aston-Mourney K., Wong N., Kebede M., Zraika S., Balmer L., McMahon J.M. Increased nicotinamide nucleotide transhydrogenase levels predispose to insulin hypersecretion in a mouse strain susceptible to diabetes. Diabetologia. 2007;50:2476–2485. doi: 10.1007/s00125-007-0814-x. [DOI] [PubMed] [Google Scholar]
- 6.Surwit R.S., Kuhn C.M., Cochrane C., McCubbin J.A., Feinglos M.N. Diet-induced type II diabetes in C57BL/6J mice. Diabetes. 1988;37:1163–1167. doi: 10.2337/diab.37.9.1163. [DOI] [PubMed] [Google Scholar]
- 7.Kulkarni R.N., Almind K., Goren H.J., Winnay J.N., Ueki K., Okada T. Impact of genetic background on development of hyperinsulinemia and diabetes in insulin receptor/insulin receptor substrate-1 double heterozygous mice. Diabetes. 2003;52:1528–1534. doi: 10.2337/diabetes.52.6.1528. [DOI] [PubMed] [Google Scholar]
- 8.Rossmeisl M., Rim J.S., Koza R.A., Kozak L.P. Variation in type 2 diabetes-related traits in mouse strains susceptible to diet-induced obesity. Diabetes. 2003;52:1958–1966. doi: 10.2337/diabetes.52.8.1958. [DOI] [PubMed] [Google Scholar]
- 9.Toye A.A., Lippiat J.D., Proks P., Shimomura K., Bentley L., Hugill A. A genetic and physiological study of impaired glucose homeostasis control in C57BL/6J mice. Diabetologia. 2005;48:675–686. doi: 10.1007/s00125-005-1680-z. [DOI] [PubMed] [Google Scholar]
- 10.Freeman H.C., Hugill A., Dear N.T., Ashcroft F.M., Cox R.D. Deletion of nicotinamide nucleotide transhydrogenase: a new quantitive trait locus accounting for glucose intolerance in C57BL/6J mice. Diabetes. 2006;55:2153–2156. doi: 10.2337/db06-0358. [DOI] [PubMed] [Google Scholar]
- 11.Wong N., Blair A.R., Morahan G., Andrikopoulos S. The deletion variant of nicotinamide nucleotide transhydrogenase (Nnt) does not affect insulin secretion or glucose tolerance. Endocrinology. 2010;151:96–102. doi: 10.1210/en.2009-0887. [DOI] [PubMed] [Google Scholar]
- 12.Alonso L.C., Watanabe Y., Stefanovski D., Lee E.J., Singamsetty S., Romano L.C. Simultaneous measurement of insulin sensitivity, insulin secretion, and the disposition index in conscious unhandled mice. Obesity (Silver Spring) 2012;20:1403–1412. doi: 10.1038/oby.2012.36. [DOI] [PMC free article] [PubMed] [Google Scholar]
- 13.DeFronzo R.A., Tobin J.D., Andres R. Glucose clamp technique: a method for quantifying insulin secretion and resistance. American Journal of Physiology. 1979;237:E214–E223. doi: 10.1152/ajpendo.1979.237.3.E214. [DOI] [PubMed] [Google Scholar]
- 14.Kebede M., Alquier T., Latour M.G., Semache M., Tremblay C., Poitout V. The fatty acid receptor GPR40 plays a role in insulin secretion in vivo after high-fat feeding. Diabetes. 2008;57:2432–2437. doi: 10.2337/db08-0553. [DOI] [PMC free article] [PubMed] [Google Scholar]
- 15.Alquier T., Peyot M.L., Latour M.G., Kebede M., Sorensen C.M., Gesta S. Deletion of GPR40 impairs glucose-induced insulin secretion in vivo in mice without affecting intracellular fuel metabolism in islets. Diabetes. 2009;58:2607–2615. doi: 10.2337/db09-0362. [DOI] [PMC free article] [PubMed] [Google Scholar]
- 16.Alquier T., Leloup C., Atef N., Fioramonti X., Lorsignol A., Pénicaud L. Cerebral insulin increases brain response to glucose. Journal of Neuroendocrinology. 2003;15:75–79. doi: 10.1046/j.1365-2826.2003.00961.x. [DOI] [PubMed] [Google Scholar]
- 17.Leloup C., Magnan C., Benani A., Bonnet E., Alquier T., Offer G. Mitochondrial reactive oxygen species are required for hypothalamic glucose sensing. Diabetes. 2006;55:2084–2090. doi: 10.2337/db06-0086. [DOI] [PubMed] [Google Scholar]
- 18.Best J.D., Kahn S.E., Ader M., Watanabe R.M., Ni T.C., Bergman R.N. Role of glucose effectiveness in the determination of glucose tolerance. Diabetes Care. 1996;19:1018–1030. doi: 10.2337/diacare.19.9.1018. [DOI] [PubMed] [Google Scholar]
- 19.Watkins-Chow D.E., Pavan W.J. Genomic copy number and expression variation within the C57BL/6J inbred mouse strain. Genome Research. 2008;18:60–66. doi: 10.1101/gr.6927808. [DOI] [PMC free article] [PubMed] [Google Scholar]
- 20.Tiano J.P., Mauvais-Jarvis F. Importance of oestrogen receptors to preserve functional beta-cell mass in diabetes. Nature Reviews Endocrinology. 2012;8:342–351. doi: 10.1038/nrendo.2011.242. [DOI] [PubMed] [Google Scholar]
- 21.McGuinness O.P., Ayala J.E., Laughlin M.R., Wasserman D.H. NIH experiment in centralized mouse phenotyping: the Vanderbilt experience and recommendations for evaluating glucose homeostasis in the mouse. American Journal of Physiology – Endocrinology and Metabolism. 2009;297:E849–E855. doi: 10.1152/ajpendo.90996.2008. [DOI] [PMC free article] [PubMed] [Google Scholar]
- 22.Latour M.G., Alquier T., Oseid E., Tremblay C., Jetton T.L., Luo J. GPR40 is necessary but not sufficient for fatty acid stimulation of insulin secretion in vivo. Diabetes. 2007;56:1087–1094. doi: 10.2337/db06-1532. [DOI] [PMC free article] [PubMed] [Google Scholar]
- 23.D'Alessio D.A., Kahn S.E., Leusner C.R., Ensinck J.W. Glucagon-like peptide 1 enhances glucose tolerance both by stimulation of insulin release and by increasing insulin-independent glucose disposal. Journal of Clinical Investigation. 1994;93:2263–2266. doi: 10.1172/JCI117225. [DOI] [PMC free article] [PubMed] [Google Scholar]
- 24.Nicholson A., Reifsnyder P.C., Malcolm R.D., Lucas C.A., MacGregor G.R., Zhang W. Diet-induced obesity in two C57BL/6 substrains with intact or mutant nicotinamide nucleotide transhydrogenase (Nnt) gene. Obesity (Silver Spring) 2010;18:1902–1905. doi: 10.1038/oby.2009.477. [DOI] [PMC free article] [PubMed] [Google Scholar]
- 25.Heiker J.T., Kunath A., Kosacka J., Flehmig G., Knigge A., Kern M. Identification of genetic loci associated with different responses to high-fat diet-induced obesity in C57BL/6N and C57BL/6J substrains. Physiological Genomics. 2014;46:377–384. doi: 10.1152/physiolgenomics.00014.2014. [DOI] [PubMed] [Google Scholar]
- 26.Kern M., Knigge A., Heiker J.T., Kosacka J., Stumvoll M., Kovacs P. C57BL/6JRj mice are protected against diet induced obesity (DIO) Biochemical and Biophysical Research Communications. 2012;417:717–720. doi: 10.1016/j.bbrc.2011.12.008. [DOI] [PubMed] [Google Scholar]
- 27.Kahle M., Horsch M., Fridrich B., Seelig A., Schultheiss J., Leonhardt J. Phenotypic comparison of common mouse strains developing high-fat diet-induced hepatosteatosis. Molecular Metabolism. 2013;2:435–446. doi: 10.1016/j.molmet.2013.07.009. [DOI] [PMC free article] [PubMed] [Google Scholar]
- 28.Mekada K., Abe K., Murakami A., Nakamura S., Nakata H., Moriwaki K. Genetic differences among C57BL/6 substrains. Experimental Animals. 2009;58:141–149. doi: 10.1538/expanim.58.141. [DOI] [PubMed] [Google Scholar]