Abstract
Animal models, consistent with the hypothesis of direct interaction of paraquat (PQ) and 1-Methyl-4-phenyl-1,2,3,6-tetrahydropyridine (MPTP) with specific areas of the central nervous system have been developed to study Parkinson’s disease (PD) in mice. These models have necessitated the creation of an analytical method for unambiguous identification and quantitation of PQ and structurally similar MPTP and 1-Methyl-4-phenylpyridinium ion (MPP+) in brain tissue. A method for determination of these compounds was developed using microwave-assisted solvent extraction (MASE) and liquid chromatography-mass spectrometry. Extraction solvent and microwave conditions such as power and time were optimized to produce recoveries of 90% for PQ 78% for MPTP and 97% for its metabolite MPP+. The chromatographic separation was performed on a C8, column and detection was carried out using an ion trap as an analyzer with electrospray ionization. Mass spectrometer parameters such as heated capillary temperature, spray voltage, capillary voltage and others were also optimized for each analyte. Analysis was done in Selective Ion Monitoring (SIM) mode using 186 m/z for PQ, m/z 174 for MPTP, and m/z 170 for MPP+. The method detection limit for paraquat in matrix was 100 pg and 40 pg for MPTP and 20 pg MPP+.
Keywords: paraquat, MPTP, MPP+, tissue, microwave solvent extraction, HPLC, mass spectrometry, electrospray ionization
Introduction
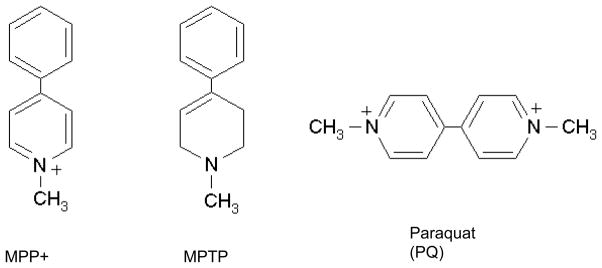
Parkinson’s disease (PD) is a neurodegenerative disorder that is typically diagnosed after 70 – 80% of nigrostriatal dopaminergic function has been lost accentuating the need for specific biomarkers that may have been used for diagnoses of the disease at an earlier stage. A reliable animal model may assist in identification of novel biomarkers, leading to early detection and possibly intervention. Paraquat (PQ, 1,1′,-dimethyl-4,4′-bipyridinium chloride; Figure 1) is a non-selective herbicide used extensively for the control of weeds and grasses in fruit orchards and as a defoliant on cotton plantations [1]. PQ has toxic affects on lung, heart, liver kidney and also brain [1]. It has been identified both epidemiologically and experimentally as a possible risk factor for PD [2, 3, 4, 5]. Several reports have shown a correlation between PQ, other pesticide use and the incidence of PD [2, 6]. Animal models have been developed to study PD using compounds including PQ and 1-Methyl-4-phenyl-1,2,3,6-tetrahydropyridine (MPTP; Figure 1) [7, 8]. The MPTP-generated lesion in mice is considered as a good acute model of PD [9]. Experimental data suggest that PQ preferentially kills dopaminergic neurons in the substantia nigra in both mice and rats, suggesting that PQ gets into the brain and specifically targets this site [10, 11, 12].
Figure 1.

Structures of the target analytes
One of the keys in determining its efficacy as a model for PD is to measure its concentration and disposition effectively in brain tissue of animals, and correlate that with the biological outcomes. In order to determine the efficacy of applied dose as well as which area of the brain is affected by PQ, it is necessary to develop a method to extract PQ from brain tissue and quantify it.
Ion-pair extraction into an organic solvent and reversed-phase high performance liquid chromatography (HPLC) separation with UV detection has previously been used to analyze PQ in rat brain tissue [13]. PQ and other quaternary ammonium pesticides in water were analyzed by HPLC with electrospray (ESI) mass spectrometry (MS) [14]. A useful technique for extracting compounds from biological and environmental samples is microwave-assisted solvent extraction (MASE) [15, 16]. MASE involves heating solid sample-solvent mixtures in a closed vessel with microwave energy under temperature-controlled and pressure-controlled conditions. This closed vessel extraction system enables analyte extraction with elevated temperatures and pressure accelerating the extraction process and yielding a performance comparable to the standard Soxhlet method. As extraction solvents, polar liquids or mixtures of polar and non-polar liquids are used because primarily polar compounds absorb microwave energy. After the heating cycle is completed, samples are cooled and filtered in order to separate the extract for analysis. It is only applicable to thermally stable compounds.
Previous studies in this laboratory have utilized a MASE method with HPLC-MS quantitation for analysis of PQ in brain tissue [17, 18]. In the present study, a MASE protocol was optimized as a rapid and precise extraction method for PQ from mouse brain tissue. This extract was subsequently quantitated by an HPLC ion trap mass spectrometric (ITMS) protocol.
Materials and methods
Chemical and reagents
PQ was obtained from ChemService (West Chester, PA). 1-Methyl-4-phenylpyridinium iodide (MPP+), MPTP, glacial acetic acid (HPLC grade), and formic acid (puriss p.a. for MS) were purchased from Sigma-Aldrich (St. Louis, MO). Water, methanol, and acetonitrile, all high purity, Burdick & Jackson brands were purchased from VWR Scientific (Bridgeport, NJ). All solvents and reagents were used without further purification.
Experimental
Regional brain tissue samples from mice treated with either 10 mg/kg PQ or 15 mg/kg MPTP were obtained from anesthetized animals perfused with 0.9% saline to remove blood from tissue which may contain PQ and confound the results. Untreated mouse brain tissue samples were used for controls and to create calibration standards. After a mouse was sacrificed, the perfused brain was removed, dissected on ice and each tissue section was accurately weighed. Weighed brain samples (striatum, midbrain others.) were placed into 1.5-ml polypropylene microcentrifuge tubes and stored at −20°C until preparation for analysis.
Animal treatment
For all experiments C57BL/6 mice were used and purchased from the Jackson Laboratory (JAX, Bar Harbor, Maine). Animals were injected intraperitoneally with 5 mg/kg PQ, or the combination of 5 mg/kg PQ and 10 mg/kg MB and sacrificed 24 hr after the last injection. Striatum, frontal cortex, and midbrain were dissected and sample extracts from all brain regions were used in the method validation study. Animal treatment procedures were approved by the UMDNJ Institutional Animal Care and Use Committee (IACUC) and met the National Institutes of Health Guide for the Care and Use of Laboratory Animals.
Brain sample extracts
Samples used to develop the method were brain tissue extracts spiked in the laboratory (ex vivo). Precise recovery for these samples could then be calculated based on amount of analyte added. Samples split with the CDC laboratory for method validation were primarily from brain tissue extracts of animals treated with paraquat or MPTP (in vivo) although some (five) samples were ex vivo spikes. These samples were analyzed in this laboratory using the method described and at the CDC laboratory using their analytical protocol (19) also described briefly below.
Sample Preparation
About 10–15 mg of brain tissue were weighed accurately into a 1.5-ml centrifuge tube and 150 μl of 12% acetic acid in water was added. The samples were homogenized by sonication for 20–30 min (Ultrasonic bath, VWR, model 75HT). Centrifuge tubes were put into HP 500 (CEM Mathews NC) microwave vessels (4–6 per vessel) then extracted in a CEM Mars microwave oven for 30 min using 50% of 300W power (parameters for 6 vessels). If more vessels were necessary, 5% power per additional vessel was added. After extraction, both solid plus liquid phases were transferred to Microcon centrifuge filters with a membrane cut off of 10 kDa and were filtered using a refrigerated centrifuge (VWR micro 18R model, West Chester, PA) held at 4°C and 12,000 g for 90 min. Filtrates containing PQ were transferred into limited-volume HPLC vials and stored at −20 °C until analysis. Standard solutions used to create the calibration curves were prepared by adding the appropriate amount of PQ solution to an extract of the biological matrix obtained by extraction of untreated brain tissue using the same microwave protocol as that for the treated samples
Instrumentation
Analytes from tissue extracts were separated using a Waters Alliance HPLC Separation Module 2690 (Waters Corporation, Milford, MA) with gradient elution. The system was equipped with a vacuum degasser and Waters 996 photodiode array detector (PDA). The separation was carried out on ZORBAX RX-C8, 4.6mm × 15 cm, 5 μm column (Agilent Technologies) with RP column guard 4.3 mm × 1 cm. PQ eluted at 4.9 min, MPP+ at 9.4 min and MPTP at 10.1 min as monitored by both PDA and ITMS. A 50 μl sample was injected. Gradient elution was established with a three-solvent system: 0.1 % formic acid in water (A), 0.1 % formic acid in methanol (B), 0.1 % formic acid in acetonitrile (C) (Table 1)
Table 1.
HPLC gradient method optimized to separate PQ, MPTP and MPP+
| Time; min | Flow ml/min | A; % | B; % | C; % |
|---|---|---|---|---|
| 0.00 | 0.3 | 60 | 25 | 15 |
| 5.00 | 0.3 | 50 | 25 | 25 |
| 6.00 | 0.3 | 30 | 25 | 45 |
| 15.00 | 0.3 | 30 | 25 | 45 |
| 16.00 | 0.3 | 60 | 25 | 15 |
| 20.00 | 0.3 | 60 | 25 | 15 |
Eluent A- 0.1 % formic acid in water; Eluent B- 0.1 % formic acid in methanol; Eluent C- 0.1 % formic acid in acetonitrile
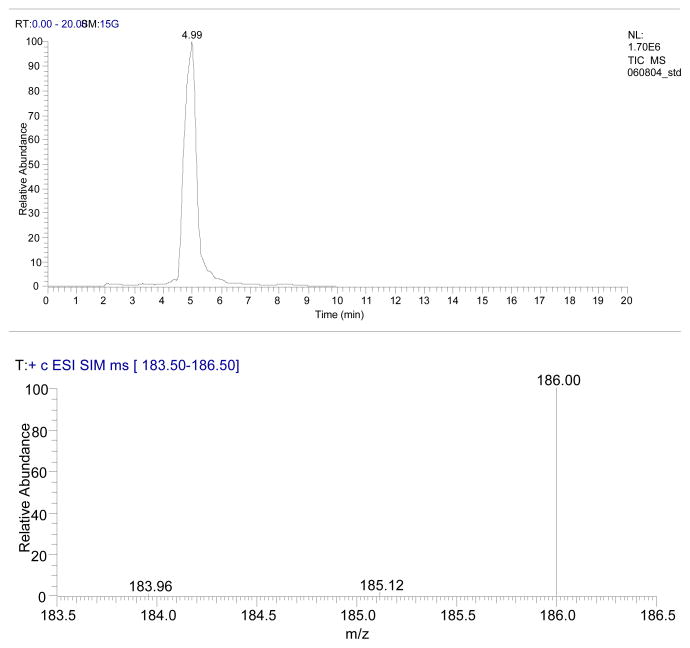
The eluate of the HPLC system was directed into a LCQ Classic ITMS (Thermo Finnigan, San Jose, CA) using an ESI source operated using Xcalibur 1.3 software. MS settings were optimized for detection using a standard solution (1 μg/ml) introduced by infusion at a flow rate of 3 μl/min together with HPLC mobile phase at a flow rate 0.3 ml/min. Briefly, the MS was configured for ESI in the positive ion mode with sheath gas flow rate of 1.4 L/min, heated capillary temperature of 275 °C (250 °C for MPTP/MPP+), and spray voltage of 5.0 kV (4.5 kV for MPTP/MPP+). Parameters like capillary voltage, tube lens offset and octapole voltages were optimized before each analysis. Data acquisition was performed in the selected ion monitoring (SIM) mode (186 m/z for PQ, m/z 174 for MPTP, and m/z 170 for MPP+) with an isolation width of 1 m/z. Chromatogram and spectrum of PQ with isolation width 3m/z (for display purposes only) (183.5 to 186.5) are shown in Figure 2.
Figure 2.
Chromatogram and spectrum of 10ng of paraquat acquired in SIM mode with isolation width 3m/z.
Quantitation was based on integrated peak areas. Integration was performed using Xcalibur software, ICIS peak integration with 15 point smoothing, The minimum peak height for detection had a signal to noise (S/N) ratio of 3. Calibration curves were generated by plotting the peak areas against the amount of analyte (ng in 50-ul injection). The curve was fit using a linear regression algorithm using 1/x as a weighting factor.
Each stock solution of PQ was prepared in water. To minimize matrix effects and ion suppression in electrospray, standard solutions used to create calibration curves were prepared by adding the analyte to an extract of untreated mouse brain tissue using the same microwave protocol as that for the treated samples. A calibration curve was prepared separately for each experiment with an amount of PQ ranging from 2.5 to 240ng/ml (0.1 to 12 ng per 50ul injection; S/N 2 for lowest calibration standard).
As a part of each experiment matrix blanks and sample spikes were prepared. Matrix blanks were prepared by adding 150 μl of the extraction solvent to the untreated mouse brain tissue. Spikes were prepared by addition of 20 μl PQ (0.5 μg/ml) dissolved in a 12% acetic acid in water to untreated brain tissue followed by 130 μl of extraction solvent then extracted together with blanks and treated tissue.
Interlaboratory Comparison
Tissue extracted samples containing unknown amounts of PQ (N=24) as well as spiked extracts (N=8) were split into two aliquots and one aliquot was sent to the Centers for Disease Control and Prevention (CDC) Pesticide Laboratory to evaluate the comparability of the two analytical systems for measuring PQ. Each sample was analyzed using the method described here and using the CDC method [19] briefly described below.
In all 22 samples were analyzed by both laboratories including two blank, five laboratory spikes and 15 sample extracts from treated animals. Sample concentrations ranged from 2.0 to 60.0 ng/ml.
The CDC method employed an analgous HPLC/MS/MS quantization scheme based. Breifly, the highly charged dual quaternary amines were not retained by standard reversed phase columns, but were adequately separated HPLC with an Atlantis® HILIC Silica column. The detection was carried out with a triple quadrupole mass spectrometer (TSQ Quantum Ultra, ThermoFisher Scientific) with an electrospray ionization probe in positive ion mode using multiple reaction monitoring. A direct comparison was made between the results from the two analytical methods producing a linear correlation. The correlation between the two data sets based on a linear regression was 0.943 and the R2 was 0.92.
Results
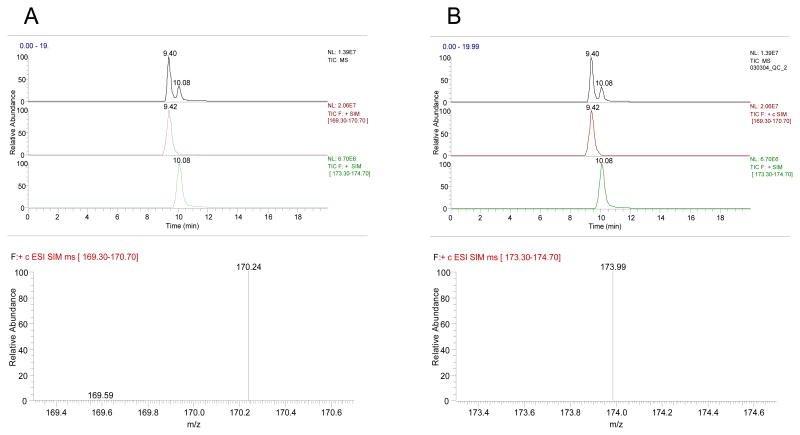
A chromatogram and mass spectrum of PQ (Figure 2) and MPTP/MPP+ (Figure 3) with an isolation width of 3m/z (for display purposes only) are shown. Recovery of the analytes spiked into tissue and extracted using MASE method is summarized in Table 2.
Figure 3.
Chromatograms and spectra of 10 ng of MPTP (panel B) and 10 ng of MPP+ (panel A) in SIM mode. MPP+ elutes at 9.4 min, and has m/z 170; MPTP elutes at 10.1 min, and has m/z of 174.
Table 2.
Solvents and MARS conditions tested together with Recovery of analytes.
| MARS conditions | solvent | MPTP Recovery | MPP+ Recovery | PQ Recovery |
|---|---|---|---|---|
| 20min@40% of 300W | Water | NR | NR | PQ-protein adduct |
| 20min@40% of 300W | Methanol | NR | NR | PQ-protein adduct |
| 20min@40% of 300W | 30% H3PO4 | NRa | NRa | NRa |
| 20min@40% of 300W | 30% Acetic Acid | N/A | N/A | PQ-protein adduct |
| 20min@40% of 300W | 10% Acetic Acid | 61.8% | 78.8% | N/A |
| 20min@50% of 300W | 15%Acetic Acid | 63.5% | 133% | N/A |
| 30min@50% of 300W | 12.5% Acetic Acid | 78% | 97% | 90% |
Tissue dissolved; analytes decomposed
NR= no recovery
Limits of quantitation
A 50 uL injection was used for all analysis The lowest standard concentration utilized in the analysis of PQ, with an S/N > 2 was 2.0 ng/ml for quantitation limit of 100pg. This value was subsequently applied to the amount tissue analyzed to report the overall method detection limit for each sample. The lowest standard used for quantitation of MPP+ and MPTP was 0.8 ng/ml and 0.4 ng/ml respectively for quantitation limits of 40 pg for MPTP and 20 pg MPP.
The method precision for laboratory spikes in matrix extracts was 5.36 % RSD for PQ, 4.89 % for MPP+ and 8.33% for MPTP. To test the accuracy of the analytical method, samples were sent to the pesticide laboratory at CDC. The results from the analysis of the unknown samples agreed very closely with those from the CDC laboratory with 94% agreement among these samples [19].
Discussion
To optimize separation of PQ, MPTP and MPP+ using one method several eluents and HPLC columns were tested. Heptafluorobutyric buffer and either methanol or acetonitrile were all tested as mobile phases with a RP HPLC column These eluents were previously used for analysis of PQ in water samples [14] but good chromatographic separation was not achieved with these eluents with these extracts. Multiple columns, mobile phases and buffers previously described [13,14] were also tried with similar negative results. Finally the addition of 0.1% formic acid with the ZORBAX RX-C8, column resulted in good separation of PQ, MPTP and MPP+.
To optimize MASE extraction protocol of PQ, MPTP and MPP+ from brain tissue several different extraction solvents, microwave protocols and tissue homogenate clean up methods were tested. Before the extraction process from tissue was optimized the stability of standards in solution under microwave extraction conditions was tested. When higher power (600W) was used there was a small peak demonstrating degradation of MPTP. To insure that no degradation or conversion of analytes took place during the microwave extraction process lower, power (300W) setting was used.
Protein adduction
Under some of the aforementioned microwave extraction conditions, there was evidence to suggest protein adduction had occurred. Specifically, a full mass spectral scan produced ions associated with peptides at masses much higher than any of the target analytes. These ions were unlikely to be produced by polymerization both because of the characteristic peptide spectrum produced and the unstable nature of the pesticides being studied.
Analyte Decomposition
Phosphoric acid is frequently used as an extraction solvent for some types of polar or charged analytes being isolated from media such as plasma or tissue [20]. Its ability to remove the analyte from a protein bound state suggested that it would be a logical choice to remove these analytes from tissue. Previous studies have used a lower concentration of this acid for removing similar charged and/or highly polar analytes as part of routine SPE methods [21, 22, 23]. The choice of 30% H3PO4 was made because these charged and polar analytes were being extracted from tissue with a highly lipophylic environment and were thought to be protein bound. Upon addition of H3PO4 the sample turned brown and the tissue decomposed readily. An aliquot of this solution showed no analytes’ mass spectral peaks when analyzed.
Acetic acid extraction
Acetic acid was eventually chosen both because it was more mass spec friendly and as a weaker acid was not likely to digest the tissue sample. Its behavior in the ESI source is well characterized and generally does not overwhelm the analyte ionization process at lower acid concentrations. Optimization of the acetic acid concentration was carried out to find the lowest concentration of acid that would liberate these charged and polar species from the tissue matrix. The lower acetic acid concentration minimized the ESI interferences. In addition the lower acid concentration created less eluent interferences upon injection.
MS operating mode differences
This method utilizes an ion trap mass spectrometer for quantification of the primary analyte ion. During the methods development phase of this work, comparisons between single ion monitoring (SIM) and MS/MS modes were made for the ion trap mass spectrometer. The SIM mode proved to be more sensitive due primarily to analyte ion loss within the mass spectrometer characteristic of ion trap MS/MS experiments. In other applications concomitant matrix ions and the need for analyte confirmation have mandated the use of an MS/MS experiment. A direct comparison was not made between the MS/MS sensitivity from the triple quad instrument used at CDC and the SIM mode experiments from this laboratory although the overall detection limits were very similar ~1 ng/ml for the CDC method and ~ 2 ng/ml for the ion trap SIM mode method from this laboraotory.
Sensitivity difference between MPP+ and MPTP
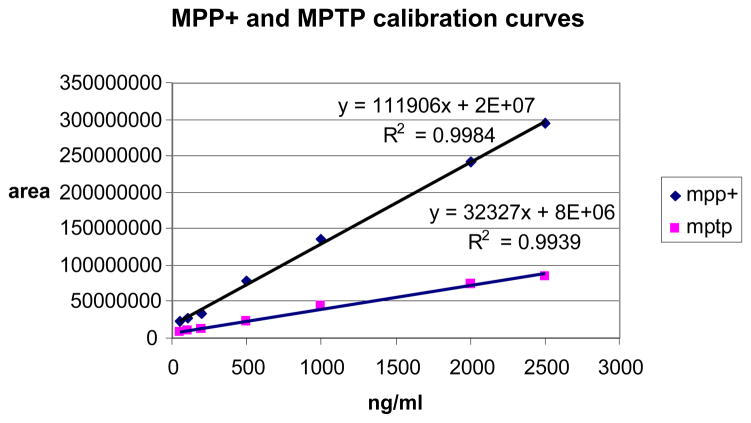
To quantitate the amount of MPTP and MPP+ present in the mouse brain tissue separate calibration curves were prepared with concentration of analytes from 5 to 2500 ng/ml, Fig. 4 S/N for MPP+ was 500 and MPTP was 200 for the lowest calibration standard used in the experiment.
Figure 4.
Calibration curves used to quantitate MPP+ and MPTP concentration in tissue. Injection volume 50ul
Calibration curves for MPTP and MPP+ (Fig 4) showed different response in electrospray ionization for parent (MPTP) and its metabolite. The same concentration gave different intensity in the mass spectrometer. While the structure of each of these compounds is almost identical, the ionization state of each may be the reason for the significant difference in sensitivity (Fig 1). MPP+ is already present in solution as an ion (added as a salt, MPPI) while MPTP has to be ionized in the ESI interface before analysis in the mass spectrometer.
Conclusions
Both PQ and MPTP have been used as models for Parkinson’s disease [5, 6, 7]. The use of those compounds necessitates an analytical method to quantify those analytes in brain tissue. A MASE method was used to extract the analytes from tissue while quantitation was performed by LC/MS. The MASE method allowed for recoveries of 90% for PQ, 97% for MPP+ and 78% for MPTP.
References
- 1.Haley T. Clin Toxicol. 1979;14:1–461. doi: 10.3109/15563657909030112. [DOI] [PubMed] [Google Scholar]
- 2.Liou HH, Tsai MC, Chen CJ, Jeng JS, Chang YC, Chen SY, et al. Neurology. 1997;48:1583–1588. doi: 10.1212/wnl.48.6.1583. [DOI] [PubMed] [Google Scholar]
- 3.Thiruchelvam M, Brockel BJ, Richfield EK, Baggs RB, Cory-Slechta DA. Brain Res. 2000;873:225–234. doi: 10.1016/s0006-8993(00)02496-3. [DOI] [PubMed] [Google Scholar]
- 4.Dinis-Oliveira RJ, Remião F, Carmo H, Duarte JA, Sánchez Navarro A, Bastos ML, Carvalho F. NeuroToxicology. 2006;27:1110–1122. doi: 10.1016/j.neuro.2006.05.012. [DOI] [PubMed] [Google Scholar]
- 5.Betarbet Ranjita, Sherer Todd B, MacKenzie Gillian, Garcia-Osuna Monica, Panov Alexander V, Timothy Greenamyre J. Nat Neurosci. 2000;3:1301–1306. doi: 10.1038/81834. [DOI] [PubMed] [Google Scholar]
- 6.Gorell JM, Johnson MD, Rybicki CC, PhD, Peterson BA, PhD, Richardson EL, PhD, RJ Neurology. 1998;50:1346–1350. doi: 10.1212/wnl.50.5.1346. [DOI] [PubMed] [Google Scholar]
- 7.Meredith GE, Halliday GM, Totterdell S. Parkinsonism & Related Disorders. 2004;10:191–202. doi: 10.1016/j.parkreldis.2004.01.001. [DOI] [PubMed] [Google Scholar]
- 8.Thiruchelvam M, Cory-Slechta D. NeuroToxicology. 2002;23:621–633. doi: 10.1016/s0161-813x(02)00092-x. [DOI] [PubMed] [Google Scholar]
- 9.Perry JC, Da Cunha C, Anselmo-Franci J, Andreatini R, Miyoshi E, Tufik S, et al. Eur J Pharmacol. 2004;484:225–233. doi: 10.1016/j.ejphar.2003.11.029. [DOI] [PubMed] [Google Scholar]
- 10.Cicchetti F, Lapointe N, Roberge-Tremblay A, Saint-Pierre M, Jimenez L, Ficke BW, Gross RE. Neurobiol Dis. 2005;20:360–371. doi: 10.1016/j.nbd.2005.03.018. [DOI] [PubMed] [Google Scholar]
- 11.Kuter K, Smialowska M, Wieronska J, Zieba B, Wardas J, Pietraszek M, Nowak P, Biedka I, Roczniak W, Konieczny J, Wolfarth S, Ossowska K. Brain Res. 2007;1155:196–207. doi: 10.1016/j.brainres.2007.04.018. [DOI] [PubMed] [Google Scholar]
- 12.McCormack AL, Thiruchelvam M, Manning-Bog AB, Thiffault C, Langston JW, Cory-Slechta DA, Di Monte DA. Neurobiol Dis. 2002;10:119–127. doi: 10.1006/nbdi.2002.0507. [DOI] [PubMed] [Google Scholar]
- 13.Corasaniti MT. J Chromatogr. 1990;527:189–195. doi: 10.1016/s0378-4347(00)82099-x. [DOI] [PubMed] [Google Scholar]
- 14.Castro R, Moyano E, Galceran MT. J Chromatogr A. 2001;914:111–121. doi: 10.1016/s0021-9673(01)00523-4. [DOI] [PubMed] [Google Scholar]
- 15.Mutavdžić D, Babić S, Horvat AJM, Kaštelan-Macan M. Trends in Anal Chem. 2007;26:1062–1075. [Google Scholar]
- 16.Kaufmann B, Christen P. Phytochem Anal. 2002;13:105–113. doi: 10.1002/pca.631. [DOI] [PubMed] [Google Scholar]
- 17.Prasad Kavita, Tarasewicz Elizabeth, Mathew Jason, Ohman Strickland Pamela A, Buckley Brian, Richardson Jason R, Richfield Eric K. Exp Neurol. 2009;215:358–367. doi: 10.1016/j.expneurol.2008.11.003. [DOI] [PMC free article] [PubMed] [Google Scholar]
- 18.Prasad K, Winnik B, Thiruchelvam M, Buckley B, Mirochnitchenko O, Ritchfield E. Environ Health Perspect. 2007;115:1448–1453. doi: 10.1289/ehp.9932. [DOI] [PMC free article] [PubMed] [Google Scholar]
- 19.Whitehead Ralph D, Jr1, Angela Montesano M, 1, Jayatilaka Nayana K, 1, Buckley Brian, Winnik Bozena, Needham Larry L, Barr Dana B. Method for measurement of the quaternary amine compounds paraquat and diquat in human urine using high-performance liquid chromatography-tandem mass spectrometry. J Chrom A. doi: 10.1016/j.jchromb.2009.09.029. submitted. [DOI] [PubMed] [Google Scholar]
- 20.Strelevitz Timothy J, Linhares Michael C. J Chromatogr B. 1996;675:243–250. doi: 10.1016/0378-4347(95)00354-1. [DOI] [PubMed] [Google Scholar]
- 21.Doerge DR, Fogle CM, Paile MG, McCullagh M, Bajic S. Rapid Commun Mass Spectrom. 2000;14:619–623. doi: 10.1002/(SICI)1097-0231(20000430)14:8<619::AID-RCM916>3.0.CO;2-2. [DOI] [PubMed] [Google Scholar]
- 22.Wille Sarah MR, Maudens Kristof E, Van Peteghem Carlos H, Lamber Willy EE. J Chromatogr A. 2005;1098:19–29. doi: 10.1016/j.chroma.2005.08.059. [DOI] [PubMed] [Google Scholar]
- 23.Shinozuka T, Terada M, Tanaka E. Forensic Science International. 2006;162:108–112. doi: 10.1016/j.forsciint.2006.03.038. [DOI] [PubMed] [Google Scholar]


