Abstract
Glycyrrhetinic acid (GA), one of the main constituents of the famous Chinese medicinal herb and food additive licorice (Glycyrrhiza uralensis Fisch), has been indicated to possess potential anticancer effects and is widely utilized in hepatocellular carcinoma (HCC) targeted drug delivery systems (TDDS) due to the highly expressed target binding sites of GA on HCC cells. This study found that GA reduced the cell viability, increased the release of lactate dehydrogenase, and enhanced the expression of Bax, cleaved caspase-3, and LC3-II in HCC cells. The GA-triggered autophagy has been further confirmed by monodansylcadaverine staining as well as transmission electron microscopy analysis. The cell viability was obviously decreased whereas the expression of cleaved caspases was significantly increased when inhibition of autophagy by choloroquine or bafilomycin A1, suggesting that GA triggered a protective autophagy. Extracellular regulated protein kinase (ERK) was activated after treatment with GA in HepG2 cells and pretreatment with U0126 or PD98059, the MEK inhibitors, reversed GA-triggered autophagy as evidenced by decreased expression of LC3-II and formation of autophagosomes, respectively. Furthermore, GA-induced cell death and apoptosis were enhanced after pretreatment with PD98059. This is the first report that GA triggers a protective autophagy in HCC cells via activation of ERK, which might attenuate the anticancer effects of GA or chemotherapeutic drugs loaded with GA-modified TDDS.
Keywords: glycyrrhetinic acid, autophagy, hepatocellular carcinoma, ERK, protective
Introduction
Hepatocellular carcinoma (HCC) is the third cause of cancer-related death in the world, and more than 110,000 patients are diagnosed in China every year.1,2 Although surgical resection and transplantation have significantly improved the survival in patients with small tumors, the prognosis of HCC for late-stage diseases remains very poor.3 Besides, most patients presenting with advanced disease upon diagnosis are not eligible for surgery and have to seek drug treatment. The current chemotherapeutics for HCC, such as sorafenib and doxorubicin, are rather limited due to severe side effects or lack of efficacy.4,5 Therefore, improvement of chemotherapeutic properties is an urgent need. The HCC targeted drug delivery system (TDDS), which specifically delivers chemotherapeutic drugs to HCC and subsequently reduces the side effects, is a new strategy for HCC treatment.6,7
Licorice is extensively utilized as a flavoring and sweetening agent, as well as a hepatic-protective drug in the tobacco, food, and pharmaceutical industries.8 It has various bioactivities and mainly contains triterpene saponins, especially glycyrrhizic acid and its aglycone glycyrrhetinic acid (GA).9,10 Nowadays, GA has been demonstrated to have potential anticancer effects by inhibition of proliferation, induction of apoptosis and cell cycle arrest, and blockage of metastasis in of cancer cell lines, such as HCC HepG2 cells,11 breast cancer MCF7 cells,12 and colon cancer HT-29 cells.13 Furthermore, GA has been widely utilized in HCC TDDS due to the highly expressed target binding sites in liver cells,14 and numerous HCC TDDS that utilize GA have been developed, such as GA-modified alginate doxorubicin nanoparticles,7 GA-modified chitosan 5-fluorouracil nanoparticles,15 GA-modified galactosyl-chitosan 5-fluorouracil nanoparticles,16 and GA-modified liposome docetaxel nanoparticles.17 These nanoparticles can not only obviously increase the HCC accumulation of chemotherapeutic drugs but also decrease the dosage and side effects of chemotherapeutics.7,16
Autophagy, also termed as self-cannibalization, is a mechanism that involves cell degradation of unnecessary or dysfunctional cellular components through the actions of lysosomes.18,19 In the initiation of tumors, autophagy inhibits tumor formation by degradation of damaged organelles or proteins.20 However, after tumor formation, the tumors can utilize the autophagy as a survival mechanism to ensure growth advantage of cancer cells in a hypoxia, starvation, and acid environment.21 Herein, we confirmed that GA induced autophagy in HCC cells by activation of extracellular regulated protein kinases (ERK), and inhibition of autophagy or ERK activation, GA-induced proliferative inhibition, and apoptosis were enhanced. Our study suggested that the GA triggered autophagic effect may attenuate the anticancer efficiency of GA or chemotherapeutic drugs loaded with GA-modified TDDS and requires further evaluation.
Materials and Methods
Reagents
GA was obtained from National Institutes for Food and Drug Control (Shenzhen, Guangdong, China). Monodansylcadaverine (MDC), chloroquine (CQ), bafilomycin A1 (BAF), and dimethyl sulfoxide (DMSO) were obtained from Sigma (St. Louis, MO, USA). PD98059 and U0126 were purchased from Beyotime Biotechnology Corp. (Shanghai, China). A Cytotoxicity Detection Kit (lactate dehydrogenase, LDH) was obtained from Roche Diagnostics (Mannheim, Germany). 3-(4,5-Dimethyl-2-thiazolyl)-2,5-diphenyltetrazolium bromide (MTT) was purchased from Molecular Probes (Eugene, OR, USA). Dulbecco’s modified Eagle’s medium (DMEM) medium, fetal bovine serum (FBS), antibiotics (100 U/mL penicillin and 100 mg/mL streptomycin), and phosphate-buffered saline (PBS) were purchased from Gibco (Carlsbad, CA, USA). Primary antibodies, that is, microtubule-associated protein light-chain 3 (LC3), ERK, p-ERK (Thr202/Tyr204), Bax, cleaved caspase-3, cleaved caspase-9, and GAPDH, and the secondary antibodies were purchased from Cell Signaling Technology Inc. (Beverly, MA, USA).
Cell Culture
Hepatocellular carcinoma HepG2 and Hep3B cells were obtained from the American Type Culture Collection (ATCC, Rockville, MD, USA) and cultured in a DMEM supplemented with 10% (v/v) FBS and 1% (v/v) antibiotics (100 U/mL penicillin, 100 μg/mL streptomycin). Cells were cultured in a 5% CO2 incubator at 37 °C. Exponentially growing cells were used in the experiments.
MTT Assay
Cell viability was examined by the MTT assay. Exponentially growing HepG2 cells were seeded onto 96-well plates. Upon reaching approximately 70–80%, cells were incubated with a series of concentrations of the test compounds. Then, cell viability was determined by incubating the cells in a medium containing 1 mg/mL MTT for 4 h before 100 μL of DMSO was added to solubilize the formazan. The absorbance at 570 nm was measured with a microplate reader (PerkinElmer, 1420 Multilabel Counter Victor3, Wellesley, MA, USA).
LDH Assay
HepG2 cells were cultured to 70–80% concentration on 96-well plates and then treated with the indicated concentrations of GA for 24 h. The cellular toxicity was studied by detection of the LDH released into the incubation medium by the cytotoxicity detection kit according to the manufacturer’s instructions.
MDC Staining
The autofluorescent agent MDC (excitation, 360 nm; emission, 535 nm) was utilized to evaluate the abundance of acidic vesicular organelles (AVOs) in the cells because it can accumulate in AVOs and exhibit fluoresced bright green dots.22 For qualitative analysis, cells were seeded onto 96-well plates, treated with indicated concentrations of GA for 24 h and stained with 50 μM MDC in PBS for 30 min. Cells were washed with PBS three times and immediately analyzed using In Cell Analyzer 2000 imaging system (GE Healthcare, Uppsala, Sweden). For qualitative analysis, cells were seeded onto 24-well plates and treated with a series of concentrations of the test compounds. Then, cells were stained with 50 μM MDC in PBS for 30 min. After washed with PBS three times, the mean fluorescence intensities of the cells were determined with a flow cytometer (Becton Dickinson FACS CantoTM, BD Biosciences, San Jose, USA).
Transmission Electron Microscopy (TEM) Assay
After treatment or not with 40 μM GA for 24 h, the cells were harvested and washed with PBS and then fixed in ice-cold 2.5% glutaraldehyde for 1 h. After being washed with PBS three times for 15 min, cells were postfixed in 1% OsO4 for 1 h and stained with 2% uranyl acetate for 30 min at room temperature. Then cells were dehydrated through a graded series of ethanol (50, 70, and 90%) for 15 min each, ethanol (100%) for 20 min, and 100% acetone for 20 min, respectively, and embedded in Epon812. Ultrathin sections (120 nm) were obtained before staining with 2% uranyl acetate for 20 min and lead citrate for 5 min and then examined using a TECNAI 10 transmission electron microscope (Phillips, Eindhoven, The Netherlands) at high voltage of 80 kV.
Western Blot Analysis
Proteins were extracted with a radioimmunoprecipitation lysis buffer containing 1% phenylmethanesulfonyl fluoride and 1% protease inhibitor cocktail for 25 min. The protein concentrations were measured with a BCA Protein Assay Kit (Pierce, Rockford, IL, USA). Equal amounts of proteins were separated using sodium dodecyl sulfate–polyacrylamide gel electrophoresis and transferred to a polyvinylidene fluoride membrane, which was blocked in 5% nonfat dried milk for 1 h. The membranes were probed with specific primary antibodies against LC3, p-ERK (Thr202/Tyr204), ERK, Bax, cleaved caspase-3, cleaved caspase-9, and GAPDH followed by incubation with the corresponding secondary antibodies. The specific protein bands were detected with an ECL advanced Western blot analysis detection kit (BD Biosciences, Bedford, MA, USA).
Statistical Analysis
The mean ± standard deviation (SD) was determined for each group. Statistical analysis was performed with one-way analysis of variance (ANOVA) and Tukey’s test. Differences were considered statistically significant for (∗) P < 0.05 and (∗∗) P < 0.01.
Results
GA Reduced the Cell Viability, Enhanced LDH Release, and Increased the Expression of Bax, Cleaved Caspase-3, and LC3-II in HCC Cells
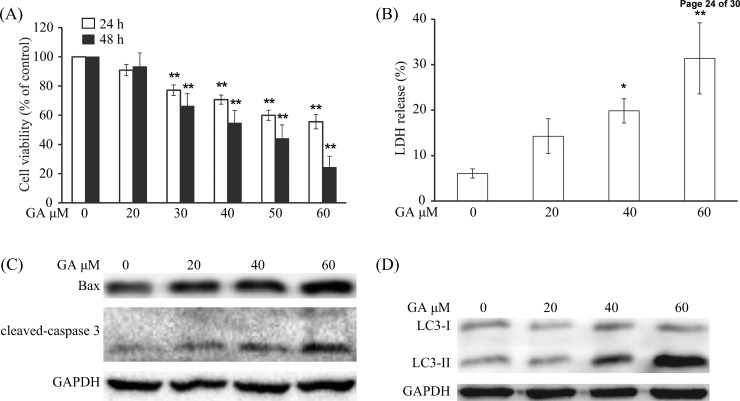
First, the MTT assay was used to evaluate the cell viability. As shown in Figure 1A, the cell viability of HepG2 cells was concentration- and time-dependently reduced after GA treatment. After treatment with 40 μM GA for 24 and 48 h, 71 and 55% HepG2 cells survived, respectively. We also found that GA increased LDH release into the medium in a concentration-dependent manner (Figure 1B), indicating that necrosis has occurred.23 The apoptosis-related proteins, such as Bax and cleaved caspase-3, were also obviously enhanced after GA treatment (Figure 1C), which was similar to a previous study.11 Besides, the expression of LC3-II, which correlates with the number of autophagosomes,24 was concentration-dependently up-regulated after GA treatment (Figure 1D).
Figure 1.
GA reduced the cell viability, enhanced LDH release, and increased the expression of Bax, cleaved caspase-3, and LC3-II in HCC cells. (A) Cells were treated with indicated concentrations of GA for 24 or 48 h. The cell viability was evaluated by MTT assay. (∗) P < 0.05 and (∗∗) P < 0.01, compared with 0 μM GA treatment. (B) Cells were treated with 0, 20, 40, and 60 μM GA for 24 h, and the LDH assay was performed according to the manufacturer. (∗) P < 0.05 and (∗∗) P < 0.01, compared with 0 μM GA treatment. (C, D) HepG2 cells were treated with indicated dosages of GA for 24 h. Cell extracts were analyzed for the expression levels of Bax, cleaved caspase-3, and LC3 by Western blot analysis.
GA Triggered Autophagy in HCC Cells
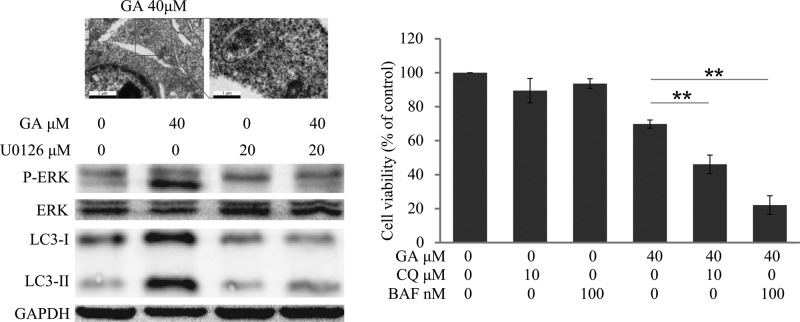
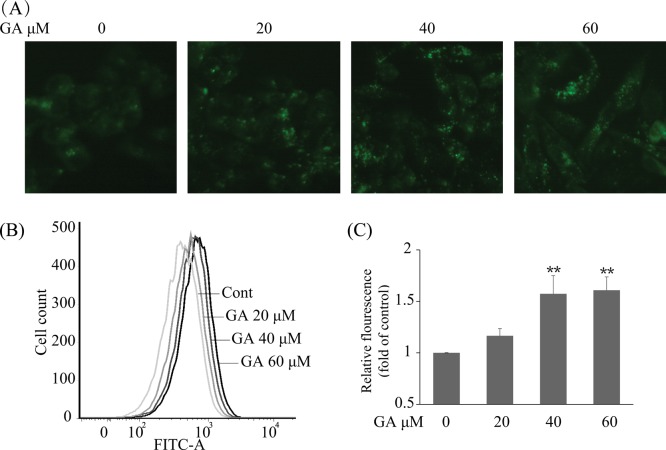
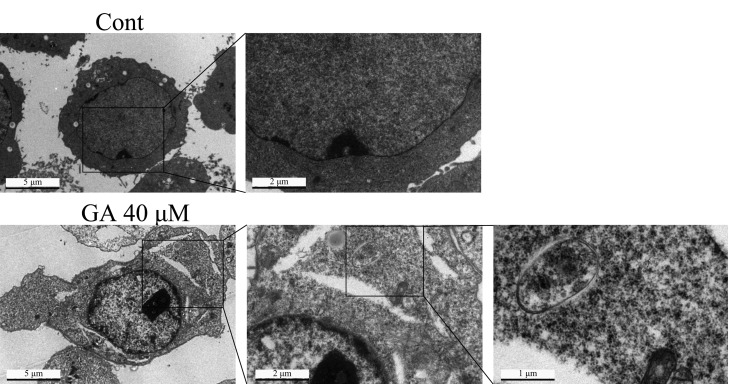
To further confirm GA-triggered autophagy in HepG2 cells, multiple approaches were used. As AVOs are a hallmark of autophagy,25 we initially evaluated the generation of AVOs by autofluorescent agent MDC, which accumulates in AVOs and fluoresces bright green dots.22,26 The formation of AVOs in HepG2 cells was enhanced after treatment with various concentrations of GA for 24 h as evidenced by obvious green dot formation, whereas the control cells exhibited faint fluorescence only (Figure 2A). The GA-mediated AVO accumulation was also quantified using flow cytometry; GA concentration-dependently increased fluorescence intensity in HepG2 cells after 24 h of treatment. The 40 μM GA-treated cells exhibited an approximately 1.57-fold increase in fluorescence intensity compared with that of the control group (Figure 2B,C), which was consistent with morphological observations, suggesting that GA truly induces AVO production in HepG2 cells. Another traditional and classical method for autophagy observation is transmission electron microscopy (TEM) analysis.27 Herein, the TEM experiment was performed to confirm the formation of AVOs after GA treatment in HepG2 cells. As shown in Figure 3, more AVOs were developed in the GA-treated group than in the control group. To further study GA-induced autophagic flux in HepG2 cells, two autophagy inhibitors, that is, chloroquine (CQ) and bafilomycin A1 (BAF), which cause accumulation of LC3-II protein by blocking the fusion between autophagosome and lysosome or suppressing the acidification of the lysosome,27 were used. After pretreatment with CQ (10 μM) or BAF (100 nM), the GA-induced up-regulation of LC3-II was more prominent than in nontreated cells (Figure 4B), indicating that GA induces autophagic flux in HepG2 cells. GA-triggered autophagy was also confirmed in HCC Hep3B cells as evidenced by GA concentration-dependently increased expression of LC3-II (Supporting Information Supplemental Figure 1). Taken together, these data collectively indicate that GA triggers autophagy in HCC cells.
Figure 2.
GA -triggered autophagy in HepG2 cells by MDC staining. (A) HepG2 cells were treated with GA at indicated concentrations for 24 h. The cells were collected, washed with PBS, and incubated with 50 μM MDC probe for 30 min. AVOs (bright green dots) in HepG2 cells were imaged with a fluorescent microscope. (B) The treated cells were stained with 50 μM MDC probe for 30 min, collected, washed, and resuspended. The intracellular fluorescence was quantified using flow cytometry. (C) Statistical result of three independent tests of (B). Data represent the mean ± SD, and one-way ANOVA was performed to evaluate the significance of different treatment. (∗) P < 0.05 and (∗∗) P < 0.01, compared with 0 μM GA treatment.
Figure 3.
GA-triggered autophagy in HepG2 cells by TEM observation. HepG2 cells were treated with 40 μM GA or vehicle control for 24 h. Cells were collected, fixed, and observed under a TEM.
Figure 4.

GA-triggered autophagic flux in HepG2 cells by Western blot analysis. HepG2 cells were incubated in 40 μM GA for 24 h with or without pretreatment of CQ (10 μM, 1 h) or BAF (100 nM, 1 h). Cell extracts were analyzed for LC3 expression levels using Western blot analysis.
GA-Triggered Protective Autophagy in HCC Cells
Natural compound-induced autophagy may be either pro-survival or pro-death in cancer therapy.28,29 Herein, to clarify the effect of GA-induced autophagy in HCC cells, we evaluated the GA-mediated cell survival and apoptosis in cells pretreated with the autophagy inhibitors CQ (10 μM, 1 h) or BAF (100 nM, 1 h). MTT results indicated that survival rates of GA-treated HepG2 cells were decreased from 69.79 to 46.09 or 22.13% via pretreatment with CQ or BAF, respectively (Figure 5A). Western blot analysis indicated that pretreatment with CQ or BAF obviously enhanced the protein levels of cleaved caspase-3 and cleaved caspase-9 in HepG2 cells (Figure 5B). Besides, the cell viability of Hep3B cells was decreased from 63.47% (GA only) to 52.85% (GA + CQ) or 53.47% (GA + BAF), respectively (Supplemental Figure 2). Taken together, these data suggest that GA triggers a protective autophagy in HCC cells.
Figure 5.
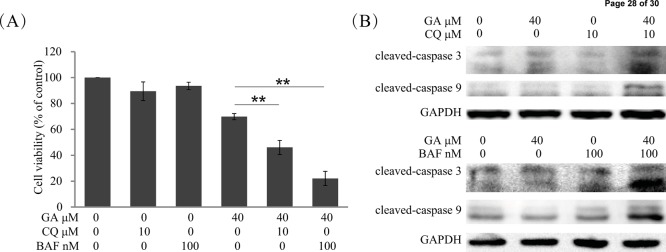
Inhibition of autophagy enhanced GA-induced cell death and apoptosis in HepG2 cells. (A) HepG2 cells were treated with indicated concentrations of GA for 24 h with or without pretreatment of CQ (10 μM, 1 h) or BAF (100 nM, 1 h). Cell viability was evaluated by MTT assay. (∗) P < 0.05 and (∗∗) P < 0.01. (B) HepG2 cells were treated with 40 μM GA for 24 h with or without pretreatment of CQ (10 μM, 1 h) or BAF (100 nM, 1 h). Cell extracts were analyzed for the levels of cleaved caspase-3 and cleaved caspase-9 by Western blot analysis.
GA-Triggered Autophagy by Activation of ERK in HepG2 Cells
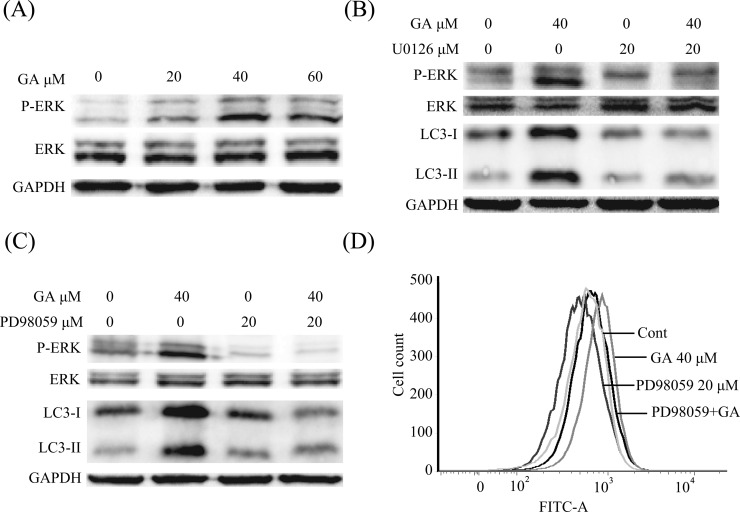
To further determine the molecular mechanism of GA-triggered autophagy induction in HepG2 cells, we evaluated the activation status of ERK signaling, a critical pathway of autophagy induction.30,31 Phosphorylated ERK (p-ERK) and total ERK were assayed after cells had been treated with different concentrations of GA. As shown in Figure 6A, expression of p-ERK was concentration-dependently increased after treatment with GA for 24 h, indicating that GA activated ERK in HepG2 cells. In addition, we examined whether the activated ERK was critical for GA-triggered autophagy. Cells were pretreated with the MEK inhibitor (U0126 or PD98059), the p-ERK, as well as the GA-induced expression of LC3-II was decreased (Figure 6B,C). Furthermore, the GA-induced AVO formation was also decreased after pretreatment with PD98059 (Figure 6D).
Figure 6.
GA-triggered autophagy in HepG2 cells by activation of ERK pathway. (A) HepG2 cells were incubated with the indicated concentrations of GA for 24 h. Cell extracts were analyzed for phosphorylated ERK (Thr202/Tyr204), total ERK, and LC3 expression by Western blot analysis. (B, C) HepG2 cells were incubated with 40 μM GA for 24 h with or without pretreatment of U0126 (20 μM, 1 h) or PD98059 (20 μM, 1 h). Cell extracts were analyzed for phosphorylated ERK (Thr202/Tyr204), total ERK, and LC3-II expression by Western blot analysis. (D) Treated cells were stained with 50 μM MDC probe for 30 min, collected, washed, and resuspended. The intracellular fluorescence was quantified using flow cytometry.
Inhibition of ERK Enhanced GA-Induced Cell Death and Apoptosis
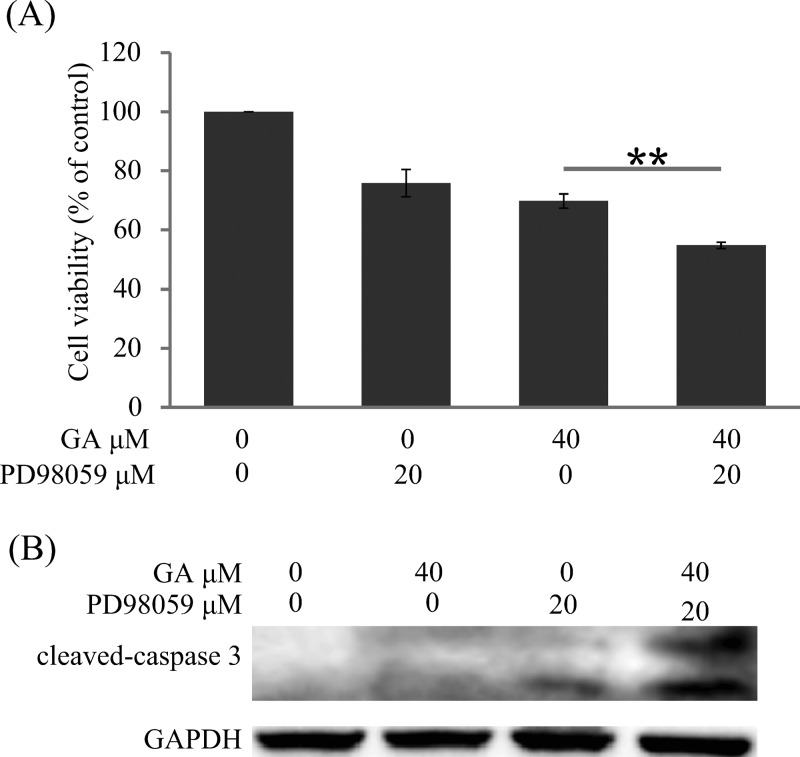
We further studied the effects of the ERK pathway in GA-induced cell death and apoptosis. As shown in Figure 7A, the cell viability of HepG2 was 69.79% after treatment with GA alone, whereas it decreased to 54.78% after combined treatment with PD98059 and GA. Furthermore, the expression of cleaved caspase-3 was more obvious in the PD98059 + GA group compared with the GA alone group (Figure 7B).
Figure 7.
Inhibition of ERK enhanced GA-induced cell death and apoptosis. (A) HepG2 cells were treated with 40 μM GA for 24 h with or without pretreatment of PD98059 (20 μM, 1 h). The cell viability was evaluated by MTT assay. (∗) P < 0.05 and (∗∗) P < 0.01. (B) HepG2 cells were incubated with 40 μM GA for 24 h with or without pretreatment of PD98059 (20 μM, 1 h). Cell extracts were analyzed for cleaved caspase-3 expression by Western blot analysis.
Discussion
Targeted drug treatment is a novel promising strategy for HCC, which specifically delivers chemotherapeutic drugs to HCC and results in increased local concentrations and reduced side effects.32 GA is an excellent ligand for HCC-targeting due to the abundant binding sites on the cellular membrane of liver cells.14 Besides, GA exhibits potential anti-HCC effects by inhibition of proliferation and induction of apoptosis and cell cycle arrest.11 Herein, we demonstrated that GA induced cell viability reduction, LDH release, and up-regulation of Bax and cleaved caspase-3, indicating that necrosis and apoptosis may contribute to GA-induced cell death. We also found, for the first time, that GA triggered the autophagic response in HCC cells as evidenced by obvious up-regulation of AVO formation by MDC staining and TEM detection, and by elevation of LC3-II protein expression by Western blot analysis and that cotreatment of GA and CQ or BAF caused an up-regulation of LC3-II protein expression.
The effects of autophagy, pro-survival or pro-death, are controversial in cancer.33 In the progress of cancer cells, autophagy can be activated by hypoxia, starvation, and acid environment and act as a survival mechanism to protect cancer cells from those adverse environments.21 However, excessive autophagy may result in cancer cell death.34 The functions of autophagy induced by diverse compounds are also distinguishing.35 For example, resveratrol and quercetin can induce a pro-survival autophagy in esophageal squamous carcinoma cells and gastric cancer cells, respectively,28,36 whereas silibinin induces a pro-death autophagy in fibrosarcoma cells.29 In the present study, we have demonstrated that GA triggered a protective autophagy in HCC HepG2 and Hep3B cells, as evidenced by the enhanced proliferative inhibition and/or apoptosis after blocking autophagy, which may be a mechanism for attenuating its anticancer effects or GA-modified TDDS loaded chemotherapeutic drugs. Besides, it has been reported that some nanoparticles can also induce protective autophagy in cancer cells.37 These may partially explain why the GA-modified liposome nanoparticles loaded with docetaxel (0.7 μg/mL docetaxel) presented fewer antiproliferative effects compared with docetaxel alone17 and why GA-modified sulfated chitosan nanoparticles loaded with doxorubicin (0.0039, 0.0156, and 0.0625 μg/mL of doxorubicin) showed fewer antiproliferative effects compared with doxorubicin alone in HepG2 cells.38 Thus, the autophagic effects might be a mechanism attenuating anticancer effects. In terms of cancer treatment by GA-modified TDDS, combination of an autophagy inhibitor might be a valuable strategy for TDDS-based HCC therapy.
Recently, accumulating studies have indicated the activation of ERK results in autophagic induction.39 The present study showed that ERK was activated after GA treatment. ERK activity was remarkably inhibited by pretreatment with MEK inhibitor (U0126 or PD98059), and the autophagic protein marker LC3-II and the formation of AVOs were decreased accordingly, indicating that GA, at least partially, induced autophagy in HepG2 cells by activation of ERK. It is notable that inhibition of ERK activity by U0126 or PD98059 and the GA-induced protein expression of LC3-II and AVO formation were still slightly observed, compared with control group (Figure 6B–D), indicating other pathways might also participate in GA-induced autophagy, for example, the Akt/mammalian target of rapamycin pathway, which is one of the most important regulatory pathways for autophagy.40 Moreover, as the Raf-MEK-ERK pathway (Raf activates MEK, which then activates ERK) is a classical signaling in cells,39 how GA activates ERK warrants further study.
In summary, GA triggered a protective autophagy in HCC cells via activation of ERK, which might attenuate the anticancer effects of GA or GA-modified nanoparticle-loaded chemotherapeutics. The combined treatment with autophagy inhibitor and GA-modified nanoparticle-loaded anticancer drugs might be a promising strategy for HCC therapy.
Acknowledgments
We thank Dr. Xue-Nong Zhang for his kindly help in doing the experiments and the Core Facilities (Imaging Facility), School of Medicine, Zhejiang University, for our TEM assay.
Glossary
Abbreviations Used
- ANOVA
analysis of variance
- AVOs
acidic vesicular organelles
- BAF
bafilomycin A1
- CQ
chloroquine
- DMEM
Dulbecco’s modified Eagle’s medium
- DMSO
dimethyl sulfoxide
- ERK
extracellular regulated protein kinases
- FBS
fetal bovine serum
- GA
glycyrrhetinic acid
- HCC
hepatocellular carcinoma
- LC3
microtubule-associated protein light-chain 3
- LDH
lactate dehydrogenase
- MDC
monodansylcadaverine
- MTT
3-(4,5-dimethyl-2-thiazolyl)-2,5-diphenyltetrazolium bromide
- PBS
phosphate-buffered saline
- p-ERK
phosphorylated of ERK
- SD
standard deviation
- TDDS
targeted drug delivery system
- TEM
transmission electron microscopy
Supporting Information Available
Supplemental Figure 1. GA-triggered autophagy in Hep3B cells. Hep3B cells were treated with indicated concentrations of GA for 24 h. Cell extracts were analyzed for the expression of LC3 using Western blot analysis. Supplemental Figure 2. Inhibition of autophagy-enhanced GA-induced cytotoxicity in Hep3B cells. Hep3B cells were treated with indicated concentrations of GA for 24 h with or without pretreatment of CQ (10 μM, 1 h) or BAF (100 nM, 1 h). The cell viability was evaluated by MTT assay. (∗) P < 0.05 and (∗∗) P < 0.01. This material is available free of charge via the Internet at http://pubs.acs.org.
This work was supported by the Macao Science and Technology Development Fund (074/2012/A3 and 070/2013/A) and the Research Fund of the University of Macau (MRG013/WYT/2013/ICMS, MRG008/LJJ2014/ICMS, and CPG2014-00012-ICMS). Y.-G.T. is supported by the National Cancer Institute of the National Institutes of Health under Award R00CA138914 and by the National Natural Science Foundation under Grant 81372216.
The authors declare no competing financial interest.
Funding Statement
National Institutes of Health, United States
Supplementary Material
References
- Parkin D. M.; Bray F.; Ferlay J.; Pisani P. Estimating the world cancer burden: Globocan 2000. Int. J. Cancer 2001, 94, 153–156. [DOI] [PubMed] [Google Scholar]
- Chen W. Q.; Zheng R. S.; Zhang S. W. Liver cancer incidence and mortality in China, 2009. Chin. J. Cancer 2013, 32, 162–169. [DOI] [PMC free article] [PubMed] [Google Scholar]
- Siegel R.; Naishadham D.; Jemal A. Cancer statistics for Hispanics/Latinos, 2012. CA Cancer J. Clin. 2012, 62, 283–298. [DOI] [PubMed] [Google Scholar]
- Zhang Y.-W.; Shi J.; Li Y.-J.; Wei L. Cardiomyocyte death in doxorubicin-induced cardiotoxicity. Arch. Immunol. Ther. Exp. 2009, 57, 435–445. [DOI] [PMC free article] [PubMed] [Google Scholar]
- Llovet J. M.; Ricci S.; Mazzaferro V.; Hilgard P.; Gane E.; Blanc J. F.; de Oliveira A. C.; Santoro A.; Raoul J. L.; Forner A.; Schwartz M.; Porta C.; Zeuzem S.; Bolondi L.; Greten T. F.; Galle P. R.; Seitz J. F.; Borbath I.; Haussinger D.; Giannaris T.; Shan M.; Moscovici M.; Voliotis D.; Bruix J. Sorafenib in advanced hepatocellular carcinoma. N. Engl. J. Med. 2008, 359, 378–390. [DOI] [PubMed] [Google Scholar]
- Han J. H.; Oh Y. K.; Kim D. S.; Kim C. K. Enhanced hepatocyte uptake and liver targeting of methotrexate using galactosylated albumin as a carrier. Int. J. Pharm. 1999, 188, 39–47. [DOI] [PubMed] [Google Scholar]
- Zhang C.; Wang W.; Liu T.; Wu Y.; Guo H.; Wang P.; Tian Q.; Wang Y.; Yuan Z. Doxorubicin-loaded glycyrrhetinic acid-modified alginate nanoparticles for liver tumor chemotherapy. Biomaterials 2012, 33, 2187–2196. [DOI] [PubMed] [Google Scholar]
- Shibata S. A drug over the millennia: pharmacognosy, chemistry, and pharmacology of licorice. Yakugaku Zasshi 2000, 120, 849–862. [DOI] [PubMed] [Google Scholar]
- Kao T.-C.; Wu C.-H.; Yen G.-C. Bioactivity and potential health benefits of licorice. J. Agric. Food Chem. 2014, 62, 542–553. [DOI] [PubMed] [Google Scholar]
- Yo Y.-T.; Shieh G.-S.; Hsu K.-F.; Wu C.-L.; Shiau A.-L. Licorice and licochalcone-A induce autophagy in LNCaP prostate cancer cells by suppression of Bcl-2 expression and the mTOR pathway. J. Agric. Food Chem. 2009, 57, 8266–8273. [DOI] [PubMed] [Google Scholar]
- Satomi Y.; Nishino H.; Shibata S. Glycyrrhetinic acid and related compounds induce G1 arrest and apoptosis in human hepatocellular carcinoma HepG2. Anticancer Res. 2005, 25, 4043–4047. [PubMed] [Google Scholar]
- Huiling L.; Zhang Z.; Qinian W.; Huang M.; Huang W.; Zhang D.; Fengyi Y. 18β-glycyrrhetinic acid-induced apoptosis and relation with intracellular Ca2+ release in human breast carcinoma cells. Chin.–Germ. J. Clin. Oncol. 2004, 3, 137–140. [Google Scholar]
- Csuk R.; Schwarz S.; Siewert B.; Kluge R.; Ströhl D. Synthesis and antitumor activity of ring A modified glycyrrhetinic acid derivatives. Eur. J. Med. Chem. 2011, 46, 5356–5369. [DOI] [PubMed] [Google Scholar]
- Negishi M.; Irie A.; Nagata N.; Ichikawa A. Specific binding of glycyrrhetinic acid to the rat liver membrane. Biochim. Biophys. Acta–Biomembranes 1991, 1066, 77–82. [DOI] [PubMed] [Google Scholar]
- Cheng M.; Gao X.; Wang Y.; Chen H.; He B.; Xu H.; Li Y.; Han J.; Zhang Z. Synthesis of glycyrrhetinic acid-modified chitosan 5-fluorouracil nanoparticles and its inhibition of liver cancer characteristics in vitro and in vivo. Mar. Drugs 2013, 11, 3517–3536. [DOI] [PMC free article] [PubMed] [Google Scholar]
- Cheng M.; Gao X.; Wang Y.; Chen H.; He B.; Li Y.; Han J.; Zhang Z. Synthesis of liver-targeting dual-ligand modified GCGA/5-FU nanoparticles and their characteristics in vitro and in vivo. Int. J. Nanomed. 2013, 8, 4265. [DOI] [PMC free article] [PubMed] [Google Scholar]
- Li J.; Xu H.; Ke X.; Tian J. The anti-tumor performance of docetaxel liposomes surface-modified with glycyrrhetinic acid. J. Drug Targ. 2012, 20, 467–473. [DOI] [PubMed] [Google Scholar]
- Jiang P.; Mizushima N. Autophagy and human diseases. Cell Res. 2014, 24, 69–79. [DOI] [PMC free article] [PubMed] [Google Scholar]
- Yang Z.; Klionsky D. J. Eaten alive: a history of macroautophagy. Nat. Cell Biol. 2010, 12, 814–822. [DOI] [PMC free article] [PubMed] [Google Scholar]
- Mathew R.; White E. Why sick cells produce tumors: the protective role of autophagy. Autophagy 2007, 3, 502–505. [DOI] [PMC free article] [PubMed] [Google Scholar]
- White E. Deconvoluting the context-dependent role for autophagy in cancer. Nat. Rev. Cancer 2012, 12, 401–410. [DOI] [PMC free article] [PubMed] [Google Scholar]
- Mizushima N. Methods for monitoring autophagy. Int. J. Biochem. Cell B 2004, 36, 2491–2502. [DOI] [PubMed] [Google Scholar]
- Chan F. K.; Moriwaki K.; De Rosa M. J. Detection of necrosis by release of lactate dehydrogenase activity. Methods Mol. Biol. 2013, 979, 65–70. [DOI] [PMC free article] [PubMed] [Google Scholar]
- Rubinsztein D. C.; Gestwicki J. E.; Murphy L. O.; Klionsky D. J. Potential therapeutic applications of autophagy. Nat. Rev. Drug Discovery 2007, 6, 304–312. [DOI] [PubMed] [Google Scholar]
- Mizushima N.; Yamamoto A.; Matsui M.; Yoshimori T.; Ohsumi Y. In vivo analysis of autophagy in response to nutrient starvation using transgenic mice expressing a fluorescent autophagosome marker. Mol. Biol. Cell 2004, 15, 1101–1111. [DOI] [PMC free article] [PubMed] [Google Scholar]
- Paglin S.; Hollister T.; Delohery T.; Hackett N.; McMahill M.; Sphicas E.; Domingo D.; Yahalom J. A novel response of cancer cells to radiation involves autophagy and formation of acidic vesicles. Cancer Res. 2001, 61, 439–444. [PubMed] [Google Scholar]
- Mizushima N.; Yoshimori T.; Levine B. Methods in mammalian autophagy research. Cell 2010, 140, 313–326. [DOI] [PMC free article] [PubMed] [Google Scholar]
- Wang K.; Liu R.; Li J.; Mao J.; Lei Y.; Wu J.; Zeng J.; Zhang T.; Wu H.; Chen L. Quercetin induces protective autophagy in gastric cancer cells: involvement of Akt-mTOR- and hypoxia-induced factor 1α-mediated signaling. Autophagy 2011, 7, 966–978. [DOI] [PubMed] [Google Scholar]
- Duan W.; Jin X.; Li Q.; Tashiro S.-i.; Onodera S.; Ikejima T. Silibinin induced autophagic and apoptotic cell death in HT1080 cells through a reactive oxygen species pathway. J. Pharmacol. Sci. 2010, 113, 48–56. [DOI] [PubMed] [Google Scholar]
- Ogier-Denis E.; Pattingre S.; El Benna J.; Codogno P. Erk1/2-dependent phosphorylation of Gα-interacting protein stimulates its GTPase accelerating activity and autophagy in human colon cancer cells. J. Biol. Chem. 2000, 275, 39090–39095. [DOI] [PubMed] [Google Scholar]
- Pattingre S.; Bauvy C.; Codogno P. Amino acids interfere with the ERK1/2-dependent control of macroautophagy by controlling the activation of Raf-1 in human colon cancer HT-29 cells. J. Biol. Chem. 2003, 278, 16667–16674. [DOI] [PubMed] [Google Scholar]
- Villanueva A.; Llovet J. M. Targeted therapies for hepatocellular carcinoma. Gastroenterology 2011, 140, 1410–1426. [DOI] [PMC free article] [PubMed] [Google Scholar]
- Mathew R.; Karantza-Wadsworth V.; White E. Role of autophagy in cancer. Nat. Rev. Cancer 2007, 7, 961–967. [DOI] [PMC free article] [PubMed] [Google Scholar]
- Pardo R.; Lo Ré A.; Archange C.; Ropolo A.; Papademetrio D. L.; Gonzalez C. D.; Alvarez E. M.; Iovanna J. L.; Vaccaro M. I. Gemcitabine induces the VMP1-mediated autophagy pathway to promote apoptotic death in human pancreatic cancer cells. Pancreatology 2010, 10, 19–26. [DOI] [PubMed] [Google Scholar]
- Ding Q.; Bao J.; Zhao W.; Hu Y.; Lu J.; Chen X. Natural autophagy regulators in cancer therapy: a review. Phytochem. Rev. 2014, 1–18. [Google Scholar]
- Tang Q.; Li G.; Wei X.; Zhang J.; Chiu J. F.; Hasenmayer D.; Zhang D.; Zhang H. Resveratrol-induced apoptosis is enhanced by inhibition of autophagy in esophageal squamous cell carcinoma. Cancer Lett. 2013, 336, 325–337. [DOI] [PubMed] [Google Scholar]
- Zhang X.; Dong Y.; Zeng X.; Liang X.; Li X.; Tao W.; Chen H.; Jiang Y.; Mei L.; Feng S.-S. The effect of autophagy inhibitors on drug delivery using biodegradable polymer nanoparticles in cancer treatment. Biomaterials 2014, 35, 1932–1943. [DOI] [PubMed] [Google Scholar]
- Tian Q.; Wang X.-H.; Wang W.; Zhang C.-N.; Wang P.; Yuan Z. Self-assembly and liver targeting of sulfated chitosan nanoparticles functionalized with glycyrrhetinic acid. Nanomed.–Nanotechnol. 2012, 8, 870–879. [DOI] [PubMed] [Google Scholar]
- Roberts P.; Der C. Targeting the Raf-MEK-ERK mitogen-activated protein kinase cascade for the treatment of cancer. Oncogene 2007, 26, 3291–3310. [DOI] [PubMed] [Google Scholar]
- Yu L.; McPhee C. K.; Zheng L.; Mardones G. A.; Rong Y.; Peng J.; Mi N.; Zhao Y.; Liu Z.; Wan F. Termination of autophagy and reformation of lysosomes regulated by mTOR. Nature 2010, 465, 942–946. [DOI] [PMC free article] [PubMed] [Google Scholar]
Associated Data
This section collects any data citations, data availability statements, or supplementary materials included in this article.


