

Abstract
Because of its great genetic potential, the mouse (Mus musculus) has become a popular model species for studies on hearing and sound processing along the auditory pathways. Here, we present the first comparative study on the representation of neuronal response parameters to tones in primary and higher-order auditory cortical fields of awake mice. We quantified 12 neuronal properties of tone processing in order to estimate similarities and differences of function between the fields, and to discuss how far auditory cortex (AC) function in the mouse is comparable to that in awake monkeys and cats. Extracellular recordings were made from 1400 small clusters of neurons from cortical layers III/IV in the primary fields AI (primary auditory field) and AAF (anterior auditory field), and the higher-order fields AII (second auditory field) and DP (dorsoposterior field). Field specificity was shown with regard to spontaneous activity, correlation between spontaneous and evoked activity, tone response latency, sharpness of frequency tuning, temporal response patterns (occurrence of phasic responses, phasic-tonic responses, tonic responses, and off-responses), and degree of variation between the characteristic frequency (CF) and the best frequency (BF) (CF–BF relationship). Field similarities were noted as significant correlations between CFs and BFs, V-shaped frequency tuning curves, similar minimum response thresholds and non-monotonic rate-level functions in approximately two-thirds of the neurons. Comparative and quantitative analyses showed that the measured response characteristics were, to various degrees, susceptible to influences of anesthetics. Therefore, studies of neuronal responses in the awake AC are important in order to establish adequate relationships between neuronal data and auditory perception and acoustic response behavior.
Keywords: auditory cortex, electrophysiology, functional mapping, mouse
Introduction
The auditory cortex (AC) has been characterised in many mammals via studies of connectivity and/or basic neuronal response patterns as having one to three primary (core) fields and a varying number of higher-order fields (Merzenich & Schreiner, 1992; Kaas, 2011), which are named ‘belt areas’ in the literature on primates. The principles of sound processing in higher-order fields with regard to specialisations of neuronal response patterns and their functions and contributions to sound perception in animals are, with few exceptions, such as the mustached bat (Suga, 1989), poorly understood, mainly for two reasons. First, the tonotopically organised primary fields have attracted a much larger number of studies than higher-order fields. The former represent tones and complex stimuli, usually by short-latency and reliable responses from local clusters of neurons having predictable combination sensitivity for coding the sound properties (Wang et al., 1995; Ehret, 1997; Imaizumi et al., 2004; Schreiner & Winer, 2007; Kanwal & Ehret, 2011; Sutter & Shamma, 2011), whereas the latter often have unreliable responses to simple tones and unpredictable preferences for complex sounds, including communication calls (Rauschecker et al., 1997; Recanzone, 2008; Rauschecker & Romanski, 2011). Second, most studies characterising neuronal responses in the AC have been performed in anesthetised animals. Hence, comparative measurements of neuronal response properties across auditory cortical fields of an unanesthetised (awake) mammal, allowing the quantitative assessment of field specialisations, are available for monkeys (Recanzone et al., 2000; Bendor & Wang, 2008; Recanzone, 2008; Scott et al., 2011) and, in very limited way [three response properties only for the primary auditory field (AI) and the anterior auditory field (AAF)], also in the mouse (Guo et al., 2012).
Here, we used the house mouse (Mus musculus) as a model species; this has great potential for genetic analyses of hearing, and is therefore of increasing importance in auditory cortical research (Linden et al., 2003; Zhang et al., 2005; Liu, 2006; Tan & Wehr, 2009; Bandyopadhyay et al., 2010; Rothschild et al., 2010; Hackett et al., 2011; Guo et al., 2012; Honma et al., 2013) and also with regard to sound perception (Geissler & Ehret, 2004; Liu et al., 2006; Liu & Schreiner, 2007; Galindo-Leon et al., 2009; Bathellier et al., 2012). We present quantitative analyses of 12 functional properties from 1400 small clusters of neurons (multi-units) within four fields of the AC of awake house mice, namely the primary fields AI (primary auditory field) and AAF (anterior auditory field), and the higher-order fields AII (second auditory field) and DP (dorsoposterior field). Thus, systematic differences between fields beyond the well-known differences in tonotopic organisation (Stiebler et al., 1997; Guo et al., 2012) become obvious. They relate to spontaneous and tone-evoked firing patterns, characteristics of frequency tuning, and intensity-dependent responsiveness within frequency-receptive fields. Although the acoustic stimuli in the present study were restricted to tones, hypotheses about the processing of more complex sounds can be derived from the specifications found for the auditory cortical fields.
Materials and methods
Animals and database
Recordings were performed in cortical layers III/IV (300–450 μm from the surface) of the left hemisphere from a total of 87 awake female mice (M. musculus, outbred strain NMRI) at an average age of 7–9 weeks. Altogether, 303 multi-unit recordings were obtained from the AI, 236 from the AAF, 480 from the AII, and 381 from the DP (total of 1400 units). All experiments were performed in accordance with the European Communities Council Directive (86/609/EEC), and were approved by the appropriate authority (Regierungspräsidium Tübingen, Germany).
Surgical procedure
The surgery was performed under ketamine-xylazine anesthesia applied intraperitoneally. The initial dose was 6 mg/kg xylazine (Rompun 2%; Bayer Vital, Leverkusen, Germany) and 120 mg/kg ketamine (Ketavet; Pharmacia & Upjohn, Erlangen, Germany). To reduce mucous secretion in the respiratory tract, 0.16 mg/kg atropine sulfate (B. Braun Melsungen AG, Melsungen, Germany) was added to the initial anesthesia. The adequate anesthetic level was reached if no toe pinch reflex could be elicited. Anesthesia was maintained by injection of 30% of the initial Rompun/Ketavet dose every 20 min. Body temperature was kept constant at 38 °C with a feedback-controlled heating blanket (ThermoLux, Acculux).
The surgery started with removal of the skin and periosteum on the dorsal surface of the skull and with removal of the left-side temporal muscle. A bonding agent (Gluma Comfort Bond; Heraeus Kulzer, Hanau, Germany) was spread in a thin layer over the exposed skull. To head-fixate the awake animal in the recording sessions, a 3-cm-long aluminum bar weighing 0.4 g was attached to the frontal bones 4 mm rostral of bregma with ultraviolet-hardening dental cement (Flowline; Heraeus Kulzer). The aluminum bar was rigidly fixed to a metal post tightly screwed to the heavy metal base of the recording platform.
In the lateral part of the parietal bone contralateral to the recording site, a steel needle (diameter, 0.25 mm; Fine Science Tools, Heidelberg, Germany) was inserted through the skull to contact the brain surface. It served as reference electrode for the electrophysiological recordings. To access the left-side AC, the skull was opened (approximately 5 × 3 mm; Fig.1A and B) to expose the AC between the sutura lambdoidea (caudal), linea temporalis (dorsal), 1–2 mm anterior of the sutura squamosa (rostral), and the ventral sutura squamosa. The dura was left intact, and penetrated by the electrode at every recording site. Then, a custom-made PVC chamber (inner diameter, 6 mm) was glued with ultraviolet-hardening dental cement to the skull surrounding the hole. An antibiotic (Nebacetin; Altana Pharma & Astellas Pharma, Wesel/Munich, Germany) and NaCl (0.9%; B. Braun Melsungen AG, Germany) were applied to the dura mater before the chamber was sealed with a screw cap. Animals recovered from surgery within a few hours and showed normal behavior, i.e. self-grooming, drinking, feeding, and being interested in their environment (walking and sniffing around).
Figure 1.
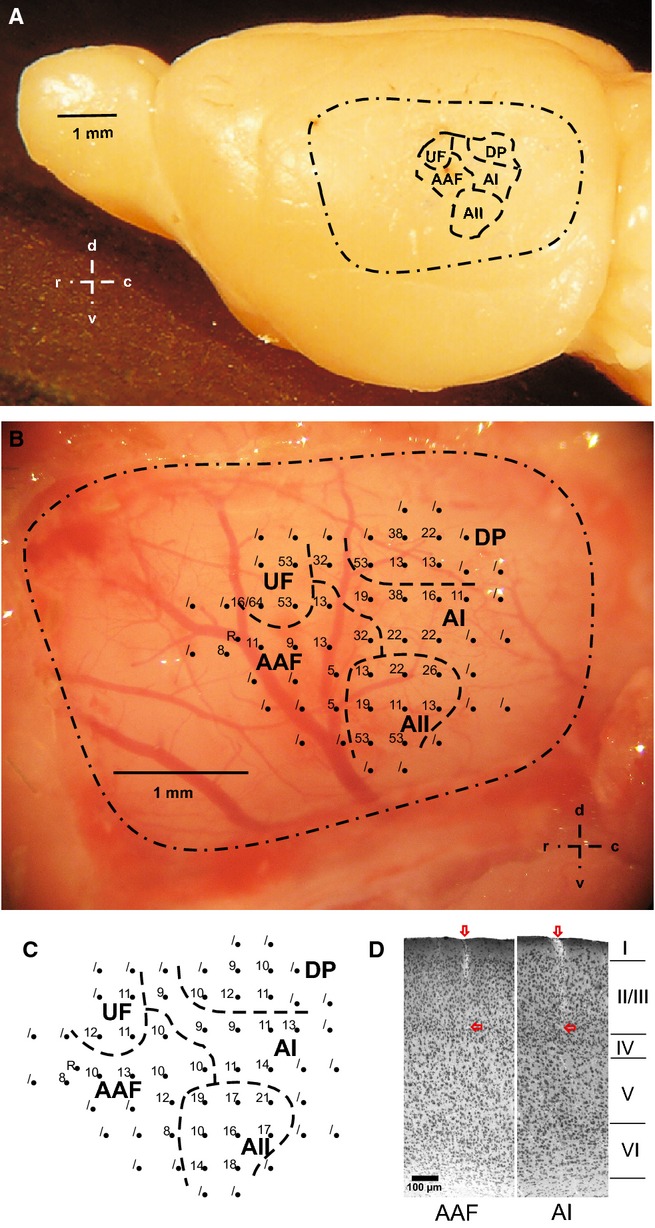
Position of the AC with its fields on the left-side neocortex. (A) The AI, AAF, AII, DP and UF of mouse # or No. 41 with their relative sizes in the trepanation area (dashed-dotted line). (B) Enlarged view of the AC of mouse # or No. 41, giving an example of the pattern of blood vessels and the locations of microelectrode penetrations (black dots). Each number shows the BF at the indicated location. Dots without numbers were locations without tone-evoked responses. (C) Shortest tone-evoked latency (ms) measured at each of the penetration sites shown in B. (D) Two histological sections, one from AAF and one from AI, each showing an electrode track through the outer layers of the AC, ending in the lower layer III.
Acoustic stimulation, sound calibration, and stimulus program
One day after recovery from the surgery, the first recording session of an experimental animal was held in a dark anechoic, sound-attenuated room. To increase the comfort of the head-fixed, awake animal and decrease its tendency to move during the recording session, the animal was placed in a custom-made PVC tube (length, 8 cm; inner diameter, 2.6 cm).
Acoustic stimuli were delivered free field via a loudspeaker (Schallwandler W06; Manger, Mellrichstadt, Germany), which was mounted approximately 30 cm in front of and 45° above the animal’s head. The speaker’s output was measured with a condensor microphone (Brüel & Kjær 4135; Brüel & Kjær, Bremen, Germany) placed at the position of the animal’s head and facing the speaker. The microphone output was read in dB sound pressure level (SPL) with a measuring amplifier (Brüel & Kjær 2633; Brüel & Kjær), and its frequency spectrum was controlled with a spectrum analyser (Ono Sokki Multi-purpose FFT Analyzer CF-5220; Ono Sokki Technology, Yokohama, Japan). In the range of SPLs of the presented tones (0–80 dB), distortion products could not be detected. Pure tones (PTs) were generated with an NI-PCI card (National Instruments, Munich, Germany) and matlab software (Matlab Version 7.3.0 R2006b; The Mathworks, Natwick, MA, USA), transmitted via a BNC-Unit (BNC-2120; National Instruments, Austin, TX, USA) to a computer-controlled attenuator (gPAH; g-tec, Graz, Austria), and then via an audio amplifier (PMA-1060; Denon, Mahwah, USA) to the loudspeaker. The frequency characteristic of the loudspeaker was equalised by the software to ± 5 dB in the whole frequency range used in the experiments (1–64 kHz). PTs of duration of 200 ms (including 5 ms rise and fall times) and 1000 ms inter-tone intervals were used in all measurements, except for the determination of excitatory receptive fields and tuning curves (TCs). In the latter case, the tone duration was 100 ms (including 5 ms rise and fall times) and inter-tone intervals were 600 ms.
Animals were stimulated according to the following program: (i) PTs at 16 logarithmically spaced frequencies in the range of 1–64 kHz were presented randomly in 15 repetitions, all at 70 dB SPL, in order to determine the neuron’s best frequency (BF) and related measures (see below); and (ii) PTs at 16 logarithmically spaced frequencies in the range of 1–64 kHz were presented at nine SPLs in the range of 0–80 dB randomly, with 10 repetitions of each frequency–intensity combination, in order to determine the neuron’s receptive field, TC, and related measures (see below).
Electrophysiological recordings and auditory field identification
Tungsten electrodes (impedance, 1 MΩ; Microelectrode Tungsten Kapton, TM 33A10KT; World Precision Instruments, Sarasota, FL, USA) were mounted onto a three-axis micromanipulator (MM 33; Märzhäuser, Wetzlar, Germany) controlling the penetration sites and the readings of coordinates. The penetration was oriented orthogonally to the cortical surface. The placement of the electrode on the cortical surface was controlled with an operating microscope (Zeiss OPMI1). The electrode was advanced into the cortex with a resolution of 10 μm, which provided the readings of the cortical depth of the recordings. Extracellular neuronal signals were collected and amplified via a headstage (HST/8o50-G1-GR Omnetics, Headstage; Plexon, Dallas, TX, USA), transmitted to a preamplifier and bandpass filter (PBX2/16SP-G50; Plexon; 50 000-fold amplification; filter bandwidth, 100 Hz to 8 kHz), and passed on to the recording system (MAP; Plexon) and a loudspeaker (Bass-Boostar AS 100; Boostar Multimedia-System, Vobis, Potsdam, Germany) and oscilloscope (Yokogawa DL 708E) for audiovisual control of the recordings. Spike analysis software (sort client Version 2.3.4; Plexon) was used for estimation of a maximum number of three neurons in a multi-unit recording to be included in the database. An automatic artefact correction algorithm implemented in the recording software excluded artefacts of muscle potentials. During the recordings, the responses of the multi-units were monitored in rasterplots (matlab-based custom-made software; compare Fig.2).
Figure 2.
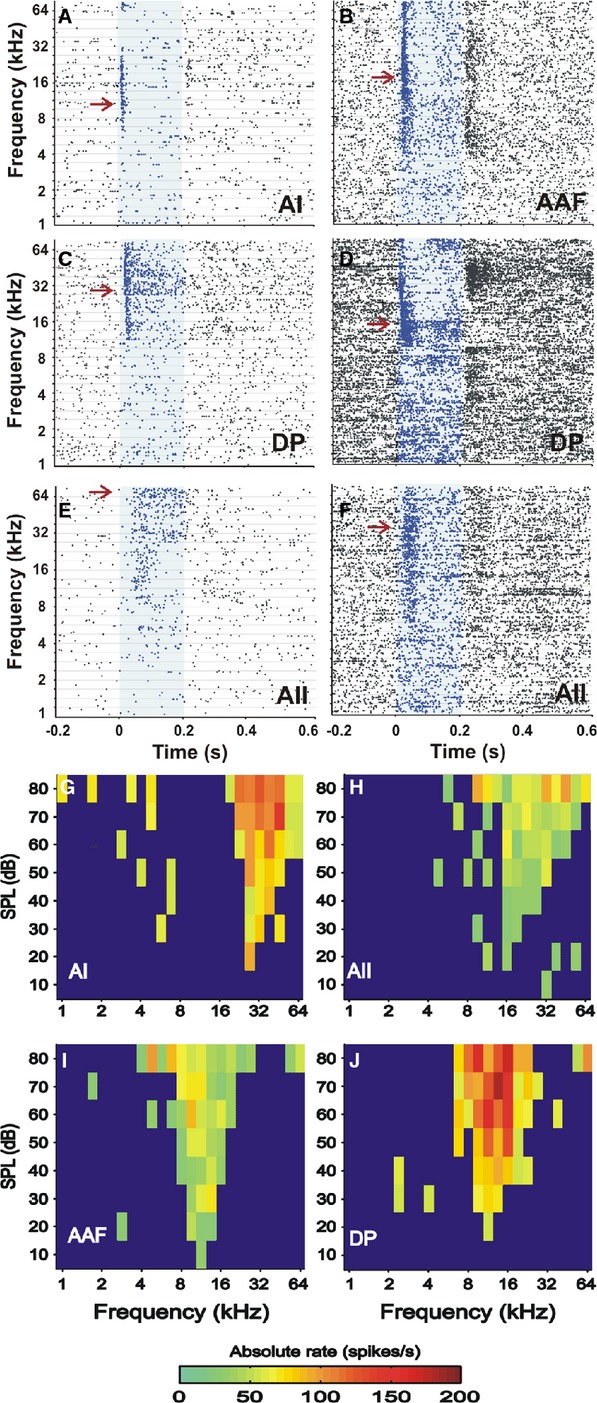
(A–F) Examples of tone-evoked responses (dot plots of spiking activity) covering the whole tested frequency range at 70 dB SPL. The tone duration is 0-0.2 s (blue areas). Units are from the primary fields AI and AAF (A and B), and the higher-order fields DP (C and D), and AII (E and F). Examples of phasic responses are shown in A and B, examples of phasic–tonic responses are shown in C and D, and examples of tonic responses are shown in E and F. In B and D, off-responses are visible in certain frequency ranges as increased spiking after the end of the tone intervals. Spontaneous activity varies across fields, with low (left panels) and high (right panels) SRs. BFs are indicated by the red arrow in each panel. Responses in AII (E and F) typically show long latencies. (G–J) Examples of excitatory frequency-receptive fields of units from the four auditory cortical fields (AI, AII, AAF, and DP). The frequency-receptive fields turned out to be one single interconnected area of frequency-level combinations that evoked an excitatory response. The borders of the frequency-receptive fields (TCs) of all recorded units were roughly V-shaped. In addition, most units had, outside the frequency-receptive field, some islands of excitation above the level of spontaneous activity (blue areas). The absolute rate above spontaneous activity is indicated by the color code.
Recording sessions lasted for up to 4 h. An animal served for a maximum of five recording sessions on consecutive days. Then, the animal was killed with an overdose of the anesthetic. In the first recording session of a given animal, the positions of AI, AAF, AII and DP and their boundaries were determined in the following way. The boundary between the AI and the AAF was always in the center of the trepanation area described above, according to the landmarks on the skull (Fig.1). According to the criteria of Stiebler et al. (1997), neurons in the AI and AAF were identified by the typical reversal of tonotopy along the rostral–caudal axis, and short-latency, phasic responses. When the positions of the areas of the AI and AAF had been determined in this way, units in AII were identified by their location ventral of AI and AAF, their longer tone response latency compared to AI and AAF units, and the non-tonotopical organisation of BFs. These neuronal response properties determined the position and area of the AII. Neurons in the DP, dorsal of the AI, were characterised by repeated spontaneous bursts of spikes, measured audiovisually with a loudspeaker and oscilloscope, in the presence and absence of acoustic stimulation (Stiebler et al., 1997). Thus, the position and area of the DP were localised. When responses to tones were searched in AI, AAF, AII, and DP, locations without such responses were encountered at the periphery of the fields (Fig.1B and C). Thus, these locations determined the outer border of the AC of an animal. In summary, all of these initial recordings from an individual AC together constituted the map of the auditory cortical fields for this animal, as shown in the example of Fig.1. This map of auditory cortical fields was superimposed on a picture of the AC with its individual pattern of blood vessels. This picture with blood vessels as individually characteristic landmarks served as a template for AC field identification in the following recording sessions. Therefore, the second recording session was started by putting the electrode in a prominent landmark given by the characteristic pattern of blood vessels and noting the coordinates of this point on the micromanipulator. From this point, usually two auditory fields (in any combination of the fields) were scanned in this session, with up to 10 penetrations (with successful recordings) spaced approximately 250 μm apart. The number of penetrations (out of the 10) per field was variable. In later sessions, in the same way, more penetrations, always relative to the prominent landmark, in the same or other fields were made in the given animal, so that, finally, all fields were studied with a high number of recordings from all of the animals.
Histology
In the initial and final phases of the study, electrode tracks were examined in histological sections through the AC area of five animals. After the final recording session, animals were killed by cervical dislocation, and their brains were quickly removed and frozen over liquid nitrogen. The brains were cut in serial frontal sections (thickness, 50 μm) on a freezing microtome (HM 500 OM; Microm, Walldorf, Germany) and stained with cresyl violet. The sections were examined under a microscope (Axiophot; Zeiss, Oberkochen, Germany) to find the electrode tracks. The analysis of histological material was performed blind to the electrophysiological results. Electrode tracks in AI, AAF, AII and DP were identified by their lesions of the cortical surface (×5 objective) that could be followed down to cortical layers III/IV under ×20 objective magnification (Frost & Caviness, 1980; Willard & Ryugo, 1983; Hofstetter & Ehret, 1992; Geissler & Ehret, 2004). Two example sections are shown in Fig.1D.
Data analysis
Data analysis started with checking the recordings for possible movement artefacts, which are characteristic of awake animals. They were defined in the following way. For every stimulus situation, i.e. frequency–level combination, the average evoked discharge rate was calculated over all repetitions (10 or 15, depending on the explained stimulus program), and a trial (one of the repetitions) was discarded because of the presence of artefacts once the evoked rate in that trial exceeded three standard deviations (SDs) of the average measure. This criterion detected myogenic artefacts, characterised by high-amplitude spikes at very high rates, in up to 20% of the trials, so that, for all stimulus situations, a minimum of eight or 12 (depending on the explained stimulus program) repetitions remained for the analysis of the parameters of interest.
In the first stimulation program, the following parameters were determined. (i) Spontaneous rate (SR) – average discharge rate in all of the 200 ms intervals before onset of the tone stimulus (at 16 frequencies at a maximum of 15 repetitions). (ii) BF – the tone frequency (of the 16 frequencies presented at 70 dB SPL) that elicited the highest evoked discharge rate in the tone interval after subtraction of the SR. (iii) Evoked rate at the BF. (iv) Latency – tone response latency, defined as the shortest latency of a tone-evoked rate three SDs above the average SR. (v) Tone response type at the BF – this could be phasic, phasic-tonic, or tonic (Fig.2). Cheung et al. (2001) in the anesthetised monkey and Chimoto et al. (2002) in the alert cat defined a brief phasic discharge or, strictly, onset response in the primary AC as a discharge occurring within 50 ms after tone onset. Accordingly, we defined a unit as having a phasic response if a short-latency tone response had a duration of up to 40 ms. A phasic-tonic response was defined as a phasic response which could continue over any duration within the tone interval up to the end of the tone interval and additionally by a response at a lower spike rate than in the phasic part. A tonic response often had a rather long latency and a duration of > 40 ms without much change in the spike rate over the whole response duration. (vi) Occurrence of an off-response shortly after the end of the tone stimulation - an off-response was identified by a spike rate exceeding three SDs of the SR at any of the 16 frequencies presented. In this context, we did not discriminate between phasic, phasic–tonic or tonic off-responses (Fig.2A, B, and D).
In the second stimulation program, the following parameters were determined. (i) Frequency-receptive field – one or more interconnected area(s) of frequency–level combinations that evoked an excitatory response. An excitatory response was defined as a spike rate three SDs above the SR. The borders of the frequency-receptive field define the TC of a given neuron. (ii) TC shape – general shape of the TC, i.e. whether TCs were simply V-shaped or had a different shape. (iii) Characteristic frequency (CF) – the frequency at the lowest response threshold of a TC. (iv) Threshold level at the CF. (v) Evoked rate at the CF. (vi) Q40 – a measure of the sharpness of frequency tuning, i.e. the frequency bandwidth of the TC 40 dB above the threshold at the CF divided by the CF. Q40 could be measured only in neurons with threshold levels up to 40 dB SPL. (vii) Rate-level function (RLF) – a function describing the development of the average response rate at the CF with increasing SPL. RLFs were measured only in neurons for which responses covered a dynamic range of at least 60 dB. RLFs were divided into three classes: monotonic (spike rate increases from the threshold at the CF up to the highest SPL, including possible constant parts and/or decreases of < 20% of the previous value in between); non-monotonic (spike rate changes from the threshold at the CF up to the highest SPL presented by a > 20% increase from the previous and a decrease to one of the following values, leading to one or several peaks and valleys in the function); and flat (shapes differing from monotonic and non-monotonic functions by showing < 20% change of the spike rate over the whole SPL range).
Statistical analysis
Statistical analyses were conducted with statistica 9 (StatSoft, Hamburg, Germany). Most of the data were not normally distributed, and were compared by use of a one-way anova on ranks (Kruskal–Wallis H-test with multiple comparisons according to Dunn’s test). Distributions of rates were tested with the χ2-test for possible differences. Interdependences of parameters were tested with a correlation analysis and calculation of regression lines. Parameters of the regression lines (slopes and y-axis intercepts) were tested for differences, and slope values were compared according to Sachs (1999). All tests were two-tailed with α = 0.05.
Results
Location of the AC and division in fields
The position of the AC within the trepanation area (Fig.1A) was very stable. The pattern of blood vessels (Fig.1B) and the relative sizes of the four fields of the AC from which recordings were taken varied somewhat among the animals, although without changing the basic spatial relationships among the fields shown in Fig.1. Because of the upper frequency limit of 64 kHz of tone stimuli in our present experiments, we did not systematically analyse neurons that may belong to the ultrasonic field (Fig.1A–C). We identified this field, however, as a non-tonotopically organised field dorsorostral to the AI and dorsal to the AAF, in which the tonotopic gradients of the BF and CF of neurons, both from AI and from AAF, did not continue.
AC field differences in neuronal activity and response characteristics
Spontaneous activity
The spontaneous discharge rate varied over a large range in all four fields, which is obvious in the dot plots (Fig.2A–F) and quantified in Fig.3A. On average, the SR was significantly higher (P < 0.001 or P < 0.01) in the higher-order fields (AII and DP) than in the primary fields (AI and AAF) (Fig.3A).
Figure 3.

Quantification of some neuronal characteristics and comparison across the auditory cortical fields AI, AAF, AII, and DP. (A) SR. (B) Tone response latency. (C) BF. (D) CF. (E) Evoked rate at the BF. (F) Evoked rate at the CF. (G) Sharpness of frequency tuning expressed by the Q40. **P < 0.01, ***P < 0.001, one-way anova on ranks with Dunn’s test. (A–C and E) AI, n = 185; AAF, n = 129; AII, n = 317; DP, n = 208. (D, F and G) AI, n = 118; AAF, n = 104; AII, n = 160; DP, n = 172.
Tone response latency
The tone response latency was determined at the BF of a unit. In AI and AAF, the latency varied between 5 and 18 ms, in the AII it varied between 11 and 32 ms, and in the DP it varied between 8 and 30 ms (Fig.3B). On average, latencies in the AII were significantly longer (P < 0.001) than in all of the other fields, and latencies in the DP were significantly longer (P < 0.001) than in both primary fields. We mapped latencies in the auditory cortical fields (Fig.1C), but did not find latency gradients along spatial axes in any of the cortical fields.
Tone response patterns and rates
Examples of phasic, phasic–tonic and tonic responses as defined in this study are shown in the dot plots in Fig.2A–F. It is evident that tone response patterns may depend on the tone frequency, as demonstrated by the examples from the DP (Fig.2C and D). At the BF, both units were phasic–tonic in their responses, the unit in Fig.2C was phasic at frequencies lower than the BF, and the unit in Fig.2D was phasic at frequencies higher than the BF. The examples also show that the durations of the phasic component in a phasic response (Fig.2A and B) and of the tonic component in a phasic–tonic response (Fig.2C and D) or tonic response (Fig.2E and F) could be very variable and also frequency-dependent. The relative rates of occurrence of phasic, phasic–tonic and tonic responses in the four auditory cortical fields are shown in Fig.5. The distributions of the response types in the fields were highly significantly different (P < 0.0001). Phasic responses were dominant in the AI and, particularly, in the AAF, where no tonic responses were observed. Tonic responses occurred in the AII and DP; phasic–tonic responses were most frequently observed in the AII.
Figure 5.
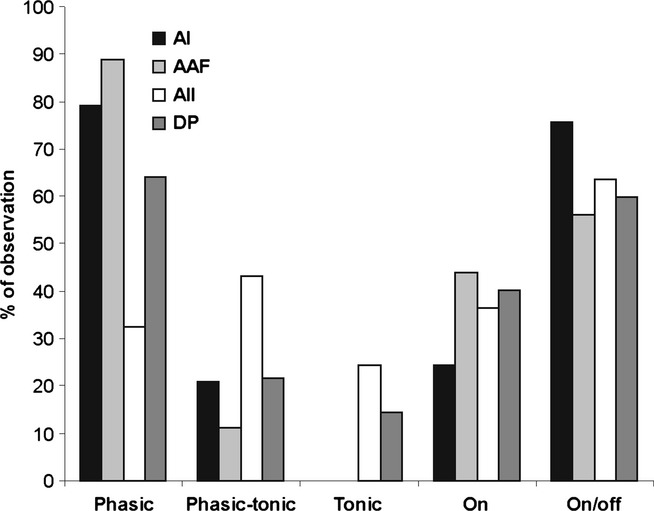
Temporal response types of the units in the AC fields. The responses in the tone intervals were either phasic, phasic–tonic, or tonic. In addition, units were divided into those with responses only in the tone interval (on) and others with responses both in and after the tone interval (on/off). Tonic responses were absent in the AI and AAF, where phasic responses were by far the most abundant. Phasic-tonic responses were frequently seen in AII. These differences in rates of occurrence of response types between the fields were statistically significant (P < 0.0001; χ2-test). In addition, the distributions of the response types ‘on’ and ‘on/off’ in the fields were significantly different (P < 0.01; χ2-test), with on/off-responses occurring most frequently in the AI, and on-responses occurring at relatively high rates in the AAF.
In addition to excitatory responses in the tone interval (on response), we evaluated the occurrence of an excitatory response after the end of the tone bursts, which is called the off-response. Such off-responses can be seen in Fig.2, most clearly in examples Fig.2B and D. Units were divided in two classes: those having only an on-response, and others having both an on-response and an off-response. We did not record from units with only an off-response. The relative rates of occurrence of units in these two classes are shown in Fig.5 for the AC fields. The distributions of the response types in the fields were significantly different (P < 0.01), with on/off-responses occurring most frequently in the AI, and on-responses at relatively high rates in the AAF.
Response rates to tones at the BF are shown in Fig.3E. On average, units in the DP had significantly higher rates (P < 0.001) than units in the AI, AAF, and AII. The ranges of response rates were large in all four fields, partly because of the differences in the units’ response patterns (Fig.5). Correlations between spontaneous and evoked activity in the respective fields are shown in Fig.4A–D. Although correlation coefficients of the regression lines were statistically significant for all fields (P < 0.0001), evoked rates could best be predicted from SRs in the AII (r = 0.6225, slope = 1.1763) and least well predicted from SRs in the DP (r = 0.2421, slope = 0.8234). The AI and AAF were similar in correlation coefficients and slopes (AI, r = 0.4183, slope = 0.8548; AAF, r = 0.4150, slope = 0.8143). The AII had the best correlation between SRs and evoked rates, with a significantly larger slope (P < 0.001) than the other fields.
Figure 4.
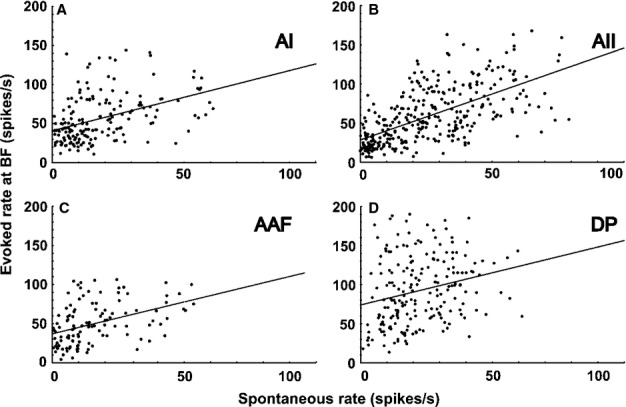
Relationships between evoked rate at the BF and the SR of the neurons in the AC fields. (A) AI. (B) AII. (C) AAF. (D) DP. Evoked rate at the BF and the SR significantly correlate, as shown by the regression lines (AI, AAF, AII, DP: P < 0.0001). The best correlation between evoked rate and SR is in AII (B), with a significantly larger slope (P < 0.0001) than in the other fields. For details, see Results.
AC field differences in neuronal parameters of the frequency-receptive field
Examples of the responses in the frequency-receptive fields are shown in Fig.2G–J. From these plots, several parameters were derived, quantified, and compared among the auditory cortical fields (see below). A common characteristic of all units recorded in all fields was a V-shaped appearance of the excitatory response area; that is, the TCs (borders of the response areas) were all roughly V-shaped (Fig.2G–J). Small islands of excitation in the frequency–level plots (Fig.2G–J) that were not interconnected to each other to form a continuous area or that were not connected to the main response area of a unit were not considered as part of the frequency-receptive field.
A measure of the sharpness of tuning (width of receptive-field) is the Q40. In general, Q40-values were rather small and, on average, they were significantly smaller in the AII than in the other fields (Fig.3G). Q40-values are plotted as a function of the CF of the units in the auditory cortical fields in Fig.6. In the AAF and DP, Q40 did not correlate with the CF (Fig.6C and D). In the AI and AII, however, Q40 increased significantly (P < 0.001) with increasing CF (see regression lines in Fig.6A and B).
Figure 6.
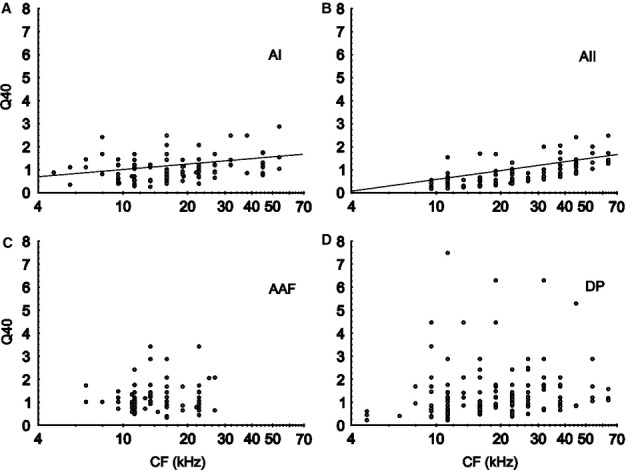
Sharpness of tuning, indicated by Q40-values, as a function of the units’ CFs. In the AI (A) and AII (B), the Q40-values increased, on average, significantly (P < 0.001) with increasing CF. This is shown by the regression lines. In the AAF (C) and DP (D), the Q40-values did not correlate with CF. On average, Q40-values in the AII were significantly smaller (P < 0.001), i.e. the tuning was broader, than in the other fields (compare Fig.3G).
Response threshold and evoked rate at the CF
The threshold level at the CF of a unit is a measure of its general sensitivity to tones. Such threshold levels are plotted for the units as a function of the CF for the fields in Fig.7. The lowest behavioral thresholds obtained in this mouse strain (Ehret & Moffat, 1985) are shown as turquoise lines. In all fields, the lowest threshold measurements were at 0 dB SPL, although, for only a very few units in the AAF, and for only units with high CFs in the AII. The highest thresholds in all fields were measured at 60 dB SPL, although for only a very few units. The main threshold ranges were approximately 50 dB in the AI and DP (in the DP, only for frequencies at and below the best hearing range of the mouse) and only approximately 30 dB in the AAF and AII (Fig.7). Only in AAF CFs were restricted to a frequency range below 30 kHz.
Figure 7.
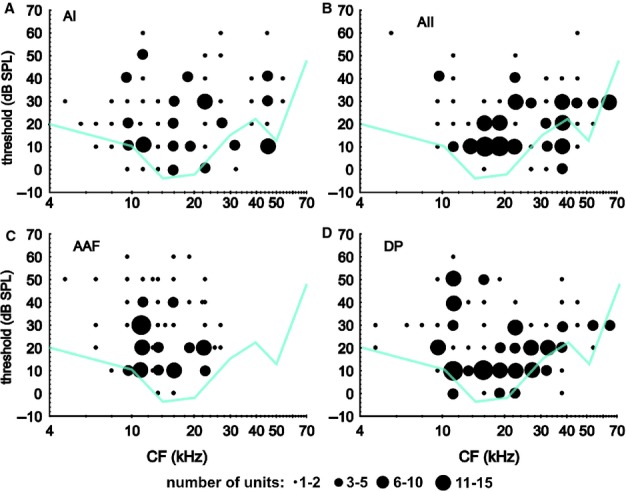
Tone response thresholds as a function of the units’ CFs. In all fields, the neural thresholds ranged between 0 and 60 dB SPL. CFs in the AI, AII and DP covered a large frequency range, far into the ultrasound (A, B and D). In the AAF, CFs were all lower than 30 kHz (C). For comparison, the lowest behavioral thresholds obtained in this mouse strain (Ehret & Moffat, 1985) are shown as turquoise lines.
The average tone-evoked response rates at the CF and their ranges were very similar in the AI, AAF, and AII; the rates in the DP, however, were significantly higher (P < 0.001 or P < 0.01) than in the other fields (Fig.3F).
BFs and CFs
In the AI, ranges of BFs and CFs and their medians were almost identical (approximately 4–54 kHz, with a median of 16 kHz). This was not the case in the other fields (Fig.3C and D). In the AAF, BFs of a few units went up to 54 kHz, whereas CFs reached 28 kHz. In the AII, BFs and CFs covered a similar range (approximately 5–64 kHz); however, the median BF was much higher (38 kHz) than the median CF (22 kHz). Despite this difference, BFs and CFs in the AII were, on average, significantly higher (P < 0.001) than in the other fields (Fig.3C and D). In the DP, BFs and CFs went up to 64 kHz, and BFs went down to approximately 2 kHz, whereas CFs reached only approximately 5 kHz.
The relationships between BFs and CFs of the neurons are shown in Fig.8 separately for each field. Despite variability between CF and BF values, the indicated regression lines were all statistically significant (AI, AAF, DP, P < 0.001; AII, P < 0.01). The slope values for the AI, AAF and DP were all very close to 1.0, and the regression lines showed that, on average, BFs and CFs were almost the same in these fields. AII differed in this respect from the AAF and DP, because both the slope and the y-axis intercept of the AII regression line differed significantly from those of the AAF and DP (AII vs. AAF, P < 0.05 in each case; AII vs. DP, P < 0.01 in each case). Differences between the AII and AI occurred as a trend (P < 0.1). In order to further analyse the relationship between the BF and CF in the fields, we analysed the cases in which the largest differences between the CF and BF occurred. Figure8 shows units with differences of less than ± 0.5 octaves (black dots), units with differences of ± 0.5–1.5 octaves (green dots), and units with larger differences. For most units in the AI and AAF, differences between the CF and BF were within ± 0.5 octaves (red dots). In the AII and DP, these differences reached > 1.5 octaves for a considerable number of units, favoring much higher BFs in the AII and lower BFs in the DP with regard to a given CF. In summary, the frequency range of the highest activity of a unit could deviate more from the unit’s CF in the higher-order fields (AII and DP) than in the primary fields (AI and AAF).
Figure 8.
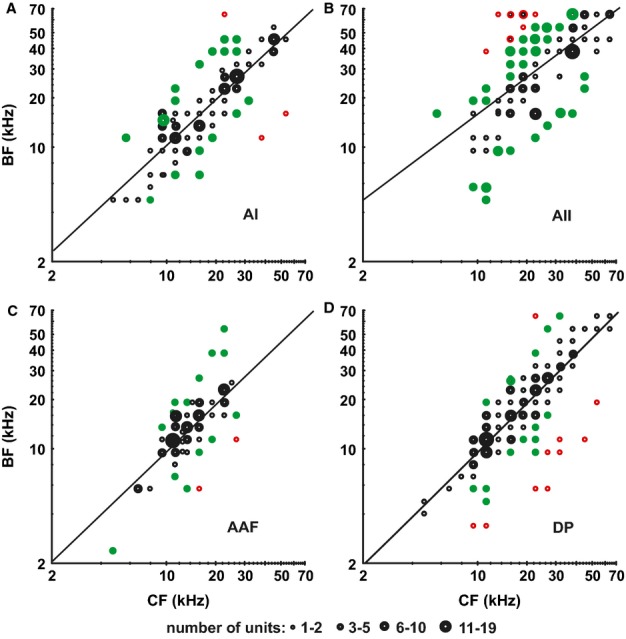
Relationships between BFs and CFs of the neurons in the AC fields. BFs and CFs significantly correlate, as shown by the regression lines (A, C and D) AI, AAF, DP: P < 0.001. (B) AII: P < 0.01. Black dots: units for which BF = CF ± 0.5 octaves. Green dots: units for which the BF and CF deviate by 0.5–1.5 octaves. Red dots: units for which the BF and CF deviate by > 1.5 octaves.
RLFs
We identified three types of RLFs, namely monotonically increasing, non-monotonic with peaks and valleys, and functions of little change, which were called ‘flat’. As only 4–8% of the functions were of the ‘flat’ type with no significant differences in occurrence rate between the fields, we added this type to the monotonic functions. Example functions are shown in Fig.9A–C. Non-monotonic functions had peaks at any level between 10 and 50 dB above the response threshold. The distribution of the monotonic and non-monotonic response types in the four AC fields (Fig.9D) shows that, in all fields, approximately two-thirds of the units had non-monotonic functions, and one-third of the units had monotonic functions. Significant differences in the rates of occurrence of the types between the fields did not occur.
Figure 9.

(A–C) Examples of RLFs illustrating cases of monotonic and non-monotonic functions. (D) The distribution of the types of RLF (%) in the AC fields. These distributions did not differ significantly among the fields.
By calculating the average tone-evoked response rate of all measured units active at their CFs at the given SPLs, we obtained an estimate of the development of the average rate as a function of the SPL. The results for the AC fields are shown in Fig.0. Because only a few neurons were active at 0 dB SPL (compare Fig.7), we did not include this level in Fig.0. In general, average rates changed little over SPL range from 10 to 60 dB, and increased only somewhat when the SPL reached 80 dB. Average rates in the AI, AAF and AII were very similar, and thus reproduced the similarity of average rates at the respective BFs and CFs (Fig.3E and F). Average rates in the DP were considerably higher than in the other fields (Fig.0), which could be predicted from the rates at BFs and CFs (Fig.3E and F).
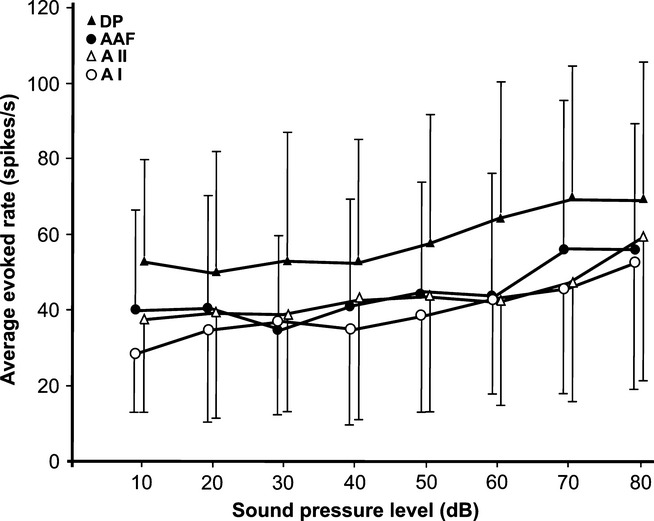
Average response rates in the AC fields as a function of the SPL of the tones. The means with SDs (only unilaterally plotted, for better visibility of the data) indicate little change in the average rates between 10 and 50 dB SPL, and only a slight rate increase at higher SPLs. Rates in the DP were significantly higher at each SPL than in the other fields (P < 0.001), which is also evident from the comparison of rates at the BF and CF (Fig.3E and F).
Discussion
General aspects and field structure of the mouse AC
The present study is based on recordings of integrated responses from up to three neurons in close neighborhood. We will compare our results from this small cluster of neurons with other multi-unit and single-unit recordings, and will consider that parameters such as SR depend on the number of units in the recording. The recordings were taken at cortical depths of 300-450 μm, corresponding to layers III/IV in primary and higher-order fields of the mouse AC (Willard & Ryugo, 1983). At this recording depth, the spontaneous activity and response properties of neurons in the primary fields of the anesthetised mouse are very similar (Christianson et al., 2011; Guo et al., 2012). This suggests that our results from recordings at cortical depths of 300–450 μm are comparable for neuronal response properties across the cortical fields.
In general, relationships between the BF and CF, bandwidths of excitatory tuning and types of RLF are not basically different whether they are determined from single-unit or multi-unit recordings, at least in AI (Schreiner & Mendelson, 1990; Schreiner & Sutter, 1992). Therefore, we suggest that the differences between fields of the AC and between anesthetised and non-anesthetised animals that will be identified below are adequate descriptions for both single-unit and multi-unit recordings. If interpretations and comparisons critically depend on the type of recording (single-unit vs. multi-unit), we will note this explicitly (South & Weinberger, 1995). The primary goal of this study was to detect and quantify similarities and differences in basic neuronal processing among primary and higher-order fields of the AC of an awake mammal, in order to estimate field-specific functions in audition. In this respect, our results provide valid comparisons, because data were obtained and analysed with the same methods in the same strain of animal. We are aware of possible changes in response properties resulting from changes in the waking state of the animal during the recording session. We are confident, however, that our mice were awake in the recording sessions, because we noticed a considerable amount of movement of the animals became obvious as distortions (movement artefacts) in up to 20% of stimulus repetitions over the whole recording time in a session. Even if the mice changed their state of vigilance during the experiment, recordings from the AI of guinea pigs during waking and slow-wave sleep showed similar values for spontaneous activity, tone-evoked activity, tone response latency and latency variability, location of the BF in the frequency response area, and width of the frequency response area as expressed by the Q40 (Edeline et al., 2001). Therefore, we use the term ‘awake’ in this article to characterise a non-anesthetised animal.
The tonotopic organisation of the core fields AI and AAF of the mouse AC was clearly apparent in the gradients of CFs and, with some variation between CFs and BFs (Fig.8), in the BF gradients of awake mice. The higher-order fields AII and DP were not tonotopically organised, on the basis of either CFs or BFs. There was an abrupt shift from tonotopic to non-tonotopic organisation from primary to higher-order fields; this has also been described for other small rodents, i.e. the rat (Horikawa et al., 1988; Polley et al., 2007) and gerbil (Thomas et al., 1993). This result, together with the positions of the fields relative to each other, agrees with previously described patterns of frequency representation in the AC of anesthetised mice of the same strain (Stiebler et al., 1997) and other strains (Linden et al., 2003; Hackett et al., 2011; Guo et al., 2012), and shows that barbiturate or ketamine/xylazine anesthesia, as used in the other studies, does not significantly change the determination of auditory cortical fields and their frequency (CF and/or BF) representation. Such changes have been observed in the rat AI under equithesin anesthesia (Gaese & Ostwald, 2001).
Neuronal activity – field specificity and effects of anesthesia
SRs were higher in higher-order fields
Spontaneous rates in primary fields of the awake mouse were similar to SRs in the AI of the awake gerbil, also recorded from multi-unit responses (Kurt et al., 2006). As our multi-unit recordings were mostly from two or three neurons, we divided the medians of the SRs by 2.5 (on average) to have a plausible value for comparisons of our data with single-unit recordings in other mammals. By doing this for the AI, we arrived at 5.7 spikes/s (Fig.3A), which is very similar to average SRs of neurons in the awake rat (4.9 spikes/s) (Hromádka et al., 2008), the awake cat (7.7 spikes/s) (Qin et al., 2007), and awake monkeys (5–8 spikes/s) (Recanzone et al., 2000; Bendor & Wang, 2008; Scott et al., 2011). In these studies, significant field differences were not reported. Field differences similar to those that we observed in the mouse (Fig.3A) were reported, although for the barbiturate-anesthetised rat, in which higher-order fields had higher SRs than the AI (Doron et al., 2002). In conclusion, it remains open whether or not there is a general pattern of SR differences between primary and higher-order fields of the AC of mammals.
Response latencies were longer in higher-order fields
The following comparison of tone response latencies between AC fields is based on relative values of onset latencies at the BF, because latencies were obtained with tones of different rise times and amplitudes in anesthetised or awake species with different head sizes, in different cortical layers, and with monaural or binaural stimulation, all of which could potentially influence the measured latencies. Our data (Fig.3B) from cortical layers III/IV in AC fields of awake mice agree with those for anesthetised mice (Guo et al., 2012) only in so far as average latencies in the AII were approximately 7 ms (in our case, 7 ms from medians) longer than those in the primary fields. Our finding that latencies in DP were longer than those in AI and AAF was not present in anesthetised mice. Instead, Guo et al. (2012), in both anesthetised and awake mice, and Linden et al. (2003), in anesthetised mice, found significantly shorter latencies in the AAF than in AI, which does not agree with our data. The differences with regard to AI and AAF latencies between our present study and the other two studies (Linden et al., 2003; Guo et al., 2012) may result from different tone presentations being used for defining the onset time of a response, i.e. only one or two tone repetitions in the other studies, and 15 repetitions in this study. In the anesthetised rat and guinea pig, latencies in primary fields did not differ (Wallace et al., 2000; Polley et al., 2007), but were significantly shorter (3–10 ms) than in higher-order fields (Wallace et al., 2000; Doron et al., 2002; Polley et al., 2007), whereby neurons in a ventral field had latencies that were approximately 5 ms longer than those in a dorsoposterior/posterior field (Wallace et al., 2000; Doron et al., 2002), which corresponds to the 5 ms difference that we found between the AII and the DP (Fig.3B). Significantly longer latencies in higher-order fields than in primary fields were also found in the anesthetised chinchilla (difference of approximately 3 ms) (Pienkowski & Harrison, 2005) and cat (difference of 2–7 ms) (Stecker et al., 2003; Carrasco & Lomber, 2011).
In conclusion, it is intriguing to note that the median latency difference of 5 ms that we found between the two higher-order fields (DP and AII) in the awake mouse is also present in mean differences in the anesthetised mouse (Guo et al., 2012), rat (suprarhinal vs. posterior auditory field) (Polley et al., 2007), guinea pig (dorsocaudal vs. ventrorostral belt) (Wallace et al., 2000), and cat (AII vs. posterior auditory field) (Stecker et al., 2003; Carrasco & Lomber, 2011). This suggests that: (i) barbiturate, chloralose or ketamine anesthesia does not influence average latency relationships between AC fields; and (ii) rodents and cats have in common higher-order auditory fields with rather direct access to upstream auditory information flow (onset latencies that are only 2–4 ms longer than in primary fields) and others with more indirect access (average latencies that are 5 ms longer) that may result from information running through one more corticothalamic loop (Briggs & Usrey, 2008).
Relationships between spontaneous and evoked activity
Significant increases in average tone-evoked rates with increasing spontaneous activity of the neurons, as found in the present study (Fig.4), have also been reported in primary fields of the anesthetised cat (Eggermont, 1996) and awake monkey core AC (Bendor & Wang, 2008). The scatter of the data in the cat AI is large, and the slope of the correlation is < 1, which is similar to what is found in the AI and AAF of the mouse (Fig.4A and C). In the monkey, the data are less variable and the slope is > 1, which is similar to what we found for AII (Fig.4B). This loose but significant coupling of the tone-evoked rate to the SR, not only in the primary but also, as we show, in the higher-order AC suggests that the balance between excitatory and inhibitory input to cortical cells, which is thought to be responsible for the spontaneous activity (Haider et al., 2006), also determines, in general, the tone-evoked rate well above the response threshold.
Lowest response thresholds in all fields were near 0 dB SPL
In the best hearing range of the mouse, approximately 15–25 kHz, at least a few units in all fields had their lowest thresholds near 0 dB SPL in the AI, AII and DP also at other CFs (Fig.7). Studies of single-unit responses in anesthetised mice (Linden et al., 2003), cats (Schreiner & Cynader, 1984; Imaizumi et al., 2004), ferrets (Bizley et al., 2005), rats (Polley et al., 2007; Pandya et al., 2008) and awake monkeys (Recanzone et al., 2000; Bendor & Wang, 2008; Scott et al., 2011) showed relatively small differences in the lowest and average tone response thresholds, mostly in the range of 0–15 dB, between AC fields. Threshold differences of AC neurons in a multi-unit recording may be in the range of 30-40 dB (South & Weinberger, 1995), and may therefore be larger than the reported differences between AC fields. This fact and the very similar lowest thresholds in the AC fields reflecting lowest behavioral response thresholds, as shown in Fig.7, suggest that, whatever role the fields play in sound processing and perception, they already contribute when tones are very soft.
Frequency tuning curves were all V-shaped and rather broad
The 483 frequency tuning curves from the four AC fields were all classified as V-shaped (Fig.2G–J). That is, we did not see TCs with two or more CFs (W-shaped) or with an upper threshold (O-shaped). This could be attributable to recording from two or three neurons at a time with superposition of frequency response areas of different shapes to produce a V-shaped summary curve (South & Weinberger, 1995). Other studies using multi-unit recordings from the AC of the cat (Schreiner & Sutter, 1992; Kimura & Eggermont, 1999; Noreña & Eggermont, 2002; Moshitch et al., 2006), rat (Rutkowski et al., 2003; Polley et al., 2007; Pandya et al., 2008), ferret (Bizley et al., 2005) and bat (Hoffmann et al., 2008) found units with closed and/or multi-peaked TCs as well as V-shaped TCs. Considering this and the large number of units analysed in our present study, we should have recorded with high probability from at least some units with non-V-shaped TCs, provided that they were present in the mouse AC. Therefore, we assume that the great majority of neurons in the investigated fields and cortical depths of the mouse AC have V-shaped TCs. Since TCs with upper thresholds and fragmented frequency-receptive fields indicate the presence of strong inhibitory influences on the excitatory response area (Sutter et al., 1999; Loftus & Sutter, 2001; Kadia & Wang, 2003; Sutter & Loftus, 2003), we suggest that the excitatory frequency response areas in layers III/IV of the mouse AC (primary and higher-order fields) are not as strongly superimposed by inhibition as in other mammals.
The broadness of tuning can be expressed by the Q40 (Figs3G and 6). The values found in the AI and AAF are very similar to those reported for the anesthetised rat (Rutkowski et al., 2003; Polley et al., 2007), cat (Schreiner & Mendelson, 1990; Imaizumi et al., 2004; Imaizumi & Schreiner, 2007), and ferret (Bizley et al., 2005) (Q30 was measured), suggesting that barbiturate and ketamine anesthesia do not significantly influence the average width of excitatory frequency compared to the core AC. The significantly broader tuning in AII compared to the other fields found here (Figs3G and 6) was also reported for other mammals, i.e. the cat (Irvine & Huebner, 1979; Schreiner & Cynader, 1984), ferret (Bizley et al., 2005), rabbit (McMullen & Glaser, 1982), gerbil (Thomas et al., 1993), and owl monkey (Imig et al., 1977). The sharper tuning of neurons in the mouse DP compared to the other fields (Figs3G and 6) may correspond to the anesthetised rat posterior auditory field, in which Q42 values are highly variable and, on average, larger than in the AI and AAF (Polley et al., 2007).
In summary, our data on frequency tuning in the mouse AC fields indicate simpler and more homogeneous shapes of frequency-receptive fields, probably with less inhibitory influence than in cats, ferrets, and monkeys and suggest little influence of barbiturate or ketamine anesthesia on general patterns of frequency tuning.
BFs corresponded to CFs, although with considerable variation
The CFs of single units in a multi-unit recording from primary AC fields may differ by as much as 2 octaves (South & Weinberger, 1995), suggesting a similar difference also for BFs. Here, we show that, despite considerable variability among CFs (and possibly BFs) of neurons in close neighborhood, BFs and CFs (Fig.8) of a given unit are highly correlated. Starting with the CF at the response threshold, the BF may shift to lower or higher values with increasing SPL (Aitkin, 1976; Kaas, 1982), although staying, on average, near the CF. Thus, measurements of responsiveness taken at the CF or BF of a given unit are both adequate to represent the neural response characteristics in the frequency/intensity domain. This is important to note, because auditory cortical neurons convey the maximal stimulus-specific spectral information at their BFs (Montgomery & Wehr, 2010). As our data suggest, this result obtained from neurons in the AI of the anesthetised rat (Montgomery & Wehr, 2010) may also hold for the awake mouse, and not only for neurons in primary fields, but also for those in higher-order fields.
In our measurements, the largest CF–BF differences (> 1.5 octaves) occurred in the AII when BFs were higher than CFs, and in the DP when BFs were lower than CFs (Fig.8). This indicates a tendency for a considerable number of neurons in the AII and DP to preferentially process spectral information above or below their CFs, respectively. This means, for the mouse in particular, that processing of ultrasounds, which play an important role in species-specific communication (e.g. Ehret & Kurt, 2010), is preferentially processed in a considerable number of AII neurons having CFs in a much lower frequency range. Comparisons of BF–CF relationships in AC fields seem not to be available for other species.
RLFs divide, with very similar proportions across the fields, into monotonic and non-monotonic functions
The shapes of RLFs found in AC fields of the mouse (Fig.9) have also been found in AC fields of other mammals. Depending on the criterion used for defining monotonic and non-monotonic functions, there are 14–17% (Polley et al., 2007), 25% (Doron et al., 2002) or up to 65% (Rutkowski et al., 2003) non-monotonic units in the AI and AAF of the anesthetised rat. The highest rates reported are similar to the values found in our study. Such high rates of non-monotonic RLFs are also present in the core AC of anesthetised cats (Schreiner et al., 1992; Bonham et al., 2004) and awake monkeys (Recanzone et al., 2000; Bendor & Wang, 2008; Scott et al., 2011). Significantly more non-monotonic neurons were found in higher-order fields of anesthetised rats than in primary fields, with rates reaching up to 93% (Doron et al., 2002). Also in anesthetised cats, more non-monotonic neurons (70%) were found in the posterior field (Phillips et al., 1995) than in primary fields. In the awake macaque monkey, however, the rates of non-monotonic neurons in higher-order fields did not differ from those in the AI (Recanzone et al., 2000).
In conclusion, it seems that anesthesia influences the shape of RLFs, making those from neurons in higher-order fields more non-monotonic than those from neurons in primary fields. Such differences have not been observed in awake animals, with more than two-thirds of the neurons in all fields being non-monotonic.
As non-monotonic neurons have peak response rates at any level above the response threshold, the average tone-evoked rate in an AC field does not change much over a large range of sound levels (Fig.0). Similar conclusions can be drawn from data on the awake marmoset AI (Sadagopan & Wang, 2008). Such level-independent average response rates to sounds are already present in the inferior colliculus (Ehret & Merzenich, 1988), excluding an average rate code for sound intensity in both auditory centers. Local recordings of auditory evoked potentials in rat AC fields showed spatial distributions of tone-level-dependent amplitude maxima as a possible code for sound level (Takahashi et al., 2004).
Temporal response patterns, including off-response occurrence, vary among the AC fields
The main difference between the primary (AI and AAF) and higher-order fields (AII and DP) concerns the complete lack of neurons with tonic responses and the relatively small amount of neurons with phasic-tonic responses in the primary fields (Fig.5). That is, primary field responses, especially in the AAF, are onset-dominated (Figs2 and 5). In many neurons, especially in the AI, these onset responses are combined with off-responses to create an on–off pattern (Figs2B and 5), indicating that primary field neurons code changes in sound level, often over a large frequency range. Onset and offset responses in primary fields are not firmly linked together, and therefore seem to be generated by independent mechanisms, and not just by rebound facilitation, as suggested previously (Volkov & Galazjuk, 1991; He et al., 1997; Takahashi et al., 2004).
The large number of phasic neurons in the awake mouse AI and AAF agree with only phasic responses in the ketamine-anesthetised rat AI and AAF (Polley et al., 2007), and the 67% of phasically responding neurons in the AI of the urethane-anesthetised guinea pig (Wallace et al., 2000), but contrast with the 11% of phasic neurons in the AI of the awake monkey (Bendor & Wang, 2008) and the 9 or 20% of phasic neurons in the AI of the halothane-anesthetised (Moshitch et al., 2006) or awake cat (Chimoto et al., 2002), respectively. At least with regard to responses to PTs, primary AC fields of rodents seem to contain high proportions of onset-responding neurons, whereas those in cats and monkeys contain high proportions of neurons showing phasic–tonic and/or tonic responses. Further studies will be needed to determine whether a more tonic response will emerge in the mouse primary AC fields when the neurons are stimulated by more natural or preferred sounds rather than PTs, as has been shown in the awake marmoset (Wang et al., 2005).
A significant increase in the number of neurons responding in a phasic–tonic or tonic way in higher-order fields as compared with primary AC fields (Fig.5) has also been shown in gerbils (Schulze et al., 1997), guinea pigs (Wallace et al., 2000), and ferrets (Bizley et al., 2005). In the AII and DP, the reduction in the number of phasic neurons (Fig.5) is associated with a significant increase in tone response latency (Fig.3B), suggesting that the temporal acuity in the response to the tone onset is reduced in higher-order fields, although many neurons there still respond phasically to tone onset. The occurrence of as many offset-responding neurons in the higher-order AC fields compared to AAF (Fig.5), or even more of these neurons, indicates again that onset and offset responding are driven by different mechanisms. We intend to perform corresponding analyses in the mouse.
General conclusions
The measurement of basic neural response characteristics in two primary and two non-primary (higher-order) AC fields of the awake mouse revealed general similarities, differences and field specificities in processing tone stimuli. Remarkable similarities concerned: (i) highly significant correlations between CFs and BFs of the neurons in a given field; (ii) the uniform V-shape of the frequency-receptive field expressed by the TC; and (iii) the uniform distribution of the types of RLF. Main field specificities were noted in neuronal temporal response properties. The origins of these similarities and differences in neuronal characteristics between the fields need clarification in further studies. They may result from thalamic (lemniscal vs. non-lemniscal) and extrathalamic input, and from the connectivity between and hierarchy of auditory and other cortical field processing (De Ribaupierre, 1997; Lee & Winer, 2011). A comparative and quantitative analysis showed that the measured response characteristics seem, to various degrees, to be susceptible to influences of anesthetics, and reflect differences between rodents on the one hand and cats and monkeys on the other.
Acknowledgments
We thank Marcus Jeschke for technical support regarding electrophysiological setup and software, Sabine Schmidt for performing the histological investigations and additional help with the preparation of figures, and Diana Geissler for valuable advice on histological evaluation.
Glossary
- AAF
anterior auditory field
- AC
auditory cortex
- AI
primary auditory field
- AII
second auditory field
- BF
best frequency
- CF
characteristic frequency
- DP
dorsoposterior field
- PT
pure tone
- RLF
rate-level function
- SD
standard deviation
- SPL
sound pressure level
- SR
spontaneous rate
- TC
tuning curve
- UF
ultrasonic field
References
- Aitkin LM. Tonotopic organization at higher levels of the auditory pathway. In: Porter R, editor. International Review of Physiology. Neurophysiology II. Baltimore, MD: University Park Press; 1976. pp. 249–279. [Google Scholar]
- Bandyopadhyay S, Shamma SA. Kanold PO. Dichotomy of functional organization in the mouse auditory cortex. Nat. Neurosci. 2010;13:361–368. doi: 10.1038/nn.2490. [DOI] [PMC free article] [PubMed] [Google Scholar]
- Bathellier B, Steinmann T, Barth FG. Casas J. Air motion sensing hairs of arthropods detect high frequencies at near-maximal mechanical efficiency. J. R. Soc. Interface. 2012;9:1131–1143. doi: 10.1098/rsif.2011.0690. [DOI] [PMC free article] [PubMed] [Google Scholar]
- Bendor D. Wang X. Neural response properties of primary, rostral, and rostrotemporal core fields in the auditory cortex of marmoset monkeys. J. Neurophysiol. 2008;100:888–906. doi: 10.1152/jn.00884.2007. [DOI] [PMC free article] [PubMed] [Google Scholar]
- Bizley JK, Nodal FR, Nelken I. King AJ. Functional organization of ferret auditory cortex. Cereb. Cortex. 2005;15:1637–1653. doi: 10.1093/cercor/bhi042. [DOI] [PubMed] [Google Scholar]
- Bonham BH, Cheung SW, Godey B. Schreiner CE. Spatial organization of frequency response and rate/level functions in the developing AI. J. Neurophysiol. 2004;91:841–854. doi: 10.1152/jn.00017.2003. [DOI] [PubMed] [Google Scholar]
- Briggs F. Usrey WM. Emerging views of corticothalamic function. Curr. Opin. Neurobiol. 2008;18:403–407. doi: 10.1016/j.conb.2008.09.002. [DOI] [PMC free article] [PubMed] [Google Scholar]
- Carrasco A. Lomber SG. Neuronal activation times to simple, complex, and natural sounds in cat primary and non-primary auditory cortex. J. Neurophysiol. 2011;106:1166–1178. doi: 10.1152/jn.00940.2010. [DOI] [PubMed] [Google Scholar]
- Cheung SW, Bedenbaugh PH, Nagarajan SS. Schreiner CE. Functional organization of squirrel monkey primary auditory cortex: responses to pure tones. J. Neurophysiol. 2001;8:1732–1749. doi: 10.1152/jn.2001.85.4.1732. [DOI] [PubMed] [Google Scholar]
- Chimoto S, Kitama T, Qin L, Sakayori S. Sato Y. Tonal response patterns of primary auditory cortex neurons in alert cats. Brain Res. 2002;934:34–42. doi: 10.1016/s0006-8993(02)02316-8. [DOI] [PubMed] [Google Scholar]
- Christianson GB, Sahani M. Linden JF. Depth-dependent temporal response properties in core auditory cortex. J. Neurosci. 2011;31:12837–12848. doi: 10.1523/JNEUROSCI.2863-11.2011. [DOI] [PMC free article] [PubMed] [Google Scholar]
- De Ribaupierre F. Acoustical information processing in the auditory thalamus and cerebral cortex. In: Ehret G, Romand R, editors. The Central Auditory System. New York: Oxford University Press; 1997. pp. 317–397. [Google Scholar]
- Doron NN, Ledoux JE. Semple MN. Redefining the tonotopic core of rat auditory cortex: physiological evidence for a posterior field. J. Comp. Neurol. 2002;453:345–360. doi: 10.1002/cne.10412. [DOI] [PubMed] [Google Scholar]
- Edeline J-M, Dutrieux G, Manunta Y. Hennevin E. Diversity of receptive field changes in auditory cortex during natural sleep. Eur. J. Neurosci. 2001;14:1865–1880. doi: 10.1046/j.0953-816x.2001.01821.x. [DOI] [PubMed] [Google Scholar]
- Eggermont JJ. How homogeneous is cat primary auditory cortex? Evidence from simultaneous single-unit recordings. Audit. Neurosci. 1996;2:79–96. [Google Scholar]
- Ehret G. The auditory cortex. J. Comp. Physiol. A. 1997;181:547–557. doi: 10.1007/s003590050139. [DOI] [PubMed] [Google Scholar]
- Ehret G. Kurt S. Selective perception and recognition of vocal signals. In: Brudzynski SM, editor; Handbook of Mammalian Vocalization. Oxford: Academic Press; 2010. pp. 125–134. [Google Scholar]
- Ehret G. Merzenich MM. Complex sound analysis (frequency resolution, filtering and spectral integration) by single units of the inferior colliculus of the cat. Brain Res. Rev. 1988;13:139–163. doi: 10.1016/0165-0173(88)90018-5. [DOI] [PubMed] [Google Scholar]
- Ehret G. Moffat AJM. Inferior colliculus of the house mouse II. Single unit responses to tones, noise and tone–noise combinations as a function of sound intensity. J. Comp. Physiol. A. 1985;156:619–635. [Google Scholar]
- Frost DO. Caviness VS. Radial organization of thalamic projections to the neocortex in the mouse. J. Comp. Neurol. 1980;194:369–393. doi: 10.1002/cne.901940206. [DOI] [PubMed] [Google Scholar]
- Gaese BH. Ostwald J. Anesthesia changes frequency tuning of neurons in the rat primary auditory cortex. J. Neurophysiol. 2001;86:1062–1066. doi: 10.1152/jn.2001.86.2.1062. [DOI] [PubMed] [Google Scholar]
- Galindo-Leon EE, Lin FG. Liu RC. Inhibitory plasticity in a lateral band improves cortical detection of natural vocalizations. Neuron. 2009;62:705–716. doi: 10.1016/j.neuron.2009.05.001. [DOI] [PMC free article] [PubMed] [Google Scholar]
- Geissler DB. Ehret G. Auditory perception vs. recognition: representation of complex communication sounds in the mouse auditory cortical fields. Eur. J. Neurosci. 2004;19:1027–1040. doi: 10.1111/j.1460-9568.2004.03205.x. [DOI] [PubMed] [Google Scholar]
- Guo W, Chambers AR, Darrow KN, Hancock KE, Shinn-Cunningham BG. Polley DB. Robustness of cortical topography across fields, laminae, anesthetic states, and neurophysiological signal types. J. Neurosci. 2012;32:9159–9172. doi: 10.1523/JNEUROSCI.0065-12.2012. [DOI] [PMC free article] [PubMed] [Google Scholar]
- Hackett TA, Barkat TR, O’Brien BM, Hensch TK. Polley DB. Linking topography to tonotopy in the mouse auditory thalamocortical circuit. J. Neurosci. 2011;31:2983–2995. doi: 10.1523/JNEUROSCI.5333-10.2011. [DOI] [PMC free article] [PubMed] [Google Scholar]
- Haider B, Duque A, Hasenstaub AR. McCormick DA. Neocortical network activity in vivo is generated through a dynamic balance of excitation and inhibition. J. Neurosci. 2006;26:4535–4545. doi: 10.1523/JNEUROSCI.5297-05.2006. [DOI] [PMC free article] [PubMed] [Google Scholar]
- He J, Hashikawa T, Ojima H. Kinouchi Y. Temporal integration and duration tuning in the dorsal zone of cat auditory cortex. J. Neurosci. 1997;17:2615–2625. doi: 10.1523/JNEUROSCI.17-07-02615.1997. [DOI] [PMC free article] [PubMed] [Google Scholar]
- Hoffmann S, Firzlaff U, Radtke-Schuller S, Schwellnus B. Schuller G. The auditory cortex of the bat Phyllostomus discolor: localization and organization of basic response properties. BMC Neurosci. 2008;9:65. doi: 10.1186/1471-2202-9-65. [DOI] [PMC free article] [PubMed] [Google Scholar]
- Hofstetter KM. Ehret G. The auditory cortex of the mouse: connections of the ultrasonic field. J. Comp. Neurol. 1992;323:370–386. doi: 10.1002/cne.903230306. [DOI] [PubMed] [Google Scholar]
- Honma Y, Tsukano H, Horie M, Ohshima S, Tohmi M, Kubota Y, Takahashi K, Hishida R, Takahashi S. Shibuki K. Auditory cortical areas activated by slow frequency-modulated sounds in mice. PLoS One. 2013;8:e68113. doi: 10.1371/journal.pone.0068113. [DOI] [PMC free article] [PubMed] [Google Scholar]
- Horikawa K, Kinjo N, Stanley LC. Powell EW. Topographic organization and collateralization of the projections of the anterior and laterodorsal thalamic nuclei to cingulate areas 24 and 29 in the rat. Neurosci. Res. 1988;6:31–44. doi: 10.1016/0168-0102(88)90004-1. [DOI] [PubMed] [Google Scholar]
- Hromádka T, DeWeese MR. Zador AM. Sparse representation of sounds in the unanesthetized auditory cortex. PLoS Biol. 2008;6:e16. doi: 10.1371/journal.pbio.0060016. [DOI] [PMC free article] [PubMed] [Google Scholar]
- Imaizumi K. Schreiner CE. Spatial interaction between spectral integration and frequency gradient in primary auditory cortex. J. Neurophysiol. 2007;98:2933–2942. doi: 10.1152/jn.00511.2007. [DOI] [PubMed] [Google Scholar]
- Imaizumi K, Priebe NJ, Crum PA, Bedenbaugh PH, Cheung SW. Schreiner CE. Modular functional organization of cat anterior auditory field. J. Neurophysiol. 2004;92:444–457. doi: 10.1152/jn.01173.2003. [DOI] [PubMed] [Google Scholar]
- Imig TJ, Ruggero MA, Kitzes LM, Javel E, Brugge JF. Organization of auditory cortex in the owl monkey (Aotus trivirgatus) J. Comp. Neurol. 1977;171:111–128. doi: 10.1002/cne.901710108. [DOI] [PubMed] [Google Scholar]
- Irvine DR. Huebner H. Acoustic response characteristics of neurons in nonspecific areas of cat cerebral cortex. J. Neurophysiol. 1979;42:107–122. doi: 10.1152/jn.1979.42.1.107. [DOI] [PubMed] [Google Scholar]
- Kaas JH. The segregation of function in the nervous system: why do sensory systems have so many subdivisions? In: Neff WD, editor. Contributions to Sensory Physiology. New York: Academic Press; 1982. pp. 201–240. [Google Scholar]
- Kaas JH. The evolution of auditory cortex: the core areas. In: Winer JA, Schreiner CE, editors. The Auditory Cortex. New York: Springer; 2011. pp. 407–427. [Google Scholar]
- Kadia SC. Wang X. Spectral integration in A1 of awake primates: neurons with single- and multipeaked tuning characteristics. J. Neurophysiol. 2003;89:1603–1622. doi: 10.1152/jn.00271.2001. [DOI] [PubMed] [Google Scholar]
- Kanwal JS, Ehret G. Communication sounds and their cortical representation. In: Winer JA, Schreiner CE, editors. The Auditory Cortex. New York: Springer; 2011. pp. 343–367. [Google Scholar]
- Kimura M. Eggermont JJ. Effects of acute pure tone induced hearing loss on response properties in three auditory cortical fields in cat. Hearing Res. 1999;135:146–162. doi: 10.1016/s0378-5955(99)00104-5. [DOI] [PubMed] [Google Scholar]
- Kurt S, Crook JM, Ohl FW, Scheich H. Schulze H. Differential effects of iontophoretic in vivo application of the GABAA-antagonists bicuculline and gabazine in sensory cortex. Hearing Res. 2006;212:224–235. doi: 10.1016/j.heares.2005.12.002. [DOI] [PubMed] [Google Scholar]
- Lee CC, Winer JA. A synthesis of auditory cortical connections: thalamocortical, commissural and corticocortical systems. In: Winer JA, Schreiner CE, editors. The Auditory Cortex. New York: Springer; 2011. pp. 147–170. [Google Scholar]
- Linden JF, Liu RC, Sahani M, Schreiner CE. Merzenich MM. Spectrotemporal structure of receptive fields in areas AI and AAF of mouse auditory cortex. J. Neurophysiol. 2003;90:2660–2674. doi: 10.1152/jn.00751.2002. [DOI] [PubMed] [Google Scholar]
- Liu RC. Prospective contributions of transgenic mouse models to central auditory research. Brain Res. 2006;1091:217–223. doi: 10.1016/j.brainres.2006.02.030. [DOI] [PubMed] [Google Scholar]
- Liu RC. Schreiner CE. Auditory cortical detection and discrimination correlates with communicative significance. PLoS Biol. 2007;5:e173. doi: 10.1371/journal.pbio.0050173. [DOI] [PMC free article] [PubMed] [Google Scholar]
- Liu RC, Linden JF. Schreiner CE. Improved cortical entrainment to infant communication calls in mothers compared with virgin mice. Eur. J. Neurosci. 2006;23:3087–3097. doi: 10.1111/j.1460-9568.2006.04840.x. [DOI] [PubMed] [Google Scholar]
- Loftus WC. Sutter ML. Spectrotemporal organization of excitatory and inhibitory receptive fields of cat posterior auditory field neurons. J. Neurophysiol. 2001;86:475–491. doi: 10.1152/jn.2001.86.1.475. [DOI] [PubMed] [Google Scholar]
- McMullen NT. Glaser EM. Tonotopic organization of rabbit auditory cortex. Exp. Neurol. 1982;75:208–220. doi: 10.1016/0014-4886(82)90019-x. [DOI] [PubMed] [Google Scholar]
- Merzenich MM, Schreiner CE. Mammalian auditory cortex – some comparative observations. In: Webster DB, Fay RR, Popper AN, editors. The Evolutionary Biology of Hearing. New York: Springer; 1992. pp. 673–689. [Google Scholar]
- Montgomery N. Wehr M. Auditory cortical neurons convey maximal stimulus-specific information at their best frequency. J. Neurosci. 2010;30:13362–13366. doi: 10.1523/JNEUROSCI.2899-10.2010. [DOI] [PMC free article] [PubMed] [Google Scholar]
- Moshitch D, Las L, Ulanovsky N, Bar-Yosef O. Nelken I. Responses of neurons in primary auditory cortex (A1) to pure tones in the halothane-anesthetized cat. J. Neurophysiol. 2006;95:3756–3769. doi: 10.1152/jn.00822.2005. [DOI] [PubMed] [Google Scholar]
- Noreña A. Eggermont JJ. Comparison between local field potentials and unit cluster activity in primary auditory cortex and anterior auditory field in the cat. Hearing Res. 2002;166:202–213. doi: 10.1016/s0378-5955(02)00329-5. [DOI] [PubMed] [Google Scholar]
- Pandya PK, Rathbun DL, Moucha R, Engineer ND. Kilgard MP. Spectral and temporal processing in rat posterior auditory cortex. Cereb. Cortex. 2008;18:301–314. doi: 10.1093/cercor/bhm055. [DOI] [PMC free article] [PubMed] [Google Scholar]
- Phillips DP, Semple MN. Kitzes MS. Factors shaping the tone level sensitivity of single neurons in posterior field of cat auditory cortex. J. Neurophysiol. 1995;73:674–686. doi: 10.1152/jn.1995.73.2.674. [DOI] [PubMed] [Google Scholar]
- Pienkowski M. Harrison RV. Tone frequency maps and receptive fields in the developing chinchilla auditory cortex. J. Neurophysiol. 2005;93:454–466. doi: 10.1152/jn.00569.2004. [DOI] [PubMed] [Google Scholar]
- Polley DB, Read HL, Storace DA. Merzenich MM. Multiparametric auditory receptive field organization across five cortical fields in the albino rat. J. Neurophysiol. 2007;97:3621–3628. doi: 10.1152/jn.01298.2006. [DOI] [PubMed] [Google Scholar]
- Qin L, Chimoto S, Sakai M, Wang J. Sato Y. Comparison between offset and onset responses of primary auditory cortex ON–OFF neurons in awake cats. J. Neurophysiol. 2007;97:3421–3431. doi: 10.1152/jn.00184.2007. [DOI] [PubMed] [Google Scholar]
- Rauschecker JP, Romanski LM. Auditory cortical organization: evidence for functional streams. In: Winer JA, Schreiner CE, editors. The Auditory Cortex. New York: Springer; 2011. pp. 99–116. [Google Scholar]
- Rauschecker JP, Tian B, Pons T. Mishkin MM. Serial and parallel processing in rhesus monkey auditory cortex. J. Comp. Neurol. 1997;382:89–103. [PubMed] [Google Scholar]
- Recanzone GH. Representation of con-specific vocalizations in the core and belt areas of the auditory cortex in the alert macaque monkey. J. Neurosci. 2008;28:13184–13193. doi: 10.1523/JNEUROSCI.3619-08.2008. [DOI] [PMC free article] [PubMed] [Google Scholar]
- Recanzone GH, Guard DC, Phan ML. Su TIK. Correlation between the activity of single auditory cortical neurons and sound-localization behavior in the macaque monkey. J. Neurophysiol. 2000;83:2723–2739. doi: 10.1152/jn.2000.83.5.2723. [DOI] [PubMed] [Google Scholar]
- Rothschild G, Nelken I. Mizrahi A. Functional organization and population dynamics in the mouse primary auditory cortex. J. Neurosci. 2010;31:2983–2995. [Google Scholar]
- Rutkowski RG, Miasnikov MM. Weinberger NM. Characterisation of multiple physiological fields within the anatomical core of rat auditory cortex. Hearing Res. 2003;181:116–130. doi: 10.1016/s0378-5955(03)00182-5. [DOI] [PubMed] [Google Scholar]
- Sachs L. Angewandte Statistik. Berlin: Springer; 1999. [Google Scholar]
- Sadagopan S. Wang X. Level invariant representation of sounds by populations of neurons in primary auditory cortex. J. Neurosci. 2008;28:3415–3426. doi: 10.1523/JNEUROSCI.2743-07.2008. [DOI] [PMC free article] [PubMed] [Google Scholar]
- Schreiner CE. Cynader MS. Basic functional organization of second auditory cortical field (AII) of the cat. J. Neurophysiol. 1984;51:1284–1305. doi: 10.1152/jn.1984.51.6.1284. [DOI] [PubMed] [Google Scholar]
- Schreiner CE. Mendelson JR. Functional topography of cat primary auditory cortex: distribution of integrated excitation. J. Neurophysiol. 1990;64:1442–1459. doi: 10.1152/jn.1990.64.5.1442. [DOI] [PubMed] [Google Scholar]
- Schreiner CE. Sutter ML. Topography of excitatory bandwidth in cat primary auditory cortex: single-neuron versus multiple-neuron recordings. J. Neurophysiol. 1992;68:1487–1502. doi: 10.1152/jn.1992.68.5.1487. [DOI] [PubMed] [Google Scholar]
- Schreiner CE. Winer JA. Auditory cortex mapmaking: principles, projections, and plasticity. Neuron. 2007;56:356–365. doi: 10.1016/j.neuron.2007.10.013. [DOI] [PMC free article] [PubMed] [Google Scholar]
- Schreiner CE, Mendelson JR. Sutter ML. Functional topography of cat primary auditory cortex: representation of tone intensity. Exp. Brain Res. 1992;92:105–122. doi: 10.1007/BF00230388. [DOI] [PubMed] [Google Scholar]
- Schulze H, Ohl FW, Heil P. Scheich H. Field-specific responses in the auditory cortex of the unanaesthetized Mongolian gerbil to tones and slow frequency modulations. J. Comp. Physiol. A. 1997;181:573–589. doi: 10.1007/s003590050141. [DOI] [PubMed] [Google Scholar]
- Scott BH, Malone BJ. Semple MN. Transformation of temporal processing across auditory cortex of awake macaques. J. Neurophysiol. 2011;105:712–730. doi: 10.1152/jn.01120.2009. [DOI] [PMC free article] [PubMed] [Google Scholar]
- South DA. Weinberger NM. A comparison of tone-evoked response properties of ‘cluster’ recordings and their constituent single cells in the auditory cortex. Brain Res. 1995;704:275–288. doi: 10.1016/0006-8993(95)01134-x. [DOI] [PubMed] [Google Scholar]
- Stecker GC, Mickey BJ, Macpherson EA. Middlebrooks JC. Spatial sensitivity in field PAF of cat auditory cortex. J. Neurophysiol. 2003;89:2889–2903. doi: 10.1152/jn.00980.2002. [DOI] [PubMed] [Google Scholar]
- Stiebler I, Neulist R, Fichtel I. Ehret G. The auditory cortex of the house mouse: left–right differences, tonotopic organization and quantitative analysis of frequency representation. J. Comp. Physiol. A. 1997;181:559–571. doi: 10.1007/s003590050140. [DOI] [PubMed] [Google Scholar]
- Suga N. Principles of auditory information processing derived from neuroethology. J. Exp. Biol. 1989;146:277–286. doi: 10.1242/jeb.146.1.277. [DOI] [PubMed] [Google Scholar]
- Sutter ML. Loftus WC. Excitatory and inhibitory intensity tuning in auditory cortex: evidence for multiple inhibitory mechanisms. J. Neurophysiol. 2003;90:2629–2647. doi: 10.1152/jn.00722.2002. [DOI] [PubMed] [Google Scholar]
- Sutter ML, Shamma SA. The relationship of auditory cortical activity to perception and behaviour. In: Winer JA, Schreiner CE, editors. The Auditory Cortex. New York: Springer; 2011. pp. 617–641. [Google Scholar]
- Sutter ML, Schreiner CE, McLean M, O’Connor KN. Loftus WC. Organization of inhibitory frequency receptive fields in cat primary auditory cortex. J. Neurophysiol. 1999;82:2358–2371. doi: 10.1152/jn.1999.82.5.2358. [DOI] [PubMed] [Google Scholar]
- Takahashi H, Nakao M. Kaga K. Distributed representation of sound intensity in the rat auditory cortex. NeuroReport. 2004;15:2061–2065. doi: 10.1097/00001756-200409150-00013. [DOI] [PubMed] [Google Scholar]
- Tan AY. Wehr M. Balanced tone-evoked synaptic excitation and inhibition in mouse auditory cortex. Neuroscience. 2009;163:1302–1305. doi: 10.1016/j.neuroscience.2009.07.032. [DOI] [PubMed] [Google Scholar]
- Thomas HJ, Tillein J, Heil P. Scheich H. Functional organization of auditory cortex in the Mongolian gerbil (Meriones unguiculatus). I. Electrophysiological mapping of frequency representation and distinction of fields. Eur. J. Neurosci. 1993;5:882–897. doi: 10.1111/j.1460-9568.1993.tb00940.x. [DOI] [PubMed] [Google Scholar]
- Volkov IO. Galazjuk AV. Formation of spike response to sound tones in cat auditory cortex neurons: interaction of excitatory and inhibitory effects. Neuroscience. 1991;43:307–321. doi: 10.1016/0306-4522(91)90295-y. [DOI] [PubMed] [Google Scholar]
- Wallace MN, Rutkowski RG. Palmer AR. Identification and localization of auditory areas in guinea pig cortex. Exp. Brain Res. 2000;132:445–456. doi: 10.1007/s002210000362. [DOI] [PubMed] [Google Scholar]
- Wang X, Merzenich MM, Beitel R. Schreiner CE. Representation of a species-specific vocalization in the primary auditory cortex of the common marmoset: temporal and spectral characteristics. J. Neurophysiol. 1995;74:2685–2706. doi: 10.1152/jn.1995.74.6.2685. [DOI] [PubMed] [Google Scholar]
- Wang X, Lu T, Snider RK. Liang L. Sustained firing in auditory cortex evoked by preferred stimuli. Nature. 2005;435:341–346. doi: 10.1038/nature03565. [DOI] [PubMed] [Google Scholar]
- Willard FH. Ryugo DK. Anatomy of the central auditory system. In: Willott JF, editor; The Auditory Psychobiology of the Mouse. Springfield: Charles C. Thomas; 1983. pp. 201–304. [Google Scholar]
- Zhang Y, Hakes JJ, Bondield SP. Yan J. Corticofugal feedback for auditory midbrain plasticity elicited by tones and electrical stimulation of basal forebrain in mice. Eur. J. Neurosci. 2005;4:871–879. doi: 10.1111/j.1460-9568.2005.04276.x. [DOI] [PubMed] [Google Scholar]