

Abstract
Aim
To describe the incidence of acute community-acquired infections (lower respiratory tract infections, urinary tract infections and sepsis) among the UK population aged ≥65 years with diabetes mellitus, and all-cause 28-day hospital admission rates and mortality.
Methods
We used electronic primary care records from the Clinical Practice Research Datalink, linked to death certificates and Hospital Episode Statistics admission data, to conduct a retrospective cohort study from 1997 to 2011.
Results
Among the 218 805 older people with diabetes there was a high burden of community-acquired infection, lower respiratory tract infections having the highest incidence (crude rate: 152.7/1000 person-years) followed by urinary tract infections (crude rates 51.4 and 147.9/1000 person-years for men and women, respectively). The incidence of all infections increased over time, which appeared to be driven by the population’s changing age structure. Most patients diagnosed with pneumonia and sepsis were hospitalized on the same day (77.8 and 75.1%, respectively). For lower respiratory tract infections and urinary tract infections, a large proportion of 28-day hospitalizations were after the day of diagnosis (39.1 and 44.3%, respectively), and a notable proportion of patients (7.1 and 5.1%, respectively) were admitted for a cardiovascular condition. In the 4 weeks after onset, all-cause mortality was 32.1% for pneumonia (3115/9697), 31.7% for sepsis (780/2461), 4.1% for lower respiratory tract infections (5685/139 301) and 1.6% for urinary tract infections (1472/91 574).
Conclusions
The present large cohort study provides up-to-date detailed infection incidence estimates among older people with diabetes in the community, with variation by age, sex and region and over time. This should be of use for patient communication of risk and future healthcare planning.
What’s new?
The present large cohort study is the first to describe the burden of acute infections, including infections managed in primary care, among older people with diabetes for use in healthcare planning and communication of risk with patients.
On average per year among 1000 patients there were 152.7 lower respiratory tract infections (95% CI 151.3–154.1) and 99.6 urinary tract infections (95% CI 98.4–100.8).
All infection rates were found to be increasing over time.
Within 28 days of pneumonia, 81.4% of patients were hospitalized and 32.1% had died.
An appreciable proportion of 28-day hospitalizations after lower respiratory or urinary tract infection were for cardiovascular conditions.
Introduction
Community-acquired infections are common among older adults, with a high burden of morbidity and mortality 1–4. Pneumonia is the second most common cause of death in people aged ≥75 years in England 5. Hospitalizations for infection are rising: age-standardized hospital admission rates for community-acquired pneumonia and urinary tract infections more than doubled between 2000/2001 and 2010/2011 in England 6. The increase in pneumonia hospitalizations has been most marked among older adults 7. The cost of hospitalizations was estimated at £235 m for pneumonia and £316 m for urinary tract infection in 2010/2011 6. Diabetes is a risk factor for hospitalization with and mortality from infection 8–13. A higher prevalence of comorbidities such as diabetes mellitus has been suggested as a driving factor for the rising burden of infection-related hospitalizations 6,7.
The number of adults in England with diabetes mellitus is predicted to rise from 3.1 million in 2010 to 4.6 million by 2030 14. Data on the burden of infection among older adults with diabetes from a community or primary care perspective, and their relationship with hospitalization and mortality, are scarce. A large cohort study in Canada described the incidence of a range of infections among people with diabetes of all ages, but not by age group, and noted that the association between diabetes and infection changed with age 15. Studies of risk factors for community-acquired infection among older adults have not been designed for precise estimates of infection incidence among the subgroup with diabetes 16,17.
Understanding the burden of infections in the community among older adults with diabetes, and the short-term risk of hospitalization and mortality after infection, is essential to communicating risk of infections to patients, for designing effective preventive care strategies, and for future healthcare service planning.
The aim of the present study was to describe the incidence of acute community-acquired infections (urinary tract infections, lower respiratory tract infections, including pneumonia as a subset, and sepsis) among the UK population aged ≥ 65 years with diabetes mellitus, and the short-term hospitalization and mortality rates following these infections.
Materials and methods
Data sources
The Clinical Practice Research Datalink (CPRD, formerly GPRD) is a large UK database of anonymized primary care medical records 18. We used the May 2011 dataset, comprising 12.8 million patient records at 627 practices. Diagnoses are entered directly by healthcare workers during the patient consultation, in the form of Read codes. The records also include patient demographics, prescriptions, health behaviours, test results and interactions with secondary care such as referrals. The CPRD population has been found to be representative of the general UK population 19. The CPRD asserts a range of data quality checks, and the validity of recorded diagnoses in the CPRD is generally high 19,20.
Another strength of the CPRD is the availability of data linkage for the subset of patients (> 50% of the total patients included in the CPRD) registered at practices in England which participate in CPRD data linkage 18. The present study used linked data on dates and diagnoses for all hospital inpatient admissions to NHS hospitals in England from Hospital Episodes Statistics, and mortality and socio-economic status from the Office for National Statistics 21,22.
Study population and follow-up
Patients in CPRD aged ≥65 years with a diagnostic code for diabetes mellitus were eligible for inclusion in the study. Two lists of Read codes were used, ‘defining’ codes (sufficient evidence of diabetes) and ‘possible’ codes (requiring confirmation). All patients with a ‘defining’ code were included (e.g. C10F.11 ‘Type II diabetes mellitus’). Patients with a ‘possible’ code (e.g. 9N1Q.00 ‘Seen in diabetic clinic’) were only included if there was a history of prescription of insulin or oral antidiabetes medication (Tables S1 and S2).
Patients entered the study at whichever was the latest of the following timepoints: the diabetes diagnosis date, 65th birthday, 1 year after practice registration date, the date the practice reached CPRD quality control standards or 1 April 1997. The 1-year delay from registration was to prevent overestimation of incidence from recording of historical events at new patient registration and early consultations 23. Patients exited the study at whichever was the earliest of the following timepoints: date of death (recorded in CPRD or Office for National Statistics data), patient transferring out from the practice; last data collection from the practice, or 31 March 2011.
Definition of infections
We studied urinary tract infection, lower respiratory tract infection, pneumonia and sepsis. Urinary tract infections and lower respiratory tract infections are common and are responsible for a high burden of morbidity and mortality among the older population, while pneumonia and sepsis are rare but serious events which we would expect to be well-ascertained in primary care records. Urinary tract infections, lower respiratory tract infections and sepsis were defined and analysed separately, while pneumonia was a subset of lower respiratory tract infections.
Each infection was defined by a clinical diagnosis recorded in primary care or hospital discharge records. To avoid overestimation from repeat attendances for the same infection, diagnostic codes recorded within 28 days of one another were attributed to a single episode of infection, with the index date defined by the first diagnostic code, and duration until 28 days after the last diagnostic code. Three clinical epidemiologists agreed each list of diagnostic codes to be used to define each infection before data analysis. Code lists are available on request.
Pneumonia codes were a subset of lower respiratory tract infection codes. If any lower respiratory tract infection included a pneumonia code, the pneumonia index date was the date of the first diagnosis of pneumonia, and the pneumonia episode ended on the end-date of the lower respiratory tract infection episode within which it occurred.
For conservative estimates, Read code IJ4.00 ‘Suspected urinary tract infection’ alone did not define an infection but did continue an ongoing episode of urinary tract infection if it occurred within 28 days of another urinary tract infection diagnostic code. This was designed to avoid over-recording of urinary tract infections from non-confirmed diagnoses or from repeat attendances with ongoing infection.
An infection was designated as hospital-acquired: if the index diagnosis occurred during or within 14 days of a hospital admission (recorded in Hospital Episodes Statistics records for patients with linked data, or recorded in the CPRD for patients with unlinked data); if the index diagnosis was recorded in a hospital discharge record, but was not the primary reason for hospital admission; or if any of the diagnoses in the episode recorded that the infection was postoperative or otherwise hospital-acquired (e.g. K190299 ‘Postoperative urinary infection’). Other infections were classified as community-acquired. These were necessarily either first recorded in primary care records, or represented the primary reason for hospital admission. The results presented are for community-acquired infections only: hospital-acquired infections were not included as outcomes.
Patients were at risk of a community-acquired infection while eligible for study inclusion except during an infection episode (community- or hospital-acquired) or during a Hospital Episodes Statistics hospitalization spell or the 14 days after hospital discharge. Time at risk was calculated separately for each type of infection; a patient could be at risk of a lower respiratory tract infection despite an ongoing urinary tract infection, for example.
The methods described above were based on or adapted from previous work by Millett et al. 24 defining lower respiratory tract infections and pneumonia.
Covariates
Socio-economic status was described using the index of multiple deprivation, a composite area-level marker of deprivation 22. The Office for National Statistics index of multiple deprivation estimates from 2007 were linked to individual patient records by the postcode of patient residence. Smoking status and BMI were described using CPRD data at the start of follow-up (baseline). Comorbidities, medications and vaccination status were described using CPRD records at baseline and at study exit. No influenza vaccinations recorded > 3 years before study entry were included at either timepoint. For baseline comorbidities, medications and pneumococcal vaccination, any record of positive status in the patient’s records from their registration at the practice up to or including the study entry date was eligible. Comorbidities were based on diagnostic Read codes and included cardiovascular disease (myocardial infarction, other ischaemic heart disease, congestive heart failure, stroke and transient ischaemic attacks), chronic lung disease (chronic obstructive pulmonary disease and chronic interstitial lung diseases but not asthma) and peripheral vascular disease. Code lists are available on request.
Data analysis
All data were used to calculate incidence and mortality estimates. Analyses were restricted to patients with Hospital Episodes Statistics-linked data for description of hospitalizations. Incidence rates were calculated for each infection using Poisson regression with lexis expansions for age and calendar year, and a random-effects model to accommodate multiple episodes. We conducted likelihood ratio tests for the association of sex with incidence of each infection type, and for the sex-specific linear association of age group with incidence of each infection type. Age standardization used the Office for National Statistics mid-year population estimate for the UK in 2004 22. Age-standardized regional rates were presented only within England, as Hospital Episodes Statistics-linked data are not available for Scotland, Wales and Northern Ireland, and the inability to exclude time in hospital for these regions meant their rates were not comparable. For each infection, the proportion of infections among patients with Hospital Episodes Statistics-linked data who were admitted to hospital within 4 weeks of diagnosis, and the subset of these admitted to hospital on the day of admission, were calculated. The cause of admissions for patients admitted within 4 weeks was described using the primary diagnosis of the first episode of the first admission after infection onset. For each infection, the 4-week case-fatality rate using all-cause mortality was calculated, using deaths recorded in Office for National Statistics-linked mortality data or CPRD records.
Data analysis was conducted using Stata version 12.0, except age standardization, for which Microsoft Excel 2007 was used.
Ethics approval
The study was approved by the Independent Scientific Advisory Group of the CPRD (ISAC reference 11_033) and the London School of Hygiene and Tropical Medicine Ethics Committee (LSHTM reference 6116).
Results
The study population comprised 218 805 patients, with up to 7 years follow-up (Table1). Hospital Episodes Statistics data linkage was available for 128 373 patients (58.7%). The median (interquartile range) age of the cohort at baseline was 71 (65–77 years). Few patients (n = 8137; 3.9%) were medicated with insulin alone (with no history of oral antidiabetes medications), consistent with a preponderance of Type 2 diabetes mellitus in this age group. At baseline, over a third of the cohort had a history of cardiovascular comorbidity and 74.8% had received an influenza vaccination within the previous 3 years. Before the end of follow-up, 76.7% of patients had received a pneumococcal vaccine: 28.7% of unvaccinated patients (14 579/50 855) exited the study before 2003, when the pneumococcal vaccine was phased in for people > 60 years old 25.
Table 1.
Characteristics of study population at baseline and before end of follow-up (N = 218 805)
| At Baseline | Before end of follow-up | |||
|---|---|---|---|---|
| Men | Women | Men | Women | |
| Median (interquartile range) time in study, years* | 3.9 (1.7–6.1) | 4.0 (1.7–7.1) | ||
| Median (interquartile range) age, years | 70 (65–76) | 72 (66–79) | ||
| Ethnicity, n (%) | ||||
| Bangladeshi | 85 (0.8) | 60 (0.1) | ||
| Black African | 125 (0.1) | 127 (0.1) | ||
| Black Caribbean | 477 (0.4) | 519 (0.5) | ||
| Black Other | 88 (0.1) | 83 (0.1) | ||
| Chinese | 86 (0.1) | 85 (0.1) | ||
| Indian | 836 (0.8) | 725 (0.7) | ||
| Mixed | 89 (0.1) | 99 (0.1) | ||
| Other Asian | 216 (0.2) | 169 (0.2) | ||
| Pakistani | 270 (0.2) | 219 (0.2) | ||
| White | 44 400 (40.1) | 43 524 (0.3) | ||
| Other | 446 (0.4) | 433 (0.4) | ||
| Missing or unknown | 63 617 (57.4) | 62 027 (57.4) | ||
| Socio-economic status: index of multiple deprivation quintile, n (%) | ||||
| 1 (least deprived) | 12 105 (10.9) | 10 485 (9.7) | ||
| 2 | 14 037 (12.7) | 12 831 (11.9) | ||
| 3 | 12 290 (11.1) | 11 893 (11.0) | ||
| 4 | 11 595 (10.5) | 12 273 (11.4) | ||
| 5 (most deprived) | 8626 (7.8) | 9494 (8.8) | ||
| Not available | 52 082 (47.0) | 51 094 (47.3) | ||
| BMI, n (%) | ||||
| <18.5 kg/m2 | 619 (0.6) | 1741 (1.6) | ||
| 18.5–24.9 kg/m2 | 22 140 (20.0) | 22 691 (21.2) | ||
| 25–29.9 kg/m2 | 47 111 (42.5) | 34 086 (31.5) | ||
| 30–34.9 kg/m2 | 26 076 (23.5) | 24 279 (22.5) | ||
| ≥35 kg/m2 | 9628 (8.7) | 16 505 (15.3) | ||
| Missing | 5161 (4.7) | 8768 (8.1) | ||
| Smoking status, n (%) | ||||
| Non-smoker | 28 844 (26.1) | 54 759 (50.7) | ||
| Current | 16 380 (14.8) | 12 812 (11.9) | ||
| Previous | 63 764 (57.6) | 37 650 (34.8) | ||
| Missing | 1747 (1.6) | 2849 (2.6) | ||
| Comorbidities, n (%) | ||||
| Cardiovascular disease | 43 927 (39.7) | 34 979 (32.4) | 55 539 (50.2) | 46 439 (43.0) |
| Chronic lung disease | 9258 (8.4) | 7112 (6.6) | 14 524 (13.1) | 10 939 (10.1) |
| Peripheral vascular disease | 9963 (9.0) | 5609 (5.2) | 16 195 (14.6) | 9488 (8.8) |
| Vaccinations, n (%) | ||||
| Pneumococcal: ever | 55 641 (50.2) | 51 103 (47.3) | 87 418 (78.9) | 80 532 (74.5) |
| Influenza: < 3 years before study entry | 83 479 (75.4) | 80 288 (74.3) | 100 296 (90.6) | 95 688 (88.5) |
| Antidiabetes medications, n (%) | ||||
| Insulin only | 4260 (3.8) | 4049 (3.7) | 4242 (3.8) | 3897 (3.6) |
| Oral medication only | 41 268 (37.3) | 37 806 (35.0) | 59 249 (53.5) | 55 255 (51.1) |
| Both insulin and oral medication | 6529 (5.9) | 6082 (5.6) | 15 924 (14.4) | 14 491 (13.4) |
| None recorded | 58 678 (53.0) | 60 133 (55.6) | 31 320 (28.3) | 34 427 (31.9) |
| Total | 110 735 | 108 070 | ||
* Time in study includes person-time as a hospital inpatient or during an infection, which was excluded from time at risk of community-acquired infection.
Incidence by age and sex
For all infections, incidence increased sharply with increasing age (Table2). For example, pneumonia incidence was 6–8 times higher among patients aged ≥85 years than patients aged 65–69 years.
Table 2.
Infection incidence by age and sex among older people with diabetes (N = 218 805)
| Incidence rate /1000 person-years (95% CI) | |||||||
|---|---|---|---|---|---|---|---|
| Age group | 65–69 years | 70–74 years | 75 –79 years | 80–84 years | ≥85 years | P* | |
| Lower respiratory tract infection | Men | 135.2 (129.6–140.8) | 145.2 (139.8–150.7) | 159.9 (153.8–166.0) | 161.8 (155.9–167.8) | 217.9 (209.2–226.7) | <0.001 |
| Women | 137.1 (134.1–140.1) | 145.2 (142.2–148.1) | 151.9 (148.7–155.1) | 167.4 (163.5–171.4) | 208.9 (203.2–214.6) | <0.001 | |
| Pneumonia | Men | 4.51 (4.15–4.87) | 6.91 (6.45–7.36) | 11.03 (10.36–11.71) | 18.91 (17.69–20.14) | 36.88 (34.19–39.56) | <0.001 |
| Women | 4.19 (3.79–4.59) | 5.81 (5.35–6.26) | 7.83 (7.26 –8.39) | 13.67 (12.75–14.60) | 27.24 (25.51–28.96) | <0.001 | |
| Urinary tract infection | Men | 29.4 (28.3–30.5) | 40.8 (39.4–42.1) | 59.1 (57.1–61.1) | 83.4 (80.0–86.7) | 141.2 (134.0–148.5) | <0.001 |
| Women | 110.2 (107.5–112.9) | 123.4 (120.6–126.2) | 146.1 (142.8–149.3) | 175.0 (170.8–179.3) | 223.0 (216.6–229.3) | <0.001 | |
| Sepsis | Men | 1.53 (1.32–1.74) | 1.97 (1.73–2.21) | 2.92 (2.58–3.27) | 3.92 (3.38–4.45) | 5.77 (4.83–6.71) | 0.75 |
| Women | 1.87 (1.60–2.13) | 1.92 (1.66–2.17) | 2.37 (2.08–2.66) | 2.81 (2.43–3.18) | 4.31 (3.77–4.86) | 0.02 | |
* Sex-specific likelihood ratio test for trend by age group.
Women were more likely to experience urinary tract infections than men in every age group, but this difference reduced with increasing age. For lower respiratory tract infections, the incidence was similar for men and women within each age group. For pneumonia, the incidence was higher among men than women for all age groups > 70 years.
Trends over time
The crude incidence of all infections increased over time (Fig.1A). For example, the crude incidence of lower respiratory tract infections among men was 117.1/1000 person-years in 1997 (95% CI 110.9–123.4), and 154.6 /1000 person-years in 2010 (95% CI 150.5–158.8). Much of this trend disappeared after standardization for age (Fig.1B).
Figure 1.
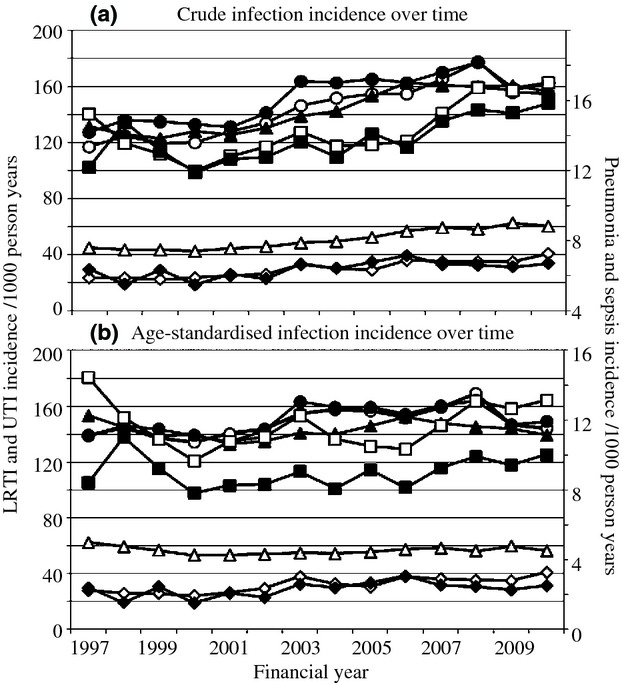
Crude and age-standardized infection incidence rates by sex over time among older people with diabetes (N = 218 805). UTI, urinary tract infection; men, white symbols; women, black symbols; circles, lower respiratory tract infection; squares, pneumonia; triangles, UTI; diamonds, sepsis.
Differences by region
For lower respiratory tract infections, the highest incidence rates were in the North West (men 139.9/1000 person-years [95% CI 140.2–167.6]; women 177.5/1000 person-years [163.3–191.7]), Yorkshire and the Humber and the West Midlands regions, while London experienced the lowest incidence (men 116.8/1000 person-years [95% CI 112.1–121.6]; women 114.6/1000 person-years [110.3–119.0] (Fig.2). For urinary tract infection, the two regions with the highest incidence were the West Midlands (men 74.5/1000 person-years [95% CI 69.6–79.4]; women 176.9/1000 person-years [95% CI 169.7–184.1]) and the North East for both sexes (Table S3). Incidence rates by region are not presented for sepsis and pneumonia because of small numbers of events. Regional variation in lower respiratory tract infection incidence was similar for men and women.
Figure 2.
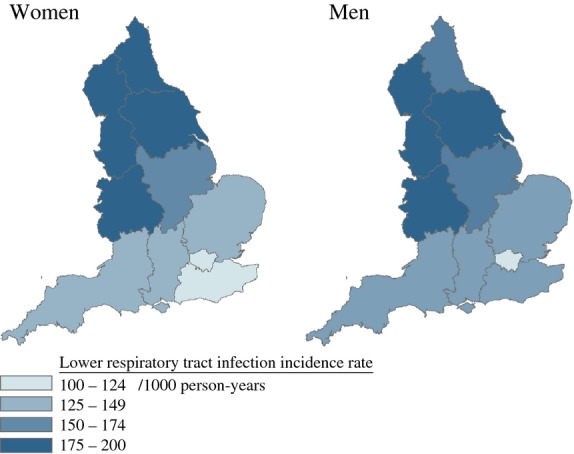
Age-standardized lower respiratory tract infection rates by region among older people with diabetes (patients eligible for Hospital Episode Statistics data linkage, N = 128 373). Boundary data provided through EDINA UKBORDERS with the support of the Economic and Social Research Council (ESRC) and Jisc and is copyright of the Crown.
Hospitalizations
The proportion of infections that resulted in hospitalization within the subsequent 4 weeks were highest for pneumonia and sepsis and lowest for lower respiratory tract infections as a whole (including pneumonia) and urinary tract infections (Table3); however, the number of hospitalizations after an urinary tract infections diagnosis exceeded the number after pneumonia and sepsis combined, for both same-day and 28-day hospitalizations. Most patients who were hospitalized for pneumonia and sepsis were admitted on the day of diagnosis. For lower respiratory tract infections and urinary tract infections, a large proportion of hospitalizations within 4 weeks were not on the day of infection diagnosis (6588/16 835; 39.1%, and 5159/11 651; 44.3%, respectively), and a notable proportion (1198/16 835; 7.1%, and 596/11 651; 5.1%, respectively) were admitted for a cardiovascular condition (International Classification of Diseases codes 10, chapter I ‘Diseases of the circulatory system’).
Table 3.
Infection incidence and 28-day all-cause hospitalization and mortality after infection onset among older people with diabetes (N = 218 805)
| Number of infections | Crude incidence rate /1000 person-years (95% CI) | P** | 28-day all-cause mortality | All-cause hospitalization* | |||||||
|---|---|---|---|---|---|---|---|---|---|---|---|
| Eligible infections n | On day of onset | ≤28 days after onset | |||||||||
| n | % | n | % | n | % | ||||||
| Lower respiratory tract infection | Men | 68 183 | 148.6 (146.7–150.5) | <0.001 | 2831 | 4.2 | |||||
| Women | 71 118 | 156.8 (154.8–158.9) | 2854 | 4.0 | |||||||
| Total | 139 301 | 152.7 (151.3–154.1) | 5685 | 4.1 | 83 501 | 10 247 | 12.3 | 16 835 | 20.1 | ||
| Pneumonia | Men | 5095 | 10.7 (10.4–11.1) | 0.001 | 1558 | 30.6 | |||||
| Women | 4602 | 9.9 (9.5–10.2) | 1557 | 33.8 | |||||||
| Total | 9697 | 10.3 (10.0–10.5) | 3115 | 32.1 | 6802 | 5297 | 77.8 | 5534 | 81.4 | ||
| Urinary tract infection | Men | 24 180 | 51.4 (50.49–52.40) | <0.001 | 582 | 2.4 | |||||
| Women | 67 394 | 147.9 (145.7–150.2) | 890 | 1.3 | |||||||
| Total | 91 574 | 99.6 (98.4–100.8) | 1472 | 1.6 | 57 683 | 6492 | 11.3 | 11 651 | 20.2 | ||
| Sepsis | Men | 1246 | 2.53 (2.38–2.68) | 0.75 | 374 | 30.0 | |||||
| Women | 1215 | 2.49 (2.34–2.64) | 406 | 33.4 | |||||||
| Total | 2461 | 2.51 (2.40–2.62) | 780 | 31.7 | 1407 | 1057 | 75.1 | 1141 | 81.1 | ||
* Among patients eligible for Hospital Episode Statistics data linkage (N = 128 373).
** Likelihood ratio test for difference in crude incidence rate by gender.
Mortality
The case-fatality rate after pneumonia (32.1%) was similar to that after sepsis [31.7% (Table3)]. Although the 28-day case-fatality rate after urinary tract infection was lower (1.6%), the absolute number of deaths in the 28-days after diagnosis of urinary tract infections (n = 1472) was still high compared with those after sepsis (n = 780) because of the higher incidence rate of urinary tract infections. The case-fatality rate was similar for men and women for each infection.
Discussion
To our knowledge this is the first large cohort study to give detailed estimates of community-acquired infection rates among older people with diabetes mellitus, including infections managed in primary care. There is a high burden of community-acquired infection among older people with diabetes, lower respiratory tract infections having the highest incidence, followed by urinary tract infections. The incidence of all infections increased with age (particularly pneumonia) and increased over the study period; our age-standardization analyses suggest that this increasing trend was driven by the changing age structure of the population. Regional variation in age-standardized rates could be attributable to the prevalence of risk factors for infection such as socio-economic status, smoking, overweight and obesity, or diabetes control.
For lower respiratory tract infections and urinary tract infections, it is interesting that a high proportion of hospitalizations within 28 days were not on the day of diagnosis. This could reflect high underlying hospitalization rates in this cohort, or could be attributable to exacerbation of underlying comorbidities by acute infections. The considerable number of hospitalizations within 4 weeks of lower respiratory tract infections and urinary tract infections with a cardiovascular cause of admission (International Classification of Diseases codes 10 chapter I ‘Diseases of the circulatory system’) are particularly intriguing, as both infections have been found to exacerbate underlying cardiovascular comorbidity 26.
Estimates of infection incidence rates specifically among patients with diabetes are scarce. A cohort study of patients with diabetes of all ages reported higher rates of pneumonia and sepsis than the present study, but included both hospital-acquired and community-acquired infections together 15.
A cohort study in the CPRD of the general population aged ≥65 years (from which we drew our population of patients with diabetes), using the same methodology as the present study, found an incidence of 122.9/1000 person-years for lower respiratory tract infection and 8.0/1000 person-years for pneumonia among the general population aged ≥65 person-years 24. The crude incidence of lower respiratory tract infection and pneumonia observed in the present study is ˜50% higher. This could be consistent with a direct effect of diabetes mellitus on infection incidence, or a higher prevalence of risk factors for infection among patients with diabetes, such as cardiovascular comorbidity or obesity. The rates of pneumonia and urinary tract infections observed in the present study are similarly raised compared with other cohort studies of the general population of older people in the UK/Europe 16,27.
Our sepsis estimate is lower than the rate of community-acquired bloodstream infections in a large cohort study in Canada, which found a rate of 4.5/1000 person-years (95% CI 3.7–5.6) among a selected subset of the general population aged ≥65 years with normal kidney function 28; however, the Canadian study measured laboratory-defined bacteraemia, while our outcome of interest was clinically diagnosed sepsis.
The regional variation of lower respiratory tract infection incidence within England has a similar pattern to that observed in the general population 29.
The main strengths of the present study are: the large, nationally representative cohort of an older population with diabetes followed up over a prolonged period; the use of primary care medical records to ascertain medically diagnosed community-acquired infections more fully than previous hospital-based studies; detailed definitions of community-acquired infections including distinguishing repeated infection-related consultations within 28 days from recurrent infections; use of CPRD hospitalization codes and linked hospital data to exclude infections within 14 days of discharge from hospital and to remove hospitalization periods from time at risk for a more accurate estimation of time at risk than previous studies; and the range of infections considered.
The study methods were designed to produce conservative estimates of incidence rates, as follows. We used strict criteria to identify and exclude possible hospital-associated infections; we did not count diagnoses as new episodes of infection if the record fell within 28 days of a previous code for the same infection; patients without Hospital Episodes Statistics data linkage had infections excluded from incidence rates using CPRD indicators of possible hospital-acquired provenance (such as postoperative infection codes) without removal of hospitalized time from time at risk.
Potential limitations include secular changes in management and diagnosis, but in the present study we saw no evidence of this. We could not remove hospitalizations from person-time at risk for patients with no Hospital Episodes Statistics data linkage, which will have led to a slight underestimate of infection rates.
Conclusions
The present study quantifies the high risk of community-acquired infection among older people with diabetes, and the proportion of patients who are admitted to hospital or die within 4 weeks of infection onset. This will facilitate discussions about risk of infections among older patients with diabetes. Knowledge of regional variations and the steep increase in risk with age among older people may assist with designing effective preventive care strategies. Healthcare planners should consider the high infection incidence in primary care and the proportion and pattern of 28-day hospital admission in planning future healthcare provision for this large and growing section of the UK population and of healthcare users.
Future research should clarify the risk factors for infection incidence, hospitalization and mortality, in particular any modifiable risk or protective factors, among this growing population.
Funding sources
The present work was supported by the National Institute for Health Research [CDF 2010-03-32 to SLT]; and Kidney Research UK [ST2/2011 to HIM]. The views expressed in this publication are those of the authors and not necessarily those of the UK National Health Service, the National Institute for Health Research or the Department of Health. The financial supporters of the study had no role in the study design, data collection and analysis, decision to publish, or preparation of the manuscript.
Competing interests
None declared.
Acknowledgments
We thank Dr Jennifer Quint, who developed the code lists used for lower respiratory tract infection and pneumonia together with S.L.T.
Supporting Information
Additional Supporting Information may be found in the online version of this article:
Table S1.Diabetes mellitus ‘defining’ Read codes used alone to define eligibility for study.
Table S2. Diabetes mellitus ‘possible eligibility’ Read codes used to define eligibility for study only in combination with a history of an antidiabetes medication.
References
- Ruben FL, Dearwater SR, Norden CW, Kuller LH, Gartner K, Shalley A, et al. Clinical infections in the noninstitutionalized geriatric age group: methods utilized and incidence of infections. The Pittsburgh Good Health Study. Am J Epidemiol. 1995;141:145–157. doi: 10.1093/oxfordjournals.aje.a117402. [DOI] [PubMed] [Google Scholar]
- Laupland KB. Gregson DB, Flemons WW, Hawkins D, Ross T, Church DL. Burden of community-onset bloodstream infection: a population-based assessment. Epidemiol Infect. 2007;135:1037–1042. doi: 10.1017/S0950268806007631. [DOI] [PMC free article] [PubMed] [Google Scholar]
- Laupland KB, Ross T, Pitout JD, Church DL, Gregson DB. Community-onset urinary tract infections: a population-based assessment. Infection. 2007;35:150–153. doi: 10.1007/s15010-007-6180-2. [DOI] [PubMed] [Google Scholar]
- Kaplan V. Angus DC, Griffin MF, Clermont G, Scott Watson R, Linde-Zwirble WT. Hospitalized community-acquired pneumonia in the elderly: age- and sex-related patterns of care and outcome in the United States. Am J Respir Crit Care Med. 2002;165:766–772. doi: 10.1164/ajrccm.165.6.2103038. [DOI] [PubMed] [Google Scholar]
- Ruth K, Verne J. 2010. Deaths in older adults in England, National End of Life Care Intelligence Network, Bristol, UK. Available at http://www.endoflifecare-intelligence.org.uk/resources/publications/deaths_in_older_adults Last accessed 6 January 2014.
- Bardsley M, Blunt I, Davies S, Dixon J. Is secondary preventive care improving? Observational study of 10-year trends in emergency admissions for conditions amenable to ambulatory care. BMJ Open. 2013;3 doi: 10.1136/bmjopen-2012-002007. [DOI] [PMC free article] [PubMed] [Google Scholar]
- Trotter CL, Stuart JM, George R, Miller E. Increasing hospital admissions for pneumonia. England. Emerg Infect Dis. 2008;14:727–733. doi: 10.3201/eid1405.071011. [DOI] [PMC free article] [PubMed] [Google Scholar]
- Kornum JB, Thomsen RW, Riis A, Lervang HH, Schonheyder HC, Sorensen HT. Diabetes, glycemic control, and risk of hospitalization with pneumonia: a population-based case-control study. Diabetes Care. 2008;31:1541–1545. doi: 10.2337/dc08-0138. [DOI] [PMC free article] [PubMed] [Google Scholar]
- Joshi N, Caputo GM, Weitekamp MR, Karchmer AW. Infections in patients with diabetes mellitus. N Engl J Med. 1999;341:1906–1912. doi: 10.1056/NEJM199912163412507. [DOI] [PubMed] [Google Scholar]
- Seshasai SR, Kaptoge S, Thompson A, Di Angelantonio E, Gao P, Sarwar N, et al. Diabetes mellitus, fasting glucose, and risk of cause-specific death. N Engl J Med. 2011;364:829–841. doi: 10.1056/NEJMoa1008862. [DOI] [PMC free article] [PubMed] [Google Scholar]
- Seminog OO, Goldacre MJ. Risk of pneumonia and pneumococcal disease in people hospitalized with diabetes mellitus: English record-linkage studies. Diabet Med. 2013;30:112–119. doi: 10.1111/dme.12260. [DOI] [PubMed] [Google Scholar]
- Vardakas KZ, Siempos II, Falagas ME. Diabetes mellitus as a risk factor for nosocomial pneumonia and associated mortality. Diabet Med. 2007;24:1168–1171. doi: 10.1111/j.1464-5491.2007.02234.x. [DOI] [PubMed] [Google Scholar]
- Knapp S. Diabetes and Infection: Is There a Link? - A Mini-Review. Gerontology. 2012;59:99–104. doi: 10.1159/000345107. [DOI] [PubMed] [Google Scholar]
- Holman N, Forouhi NG, Goyder E, Wild SH. The Association of Public Health Observatories (APHO) Diabetes Prevalence Model: estimates of total diabetes prevalence for England, 2010-2030. Diabet Med. 2011;28:575–582. doi: 10.1111/j.1464-5491.2010.03216.x. [DOI] [PubMed] [Google Scholar]
- Shah BR, Hux JE. Quantifying the risk of infectious diseases for people with diabetes. Diabetes Care. 2003;26:510–513. doi: 10.2337/diacare.26.2.510. [DOI] [PubMed] [Google Scholar]
- Caljouw MA, den Elzen WP, Cools HJ, Gussekloo J. Predictive factors of urinary tract infections among the oldest old in the general population. A population-based prospective follow-up study. BMC Med. 2011;9:57. doi: 10.1186/1741-7015-9-57. [DOI] [PMC free article] [PubMed] [Google Scholar]
- Sliedrecht A, den Elzen WP, Verheij TJ, Westendorp RG, Gussekloo J. Incidence and predictive factors of lower respiratory tract infections among the very elderly in the general population. The Leiden 85-plus Study. Thorax. 2008;63:817–822. doi: 10.1136/thx.2007.093013. [DOI] [PubMed] [Google Scholar]
- CPRD. The Clinical Practice Research Datalink - CPRD 2012, 30 August 2012; Available from: http://www.cprd.com/intro.asp Last accessed 6 January 2014.
- Walley T, Mantgani A. The UK General Practice Research Database. Lancet. 1997;350:1097–1099. doi: 10.1016/S0140-6736(97)04248-7. [DOI] [PubMed] [Google Scholar]
- Herrett E, Thomas SL, Schoonen WM, Smeeth L, Hall AJ. Validation and validity of diagnoses in the General Practice Research Database: a systematic review. Br J Clin Pharmacol. 2010;69:4–14. doi: 10.1111/j.1365-2125.2009.03537.x. [DOI] [PMC free article] [PubMed] [Google Scholar]
- The Health and Social Care Information Centre. HESonline 2012, 14 September 2012; Available from: www.hesonline.nhs.uk Last accessed 6 January 2014.
- Office for National Statistics. Office for National Statistics 2012, 14 September 2012; Available from: www.ons.gov.uk Last accessed 6 January 2014.
- Lewis JD, Bilker WB, Weinstein RB, Strom BL. The relationship between time since registration and measured incidence rates in the General Practice Research Database. Pharmacoepidemiol Drug Saf. 2005;14:443–451. doi: 10.1002/pds.1115. [DOI] [PubMed] [Google Scholar]
- Millett ER, Quint JK, Smeeth L, Daniel RM, Thomas SL. Incidence of Community-Acquired Lower Respiratory Tract Infections and Pneumonia among Older Adults in the United Kingdom: A Population-Based Study. PLoS One. 2013;8:e75131. doi: 10.1371/journal.pone.0075131. [DOI] [PMC free article] [PubMed] [Google Scholar]
- Pebody RG, Begum F, Gates P, Noakes K, Salisbury D. Influenza vaccination coverage in England, 2000-2008. Euro Surveill. 2008;13 : 19074. [PubMed] [Google Scholar]
- Smeeth L, Thomas SL, Hall AJ, Hubbard R, Farrington P, Vallance P. Risk of myocardial infarction and stroke after acute infection or vaccination. N Engl J Med. 2004;351:2611–2618. doi: 10.1056/NEJMoa041747. [DOI] [PubMed] [Google Scholar]
- Myles PR, McKeever TM, Pogson Z, Smith CJ, Hubbard RB. The incidence of pneumonia using data from a computerized general practice database. Epidemiol Infect. 2009;137:709–716. doi: 10.1017/S0950268808001428. [DOI] [PubMed] [Google Scholar]
- James MT, Laupland KB, Tonelli M, Manns BJ, Culleton BF, Hemmelgarn BR. Risk of bloodstream infection in patients with chronic kidney disease not treated with dialysis. Arch Intern Med. 2008;168:2333–2339. doi: 10.1001/archinte.168.21.2333. [DOI] [PubMed] [Google Scholar]
- Davies S. Annual Report of the Chief Medical Officer, Volume One, 2011, On the State of the Public’s Health. London: Department of Health; 2012. [Google Scholar]
Associated Data
This section collects any data citations, data availability statements, or supplementary materials included in this article.
Supplementary Materials
Table S1.Diabetes mellitus ‘defining’ Read codes used alone to define eligibility for study.
Table S2. Diabetes mellitus ‘possible eligibility’ Read codes used to define eligibility for study only in combination with a history of an antidiabetes medication.