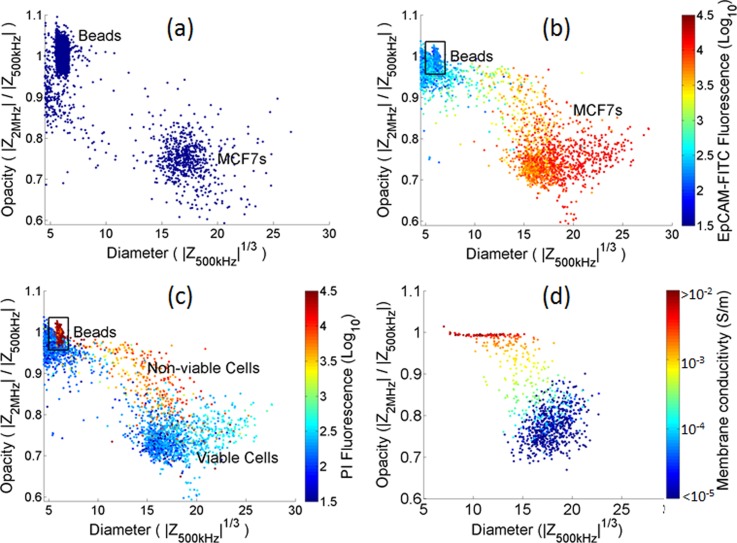
FIG. 2.
Scatterplots of the impedance data plotted as opacity (Z at 2 MHz/Z at 0.5 MHz) vs diameter (3√Z at 0.5 MHz). (a) Mixture of freshly harvested MCF7s and 6 μm diameter beads (10000 events). (b) and (c) mixture containing MCF7s suspended in PBS at room temperature for 2 h and 6 μm diameter beads (10000 events) colour coded for (b) EpCAM fluorescence and (c) PI fluorescence. (d) A simulated population of 1000 MCF7 cells, each with a different membrane conductivity in the range 10−8–10−2 S/m. The cells were simulated using the following parameters: suspending medium (ε = 80 and σ = 1.6 S/m), membrane (ε = 10, σ = 10−8–10−2 S/m, and thickness = 5 nm), cytoplasm (ε = 60 and σ = 0.5 S/m), nuclear envelope (ε = 20, σ = 8×10⁻³S/m, and d = 40 nm), and nucleoplasm (ε = 80 and σ = 2 S/m) (see the supplementary material).32

