Abstract
The ionic atmosphere around a nucleic acid regulates its stability in aqueous salt solutions. One major source of complexity in biological activities involving nucleic acids arises from the strong influence of the surrounding ions and water molecules on their structural and thermodynamic properties. Here, we implement a classical density functional theory for cylindrical polyelectrolytes embedded in aqueous electrolytes containing explicit (neutral hard sphere) water molecules at experimental solvent concentrations. Our approach allows us to include ion correlations as well as solvent and ion excluded volume effects for studying the structural and thermodynamic properties of highly charged cylindrical polyelectrolytes. Several models of size and charge asymmetric mixtures of aqueous electrolytes at physiological concentrations are studied. Our results are in good agreement with Monte Carlo simulations. Our numerical calculations display significant differences in the ion density profiles for the different aqueous electrolyte models studied. However, similar results regarding the excess number of ions adsorbed to the B-DNA molecule are predicted by our theoretical approach for different aqueous electrolyte models. These findings suggest that ion counting experimental data should not be used alone to validate the performance of aqueous DNA-electrolyte models.
I. INTRODUCTION
Nucleic acids (e.g., DNA and RNA) are essential components of living cells that allow organisms to store and transfer information to direct the synthesis of new proteins. These highly charged polyelectrolytes carry a −1e charge per nucleotide in its backbone. Water molecules and small ions screen the strong repulsive Coulombic interactions between the phosphate groups of nucleic acids. Experimental and theoretical data suggest the existence of a steep local concentration of counterions (i.e., cations) and the depletion of co-ions (i.e., anions) near the surface of nucleic acids due to these large Coulombic interactions.1 The ionic atmosphere around nucleic acids, which is essential for its proper biological functioning, is the main theme of the present work.
While performing their biological activities nucleic acids can bend, fold, denature, condense, and additionally they can also bind to other biomolecules, such as drugs, peptides, and proteins.2 During such events the charge densities of nucleic acids change and the surrounding ions and water molecules are redistributed. For instance, in order for a protein to bind DNA or RNA it displaces some surrounding waters and ions.3,4 Theory tells us that changes in the number of associated ions to nucleic acids is related to the derivative of the related free energy with respect to salt concentration.1 Thus, a better description of the ionic atmosphere around nucleic acids is important for explaining numerous salt dependent processes involving nucleic acids, such as melting, folding, packaging, and binding.
Although standard experimental techniques, such as X-ray crystallography can reveal ordered water molecules and specific ion binding sites around nucleic acids, they cannot provide a full description of the ionic atmosphere.5 Moreover, the identification of cation binding sites can be ambiguous since the electron density pattern of ions is similar to that of water molecules. Thus, ion counting experimental techniques such as anomalous small-angle X-ray scattering (ASAXS)5,6 and buffer equilibration and atomic emission spectroscopy (BE-AES)7 have been developed to probe the ionic atmosphere and measure the number of ions (both cations and anions) around nucleic acids. In parallel to the development of ion counting experimental techniques, improved treatment of long-range electrostatic interactions, new ion parametrizations, and enhanced sampling techniques now allow a detailed characterization of the ion distribution around nucleic acids with all-atom molecular dynamics (MD) simulations in the nanosecond and microsecond time scales.8–11 However, such explicit solvent simulations of nucleic acids in dilute electrolytes can be computationally very expensive.
Experimental and theoretical studies on the monovalent salt dependent thermodynamic and kinetic properties of nucleic acids support the use of the Poisson-Boltzmann equation (PBE), which is an implicit solvent (water) model that assumes a mean-field description of the ion distribution.12–15 However, these monovalent salt properties are only correctly predicted by the nonlinear PBE (NLBPE), not the linear PBE.16 Additionally, NLPBE and its size modified forms predict that like-charged polyelectrolytes always repel each other at all salt conditions. In fact, in the PBE approach the discrete nature of the solvent and ion-ion correlations are completely ignored. When these ingredients are taken into account properly, it is possible to provide a more realistic description of the structural and thermodynamic properties of highly charged polyelectrolytes as has been shown in previous studies of strongly correlated colloidal systems.17–28
More sophisticated approaches such as classical density functional theory (DFT)29–31 and integral equation theory (IET)32,33 of liquid solutions have been proposed to address the limitations of continuum macroscopic electrostatics in describing the ionic atmosphere around DNA. These theories provide a rigorous statistical mechanics approach to incorporate the microscopic nature of the solute and solvent in the description of solvation phenomena.34 Classical DFT and integral equation theories like three-dimensional reference interaction site model/hypernetted chain closure (3D-RISM/HNC)35 often succeed in reproducing the main features of solvation of the DNA duplexes in dense liquids in which the correlation and excluded volume effects become important.32,33 Studies based on these theories reveal charge inversion for divalent electrolyte mixtures at high concentrations for polyelectrolytes. The predictions of HNC36 and DFT in combination with Mean Spherical Approximation (MSA)37,38 for the integrated charge (IC) and the mean electrostatic potential (MEP) within the restricted primitive model electrolyte (RPM) show agreement with the corresponding MD/Monte Carlo (MC) simulation results and disagreement with PB theory.33,39,40 This shows the importance of ion-ion correlations and excluded volume effect for capturing the charge inversion around polyelectrolytes.
However, 3D-RISM predictions usually depend on approximate closures such as HNC, MSA, Kovalenko-Hirata (KH)41 to calculate density distribution profiles and involves time-consuming three-dimensional fast Fourier transform (3DFFT) calculations. For instance, IET has a more pronounced deviation from MC simulations than PB and DFT predictions for anions in monovalent electrolytes at low concentrations around DNA.33 However, for divalent mixtures, IET reproduces the ionic density profiles better than PB but less accurate than DFT when compared with the corresponding MC simulations.
To provide a more detailed and accurate characterization of the water and ionic atmosphere surrounding a highly charged cylindrical B-DNA model, we use a classical DFT, that extends the capabilities of classical mean-field theories. By using a combination between the MSA42,43 and the White Bear version II of the fundamental measure theory (FMTWBII),44 we are able to properly describe the interplay between ion-ion correlation and excluded volume effects. In addition to these effects, the solvent crowding effects are also taken into account by using an explicit solvent model, considering a neutral fluid of small hard spheres. We estimate the hard sphere excess free energy using FMTWBII. This theory provides one of the most accurate expressions for uncharged inhomogeneous multi-component hard sphere fluids that recovers a generalization of the Carnahan-Starling equation of state in the uniform-fluid limit.45 This expression plays a fundamental role in modeling highly asymmetric ion sizes and solvent excluded volume effects at experimental size and concentration. It also provides a more accurate description of the physics at solute-solvent interfaces.46 Additionally, we use the MSA for multi-component charged hard sphere fluids which accounts for the electrostatic ion correlations at low computational cost. The two aforementioned approximations are implemented along with a suitable decomposition of the excess free energy, which plays a key role in capturing the complex interplay between ion correlations and excluded volume effects. These features make our DFT approach particularly useful for studying the aqueous electrolyte dependent structural and thermodynamic properties of highly charged polyelectrolytes when a good balance between accuracy and efficiency is desired. Previously, we have successfully demonstrated the usefulness of our DFT approach for studying the structural and thermodynamic properties of electrical double layers around spherical polyelectrolyte in different aqueous polyelectrolytes.30
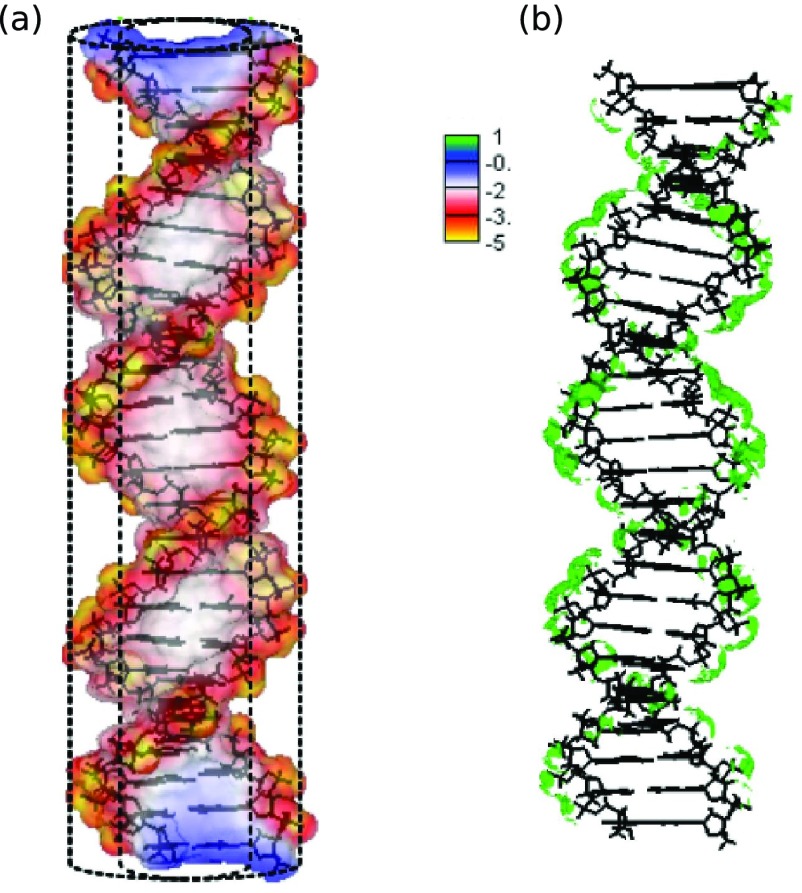
In this work, we focus the analysis on the excluded volume and ion-ion correlation effects on the properties of the ionic atmosphere around a model B-DNA. We apply the proposed computational model to study an infinitely long, and homogeneously charged cylinder, having the charge density of B-DNA shown in Fig. 1 in various ionic conditions; from pure NaCl, to electrolyte mixtures containing multivalent cations (i.e., NaCl and MgCl2, NaCl and AlCl3). First, this approach is validated against Monte Carlo simulations. Then, we calculate the ion density distributions in order to examine the role of asymmetric ion size and solvent excluded volume effects on the ionic atmosphere around a model B-DNA. Additionally, we calculate the IC and MEP to study charge inversion. Also, the theoretical predictions of the number of excess ions around B-DNA in electrolyte mixtures containing NaCl and MgCl2 are compared against experimental ion counting data7 using several models for ions and solvent molecules. Finally, we study the ionic potential of mean force by comparing the normalized MEP energy with hard sphere and electrostatic residual correlations.
FIG. 1.
The electrostatic potential (in 1/(βe), where ) of a 24 base pair ideal Watson-Crick B-DNA helix is mapped on its solvent-excluded molecular surface (a). The 6M Na+ iso-concentration contour around the same B-DNA helix is shown in green (b). The adaptive Cartesian grid-based Poisson-Boltzmann solver (CPB)79,80 is used with the following settings: the interior and exterior dielectric constant are set to 1 and 80, respectively, the solution temperature is 298.15 K and the NaCl concentration is 0.1M. An ion exclusion thickness of 2 Åis employed. A simplified B-DNA charge model, where each non-bridging phosphate oxygen is assigned a charge of −0.5e and all other atomic charges are set equal to zero, is employed to showcase sequence independent electrostatic features of the classical B-DNA.
II. THEORETICAL FORMULATION
A. Model
The system considered in this study consists of a rigid charged cylindrical solute surrounded by an electrolyte solution comprised of m ionic species. Each ion of species i is described by a hard sphere of diameter σi, charge ezi, and bulk density , where e is the electron charge and zi the corresponding ionic valence (see Tables I and II). The point-like charge model and Coulomb's law is used to describe the electrostatic interaction between ions in a continuum dielectric media of dielectric constant ε. The charge of the ions is placed at the center of ions such that the ion-ion pair-potential is given by
| (1) |
where ri, rj are the positions of ionic species i and j, respectively.
Table I.
Ion size models. The diameter of water molecules is set to 2.75 Å78 for all SPMs.
Table II.
Electrolyte mixtures and water concentrations.
| Water concentration (M) | ||||
|---|---|---|---|---|
| Ion sizes: Symmetric and Shannon, hydrated | ||||
| Electrolyte mixture concentration | SPM | PM | SPM | |
| a | 0.025M NaCl + 0.005M MgCl2 | 55.56 | 0 | 55.56 |
| b | 0.1M NaCl + 0.005M MgCl2 | 55.56 | 0 | 52.33 |
| c | 1M NaCl + 0.125M MgCl2 | 55.56 | 0 | 19.86 |
| d | 1M NaCl + 0.25M MgCl2 | 55.56 | 0 | 13.10 |
| e | 1M NaCl + 0.125M AlCl3 | 55.56 | 0 | 16.90 |
| f | 1M NaCl + 0.25M AlCl3 | 55.56 | 0 | 10.00 |
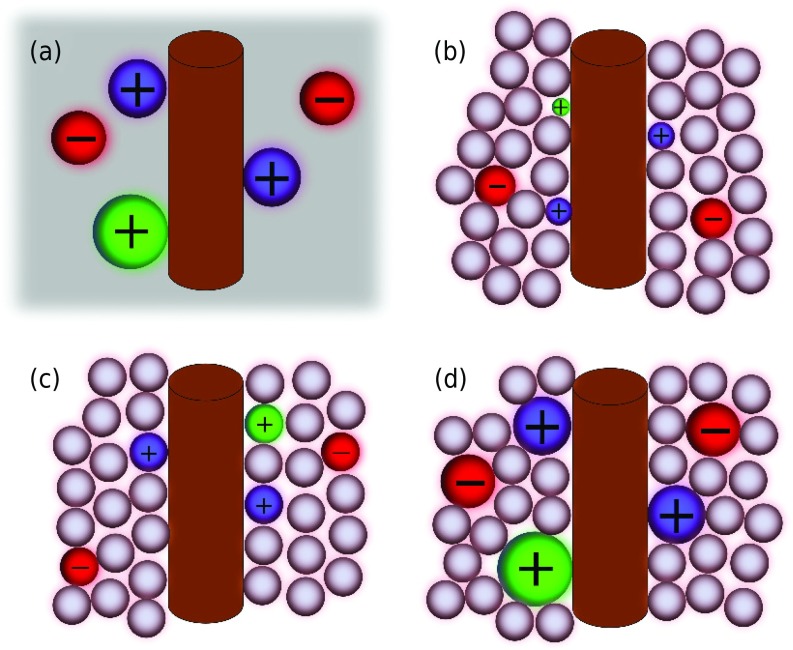
In order to study the ionic and water structure around a B-DNA molecule in ionic solutions, we use four aqueous electrolyte models to represent ions and water molecules as shown in Fig. 2. In the first one, called primitive model (PM), the ionic solution is approximated by a structureless continuum medium characterized by a dielectric constant ε = 78.35, and the ions are represented as hard spheres with point charges located at their centers (see Fig. 2(a)). As shown in Figs. 2(b)–2(d), when the water molecules are represented by neutral hard spheres as well, the resulting model is known as the solvent primitive model (SPM) or “civilized” primitive model.47,48 Even though SPM is not able to consider solvent polarization and other solvent electrostatic correlations, it includes solvent excluded volume effects. It has been shown that SPM provides a more realistic description of aqueous electrolyte properties when compared with PM.49 As shown in Figs. 2(b)–2(d), several approximations can be used to model the size of the ionic species in a SPM electrolyte. The ionic species can be considered unhydrated (Fig. 2(b)), with the same size as the solvent hard spheres (Fig. 2(c)), or hydrated ions (Fig. 2(d)).
FIG. 2.
Schematic representation of the different aqueous electrolyte models employed in this work. (a) Primitive model (continuum solvent) with hydrated ions; (b) solvent primitive model (SPM) with unhydrated ions; (c) SPM with equally sized ions and water hard spheres; and (d) SPM with hydrated ions and water hard spheres. In all the SPM models, the size of the water hard spheres is the same.
The B-DNA molecule is modeled as an infinite hard cylinder of radius R = 8 Å and uniform axial charge density λ = −0.94 nC/m. It has been shown that this approximate cylindrical model is able to provide a good description of salt-dependent properties of B-DNA.47,48 However, due to lack of structural detail this cylindrical B-DNA model cannot account for sequence specific properties.1,16 It is also unable to capture the biomolecule polarization effects.
B. Theory
The presence of the polyelectrolyte in the bulk electrolyte is represented by an external potential ui(r) acting on each ionic species i. This external potential generates inhomogeneous ion density profiles ρi(r) representing the probability of finding ions around the polyelectrolyte. In this work, ρi(r) is calculated from pair correlation functions and functional expansions around the bulk ionic densities using the classical density functional theory.29–31 A detailed description of the theoretical approach is given in the Appendix.
Under this framework, the explicit expression for the ion density profiles ρi(r) depends on the way in which the excess Helmholtz free energy of the system Fex[{ρj}] is decomposed and subsequently approximated. We use the following decomposition of the excess free energy Fex:34
| (2) |
where the first term,
| (3) |
represents the pure Coulomb interactions, and is also present in mean-field theories such as the nonlinear Poisson-Boltzmann equation. The second and third terms, and , represent the contributions corresponding to the pure hard sphere and residual Coulomb interactions, respectively. These terms provide corrections to the nonlinear Poisson-Boltzmann (NLPB) predictions, and capture charge inversion, charge-asymmetry dependent effects, and other important phenomena characterizing highly charged interacting systems.50–52 The excess free energy decomposition in Eq. (2) yields the following fundamental expression for the ion density distributions:
| (4) |
where ψ(r; {ρj}) is the solution of NLPB equation representing the MEP due to the polyelectrolyte plus the ion distribution, , and and are the hard sphere and residual electrostatic one particle direct correlation functions, respectively. They are defined as the first functional derivatives of the excess free energies and , respectively. Note that represents one particle direct correlation function for uniform fluids. Another point to note is that each of the terms in the argument of the exponential in Eq. (4) are actually dependent on each other, because all of them are functionals of the ion density profiles in a self-consistent manner. In particular, this means that ion-ion correlation effects cannot be completely decoupled from excluded volume effects in the current approach.
In our theoretical formulation, the residual electrical one particle direct correlation function is calculated perturbatively around uniform fluids (see Subsection A 3 of the Appendix). To reduce the computational cost, only the first order term in such expansion in powers of is considered here.34 To calculate the first order approximation, we implement the MSA for charged multi-component hard sphere fluids, since it provides a compact analytic expression for an accurate and efficient evaluation of residual two particle direct correlation functions.42,53
To evaluate , we use the expression for the free energy density of homogeneous fluids introduced by Hansen-Goos and Roth44 in the FMTWBII that yields a new generalization of the Carnahan-Starling equation of state for additive mixtures of hard spheres,
| (5) |
where P is the pressure and the scaled-particle variables ξa are defined as follows:
The superiority of the generalization of the Carnahan-Starling equation of state, compared with former equations of state, produces differences mainly at high densities and high ion size asymmetry. This becomes clear when re-writing Eq. (5) in terms of the Percus Yevick (PY),54 the well-known Boublik-Mansoori-Carnahan-Starling-Leland (BMCSL),55 and the so-called extended Carnahan-Starling (eCS) equations of state as follows:
| (6) |
The first term on the right-hand side of Eq. (6) represents the compressibility pressure predicted by PY approximation, which deviates significantly from molecular dynamics results for uniform fluids mainly at moderate to high ion concentrations.44 The second and third terms represent the first and second correction in power of the total packing fraction ξ3 to the PY prediction obtained empirically by BMCSL () and eCS (), respectively. The last term in Eq. (6) represents the Hansen-Goos and Roth residual contribution,
| (7) |
which provides a higher order correction in the prediction of the equation of state. This correction comes from the contribution to the excess free energy density ,44 which produces a correction to the excess free energy (Eq. (A12) in Subsection A 2 of the Appendix) as well as to the direct correlation function (Eq. (A15) in Subsection A 2 of the Appendix). By construction, the residual term in Eq. (7) also restores the thermodynamic consistency (up to third order in the parameter ξ3) missed by empirically based BMCSL and eCS approximations. As a result, Hansen-Goos and Roth's44 approach is appropriate for modeling water excluded volume effects at experimental size and concentration and high size ionic asymmetry. It also plays a relevant role in the description of the physics at solute-liquid interfaces.46
C. Monte Carlo simulation
In order to test the accuracy of our theoretical results for the implicit solvent model, we perform Monte Carlo simulations of the B-DNA model immersed in a 1M 1:1 PM electrolyte solution. In these simulations, ions are represented by hard spheres with point charges placed at their centers that interact as described in Eq. (8).
The B-DNA is modeled as an infinite hard cylinder of radius R and homogeneous surface charge density. The electric field produced by this cylinder is equivalent to that generated by an infinite line of charge of density λ, which is placed in the center of the cylinder along its symmetry axis. In order to compare simulation data and theoretical results, we place 10 equally spaced point-charges along the cylinder's symmetry axis of value qi = e/10 each 1.7 Å. The interaction between an ion i of diameter σi and a point-charge qj is given by
| (8) |
where r′ is the perpendicular distance of an ion i to the line of charge, r is the distance between an ion i (of charge ezi) and a point-charge qj located along the line of charge.
A cubic simulation box of length L with periodic boundary conditions is used to perform NVT Monte Carlo simulations via the Metropolis algorithm.56,57 In order to avoid border effects, the length L is several times the Debye length for each ionic mixture. In typical runs, L is varied from 15 nm to 30 nm, involving 4000-7000 particles. The total number of ions is also adjusted to obtain the desired bulk concentration far away from the cylinder surface, but always fulfilling the electroneutrality condition,
| (9) |
where Ncyl is the number of discrete charges placed on the line of charge, Nc and zc are the number and valence of free counterions of the line of charge, m is the total number of ionic species, and Nk and zk are the number of ions and valence corresponding to the ionic species k, respectively.
Recently, several computational schemes have been proposed to properly handle long-ranged Coulombic interactions.58–62 In this work, we use the classical Ewald sums approach57,58 with a damping constant α = 5/L (where L is the length of the cubic simulation box) and 725 vectors in the k-space to compute the reciprocal space contribution to the total electrostatic energy (details of the implementation are discussed elsewhere63–65).
In all simulations, at least 100 000 Monte Carlo cycles are used for thermalization, and 200 000-1 000 000 Monte Carlo cycles are performed to calculate the canonical average.
Additionally, we test the accuracy of our theoretical results in the solvent primitive model using the Goel et al. Monte Carlo simulation results.66 We analyze the ion and water density distributions for electrolytes containing mixed 1:2:1 (NaCl/MgCl2) having 1M 1:1 (NaCl) and various concentrations of 2:1 (MgCl2) in order to validate the approximations introduced in our proposed computational DFT approach including excluded volume effects of small neutral hard sphere water molecules.
III. DISCUSSION AND RESULTS
A. Validation of the FMTWBII + MSA results against Monte Carlo simulations
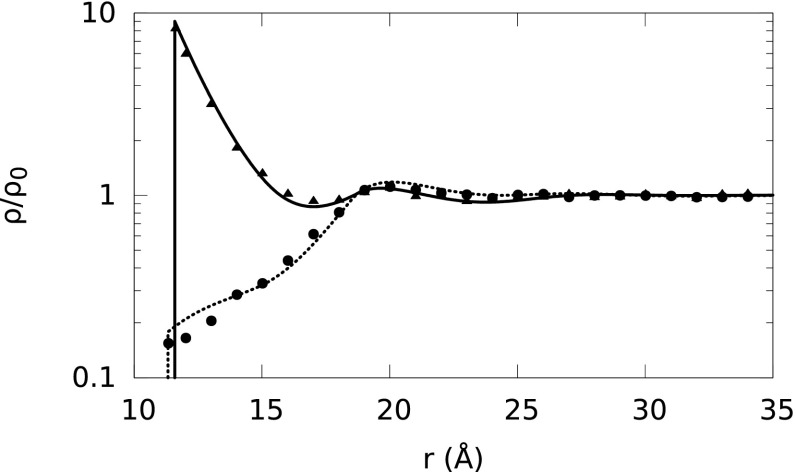
We calculate the normalized ion density profiles around the model B-DNA cylinder immersed in the aqueous electrolytes listed in Table II using both the FMTWBII + MSA and MC simulations. The ions are modeled with hydrated diameters listed in Table I. Fig. 3 shows that the theoretical predictions are in good agreement with the corresponding MC results for the ion profiles in the 1M 1:1 NaCl electrolyte surrounding the B-DNA. In Fig. 3, the first peak of the solid curve reproduces the accumulation of Na+ ions near the surface of the B-DNA, where the electrostatic attraction between Na+ ions and the surface charge of the B-DNA dominates the steric repulsion of accumulated Na+ ions from each other. Additionally, the curve reproduces Cl− depletion by the polyelectrolyte surface due to the electrostatic repulsion of Cl− ions by the surface charge of B-DNA.
FIG. 3.
Normalized ion density profiles (ρ/ρo) around B-DNA (radius of 8 Å and linear charge density −0.94 nC/m, the same B-DNA model is used in all the sections) embedded in a 1M NaCl solution as a function of radial distance (r) from the B-DNA helical axis. The Na+ and Cl− diameters are set to 7.16 Å and 6.64 Å, respectively. Solid and short-dashed lines represent our theoretical predictions for Na+ and Cl− ion density distributions, respectively, and symbols represent the MC simulation results. Triangles represent Na+, and circles correspond to Cl−.
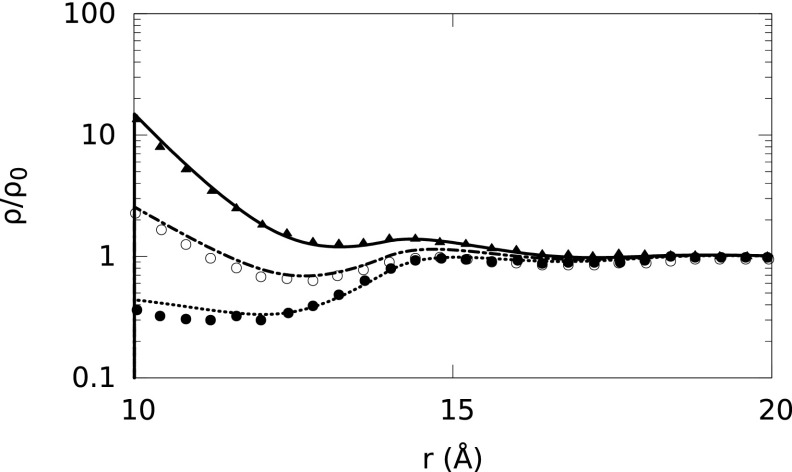
Fig. 4 shows the effects of divalent and trivalent ionic species in the primitive model at several ionic concentrations. At lower ionic concentrations (Figs. 4(a) and 4(b)), the normalized ionic profile near the polyelectrolyte goes to the bulk monotonically. When the concentration of 1:1 electrolyte changes from 0.025M to 0.1M, the ionic strength increases. This in turn reduces the Debye screening length, which depends inversely on the ionic strength and is used as a measure of the thickness of the ionic atmosphere. As a result, the thickness of the ionic atmosphere reduces with increased electrolyte concentration and the ion density distributions reach their bulk values at faster rates as shown in Fig. 4(b). At strong ionic strength regimes (around 1M), layering effects are observed in the ion profiles of the electrolyte mixtures (see Figs. 4(c)–4(f)). Also, the addition of MgCl2 or AlCl3 to the pure 1M NaCl solution causes a displacement of sodium ions by the multivalent ions leading to a larger concentration of Mg+2 or Al+3 than the concentration of Na+ at the surface of B-DNA, and decrease of Na+ concentration at the surface compared to pure 1M NaCl. Similar results have been observed in other works.66,67 The comparison between 1:1 NaCl/2:1 MgCl2 (see Figs. 4(c) and 4(d)) and 1:1 NaCl/3:1 AlCl3 (see Figs. 4(e) and 4(f)) electrolyte mixture of equal concentrations shows that trivalent ion species are more strongly attracted to the polyelectrolyte than divalent ion species. This can be observed in Figs. 4(d) and 4(e) as the height of the first peak of Al+3 is much taller than that of the Mg+2, and consequently, a larger adsorption of counterions effectively screens the original B-DNA surface charge and promotes the adsorption of co-ions. In Figs. 4(c)–4(f), there is a hump in the density profiles of co-ions at around 20 Å. Fig. 4(d) shows a stronger hump with the increase in MgCl2 concentration compared to the hump at a lower concentration shown in Fig. 4(c). In the electrolyte mixture containing AlCl3, the hump in the density profiles becomes even stronger as we increase the electrolyte concentrations (see Figs. 4(e) and 4(f)). The behavior of the hump in the ionic density profiles is attributable to the ion-ion correlations.66 For further validation of our theoretical predictions, we compare the normalized ion density predictions for SPM with the corresponding MC simulation results of Goel et al.66 shown in Figs. 5 and 6. A good agreement is found between the MC simulation data and the DFT predictions.
FIG. 4.
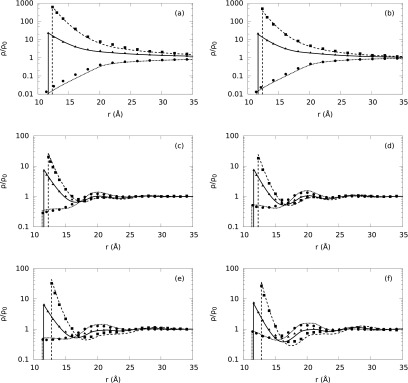
Normalized ion density profiles (ρ/ρo) around B-DNA embedded in three component asymmetric electrolyte solutions. The hydrated ion sizes are given in Table I and the water molecules are not considered explicitly (PM). Plots (a)-(f) correspond to the electrolyte mixture concentrations given in Table II from top to bottom, respectively. Dashed, solid, and short-dashed lines correspond to our theoretical predictions for Mg+2 or Al+3, Na+, and Cl− ion density distributions, respectively, whereas squares, triangles, and circles represent the corresponding MC simulation results, respectively.
FIG. 5.
Normalized ion density profiles (ρ/ρo) around B-DNA embedded in a 1M NaCl solution. The water molecules are explicitly considered (SPM) at 10.3M concentration. The Na+, Cl−, and water molecule radii are set to 4.0 Å. Solid, dotted-dashed, and short-dashed lines represent our theoretical predictions for Na+, solvent, and Cl− ion density distributions, respectively, whereas solid triangles, empty and solid circles represent the corresponding MC simulation results, respectively.66
FIG. 6.

Normalized ion density profiles (ρ/ρo) around B-DNA embedded in three component symmetric electrolyte solutions. All ion sizes are equal to 4.0 Å. The water molecules are explicitly considered (SPM) at 10.3M concentration and size set to 4.0 Å. The plots (a) correspond to 1M NaCl + 0.125M MgCl2 + 10.3M H2O electrolyte mixture, whereas (b) corresponds to 1M NaCl + 0.25M MgCl2 + 10.3M H2O electrolyte mixture. Dashed, solid, dotted-dashed, and short-dashed lines correspond to our theoretical predictions for Mg+2 , Na+, solvent, and Cl− ion density distributions, respectively, whereas solid squares, triangles, empty and solid circles represent the corresponding MC simulation results, respectively.66
B. Structural properties of the ionic atmosphere surrounding a model B-DNA
1. Solvent excluded volume effects on the ion density distributions
To understand the solvent excluded volume effects on the ionic atmosphere surrounding B-DNA, the ion profiles of SPM aqueous electrolyte are compared with those of the corresponding PM electrolyte. We also investigate the influence of water molar concentration and molecule size on the ion density distributions by fixing the partial packing fraction of water molecules around 0.4 and changing the water molar concentration accordingly for each electrolyte listed in Table II. It should be noted that even for PM, the solvent excluded volume effect is partially incorporated because of the use of large hydrated ionic diameters. At low NaCl concentration, the PM shows an exponential and monotonic behavior of the ion density profiles (see red lines in Figs. 7(a) and 7(b)). This behavior is similar to that of PB theory. By contrast, the explicit presence of solvent introduces layering in the ion density distributions (see black lines in Figs. 7(a)–7(f)). For SPM, the increased accumulation of ions at the contact point is clearly attributed to the solvent excluded volume effects, which push the ions toward the biomolecular surface. Additionally, at higher solvent concentrations (Figs. 7(a) and 7(b)), the oscillatory behavior within the ionic atmosphere is more pronounced, causing stronger layering of the ions.
FIG. 7.
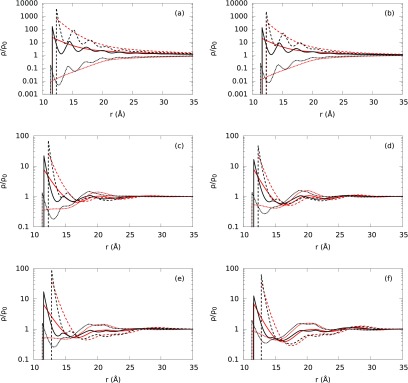
Normalized ion density profiles (ρ/ρo) around B-DNA embedded in different solvent models and electrolyte mixtures. The electrolyte mixture concentrations for (a)-(f) plots are given in Table II from top to bottom, respectively. Dashed, solid, and short-dashed lines correspond to our theoretical predictions for Mg+2 or Al+3, Na+, and Cl− ion density distributions with ion bulk concentrations described in Fig. 4. Red lines correspond to PM (without explicit water molecules) and black lines represent SPM (with explicit water molecules and hydrated ion sizes) ion density distributions at six different water concentrations from Table II.
2. Ionic size asymmetry effects on the ion and water density distributions
To investigate the effect of asymmetrically sized ions on the ion density distribution around B-DNA, we study three electrolyte mixtures: a, d, and f listed in Table II, using the three different ionic size models listed in Table I. These three models cover the cases where the co-ions are smaller, equal, or greater than the counterions. In the first model, where hydrated ion sizes are used, counterions are bigger than co-ions. Using this model for different electrolyte mixtures requires varying water molar concentrations, whose values are listed in Table II. The second model employs symmetric ions with equal counterion and coion sizes. The third model uses Shannon effective ionic radii,68 in which the counterions are smaller than the co-ions. For the second and third models, the molar concentration of water is 55.56M.
The comparison between the symmetric and Shannon size models (see green solid and blue dashed lines in Fig. 8) shows that the ion asymmetry influences the position and the height of the ion density peak around the biopolyelectrolyte surface. In the case of Shannon ion size model, the counterions being smaller in size than the co-ion come closer to the polyelectrolyte surface, whereas in the symmetric ion model, the counterions and co-ion come to the same distance to the B-DNA surface. On the other hand, in the hydrated ion size model (see black short-dashed lines in Fig. 8) the first peak in the density distribution of the counterions and co-ion are located at further distances from the B-DNA surface, compared with those predicted by the Shannon or symmetric ion sizes models, due to the bigger ionic sizes. The local concentrations of the ions are also affected by the ion sizes, since the height of the peaks in the ion density distributions is different for each ion size model (see Fig. 8). Overall, the results presented in Fig. 8 indicate that ion sizes as well as the asymmetry in ion sizes have a strong impact on the ionic atmosphere surround the B-DNA cylinder.
FIG. 8.

Normalized ion density profiles (ρ/ρo) around B-DNA for SPM electrolytes with different ionic diameters. Green solid lines correspond to symmetric ion sizes, blue dashed lines represent Shannon's effective ion sizes, and black short-dashed lines show the hydrated ion sizes as given in Table I. The (a), (b), (c) plots represent Na+, Mg+2, and Cl− for a electrolyte mixture from Table II, the (d), (e), (f) plots represent Na+, Mg+2, and Cl− for d electrolyte mixture, and the (g), (h), (i) plots represent Na+, Al+3, and Cl− for f electrolyte mixture.
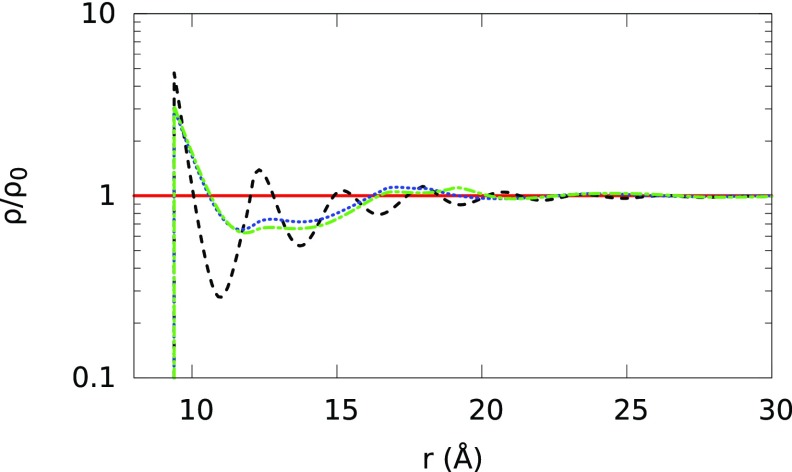
To provide a more complete picture on layering formation and characterization of an electrolyte near its surface, we also study the ionic size asymmetry and solvent excluded volume effects on the hydration shells around B-DNA. In order to study water density distribution for different aqueous electrolyte models, we use the SPM with hydrated ion sizes and the a, d, and f electrolyte mixtures discussed above. We find that oscillatory behavior of the water density distributions depends strongly on the solvent and electrolyte mixture concentrations (see Fig. 9). Specifically, in the cases of a, d, and f, the height of the contact peaks and amplitude of oscillations of the solvent particles are consistent with the solvent volume fraction and the concentration imposed to keep the total volume fraction approximately at the same value. These features cannot be captured by PM since the water density distribution is absent. This behavior for PM is represented by the red line in Fig. 9.
FIG. 9.
Normalized water density profiles (ρ/ρo) around B-DNA. The red line corresponds to the PM, and the black dashed, blue short-dashed, and green dotted-dashed lines correspond to the SPM with hydrated ion sizes for a, d, and f electrolyte mixtures, respectively, introduced in Table II.
3. Ionic size and valence effects on the integrated charge and mean electrostatic potential
We use the ion density profiles to elucidate the dependence of polyelectrolyte electrostatic properties on ionic bulk concentrations and charge valences. We calculate the IC distribution surrounding the polyelectrolyte in order to investigate the charge inversion, which occurs when the sign of polyelectrolyte's net charge changes in aqueous salt mixture due to the accumulation of ions near the surface of a polyelectrolyte. The expression used to calculate the IC is given by
| (10) |
where zi and e represent the charge valence of ith ion and electron charge, respectively. We investigate the effects of ionic size, electrolyte concentration, and ionic charge valence on the sign of the net charge of B-DNA cylinder (see Fig. 10) using the same three electrolyte mixtures a, d, and f from Table II discussed in Sec. III B 2. We observe that SPM with symmetric ion sizes predicts charge inversion for trivalent ionic mixture but fails to predict it for divalent ionic mixture at the same concentration (see Figs. 10(b) and 10(c)). This clearly demonstrates the contribution of ionic charge valence in predicting the charge inversion.
FIG. 10.

Integrated charge profiles corresponding to the SPM for (a) a, (b) d, and (c) f aqueous electrolyte mixtures. Red solid and green dashed lines represent our theoretical SPM predictions with symmetric and Shannon's ion sizes with corresponding water concentrations from Table II.
We also calculate the MEP using Eq. (A11). The MEP is closely related to the zeta potential, which provides key information about the stability (aggregation/dispersion) of the polyelectrolyte suspension. We compare calculated MEP and IC predictions (PM using hydrated ion sizes) with MC simulations and NLPB predictions (see Fig. 11) in order to capture ionic size effects on the sign of the net charge of the B-DNA. Figs. 11(a) and 11(d) show that PM results for MgCl mixture at low concentration are in good agreement with MC simulations. Additionally, Figs. 11(b) and 11(e) show that MgCl2 results are in better agreement with MC simulations compared to AlCl3 results (see Figs. 11(c) and 11(f)). We only observe charge inversion in MEP and IC for divalent and trivalent mixtures at high concentrations. However, the NLPB does not predict the charge inversion for all studied concentrations. These observations expose the role of electrolyte concentration, ionic size, and valence effects in the charge inversion phenomenon. In particular, for large ion sizes and multivalent ions, the MEP and IC predictions reveal charge inversion at higher electrolyte concentrations.33
FIG. 11.
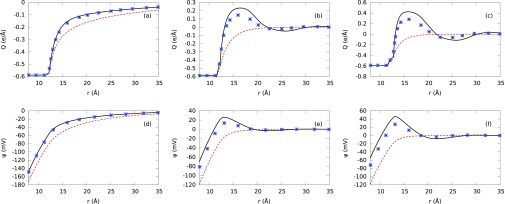
Plots (a), (b), and (c) correspond to integrated charge, whereas (d), (e), and (f) represent mean electrostatic potential. We use a, d, and f aqueous electrolyte mixtures in plots (a), (b), (c) and (d), (e), (f), respectively. Red short-dashed lines represent our NLPB predictions. Black solid lines represent our PM predictions with hydrated ionic sizes. Symbols correspond to the MC simulation results.
4. Number of excess ions around B-DNA: A comparison between theory and experiment
The validation of our DFT formalism against Monte Carlo simulations demonstrates that the approximations introduced in our computational model are adequate for the description of the ionic atmosphere surrounding cylindrical and highly charged polyelectrolytes, such as the ideal B-DNA model used here. The next step entails the comparison of the theoretical predictions against experimental data. This strategy is useful for verifying which physical approximations and model parameters better describe the experimental observations.7
In an effort to assess the aqueous electrolyte models used in this work, we compare the number of excess monovalent and multivalent ions (Na+, Mg+2, and Cl−) around B-DNA against experimental data. In particular, the number of excess ions of type i, Ni, can be calculated as follows:
| (11) |
where [ρi(r) − ρi(rmax)] represents the excess ion concentration, r is the separation distance from the center of B-DNA, rmax is the maximum radial length (cutoff) at which ρi(rmax) is essentially indistinguishable from the bulk concentration, and h is the length of B-DNA.
Using Eq. (11) we compare the experimental data with the theoretical results obtained with both PM (Fig. 12(a)) and SPM (Figs. 12(b)–12(d)) for a 24 base pair B-DNA (e.g., h = 81.6 Å) immersed in three component electrolyte mixtures consisting of Na+, Mg+2, and Cl− at different electrolyte mixture concentrations.
FIG. 12.
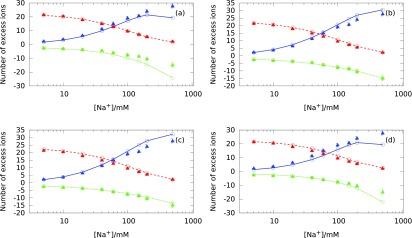
Number of excess ions around a B-DNA duplex as a function of the Na+ concentration. Different concentrations of NaCl are added into a background solution of 5mM Mg+2. Circles represent our theoretical predictions and triangular symbols represent experimental ion counting data.7 Red dashed lines correspond to Mg+2, blue solid lines correspond to Na+, and green short-dashed lines correspond to Cl−. The plots represent the comparison between our theoretical predictions against experimental data for (a) PM with hydrated ion sizes, (b) SPM with Shannon's ion sizes and (c) same ion sizes, and (d) SPM with hydrated ion sizes.
At low Na+ concentration, all aqueous electrolyte models reproduce experimental results, which indicates that the ion size asymmetry and excluded volume effects are not significant in this regime. Figs. 12(b) and 12(c) show that at high Na+ concentrations, the SPM with Shannon's and symmetric ion sizes overestimate the experimental data for Na+ ions by 3-4 excess ion counts. In contrast, the PM and the SPM with hydrated ion sizes (Figs. 12(a) and 12(d)) underestimate the number of excess Na+ and Cl− ions by 6-7 counts. Overall, our results show small changes in the number of excess ions predicted by different ion size models in comparison to the experimental data. However, it is possible that other physical modeling parameters such as detailed surface charge distribution on the B-DNA and dielectric discontinuity at the boundary between the B-DNA and aqueous electrolyte can change the number of excess ions by amounts similar to changes in ion size.69
5. Electrostatic versus steric contributions on the ion density profiles
In Secs. III B 1–III B 4, we focus the analysis on the comparison between the ion density distributions, electrostatic properties, and experimental excess number of ion results predicted by different aqueous electrolyte models and electrolyte mixtures without identifying the driving force governing their behaviors. In this section, we study the ionic potential of mean force (PMF) per unit of thermal energy , which appears in the expression for the ion density distributions (4), and whose negative gradient gives the corresponding average force acting on the ion species i due to the other ions and B-DNA. We compare the normalized MEP energy (−βqiψ(r; {ρj})) with hard sphere () and electrostatic residual () correlations. We analyze electrolytes at low and high NaCl concentrations using PM with hydrated ion sizes (see Fig. 13) and SPM with Shannon's ion sizes and experimental water concentration (see Fig. 14). We have chosen to study these two models because they have shown the major differences in the predictions of the number of excess ions around the B-DNA model at high electrolyte concentration. The results shown in Figs. 13 and 14 provide insight into the effects of the water crowding, hard sphere, and electrostatic residual correlation contributions on the PMF. Figs. 13(a), 13(b), 13(d), and 13(e) show a strong competition between hydrated hard sphere (green short-dashed lines) and electrostatic residual (blue dashed lines) correlation contributions for counterions using PM due to the opposite sign of each contribution. Figs. 13(c) and 13(f) show that both contributions have the same sign for co-ions. Additionally, ion hard sphere, electrostatic residual correlation contributions, and electrostatic potential energy contribution (red dotted-dashed lines) enhance the PMF (black solid lines). In Fig. 13(e), the electrostatic residual correlation provides the main contribution to the ionic PMF for divalent counterions at high electrolyte mixture concentration. In all the cases presented in Fig. 13, the magnitude of the electrostatic residual correlation is larger than the magnitude of the hard sphere contribution to the ionic potential of mean force.
FIG. 13.
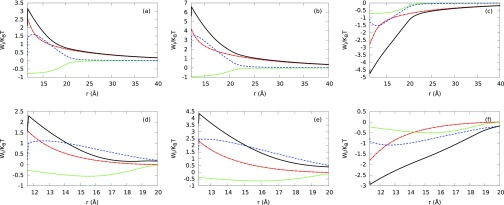
Hard sphere contribution (green short-dashed), electrostatic correlation contribution (blue dashed), normalized electrostatic potential energy contribution (−βqiψ(r; {ρj})) (red dotted-dashed), and the PMF (sum of these three contributions (black solid) (ρ/ρo) around B-DNA for the PM. (a), (b), (c) plots correspond to Na+, Mg+2, and Cl− ions in 0.005M NaCl + 0.005M MgCl2 electrolyte mixture, respectively. (d), (e), (f) plots correspond to Na+, Mg+2, and Cl− ions in 0.5M NaCl + 0.005M MgCl2 electrolyte mixture, respectively.
FIG. 14.
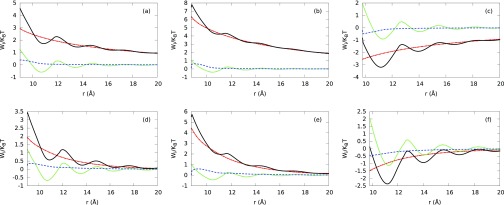
Hard sphere contribution (green short-dashed), electrostatic correlation contribution (blue dashed), normalized electrostatic potential energy contribution (−βqiψ(r; {ρj})) (red dotted-dashed), and the PMF (sum of these three contributions ) (black solid) for the SPM at 55.56M solvent concentration. Plots (a)-(f) represent the same electrolyte mixtures described in Fig. 13.
A different scenario is observed for explicit water molecules at experimental concentration values and Shannon's ion sizes. In Fig. 14, layering formation is observed in the PMF arising from the water crowding effect. Additionally, in all these cases the hard sphere correlation contribution is larger than the electrostatic residual correlation contribution at the contact point. Very near the B-DNA surface, Figs. 14(a), 14(b), 14(d), and 14(e) show the (ionic plus water) hard sphere and electrostatic residual correlation effects contribute with the same sign for counterions, whereas Figs. 14(c) and 14(f) show a significant competition between both contributions due to the opposite sign of each contribution for the co-ion.
In summary, we find that the contributions coming from beyond mean-field approximations play a dominant role in the behavior of the corresponding ion density profiles, depending on the aqueous electrolyte model used to describe the ionic atmosphere around the B-DNA.
IV. CONCLUSION
In this work, we have introduced a classical density functional theory that is able to describe the influence of surrounding ions and water molecules on the structural and thermodynamic properties of polyelectrolytes in solution at infinite dilution. This approach goes beyond the nonlinear classical Poisson-Boltzmann theory by accounting for electrostatic ion correlations, size asymmetry, and excluded volume effects of ions and solvent particles. We have implemented a combination of the MSA and FMTWBII theories to study the influence of electrolyte mixtures of monovalent and multivalent ions and explicit water molecules at different densities and particle's sizes. The water crowding effects are taken into account by considering a neutral ion species of hard spheres representing explicit water molecules. The theoretical ionic density profiles display a good agreement with Monte Carlo simulations in the primitive model. The IC and MEP predicted by our DFT theory shows charge inversion at high electrolyte mixture concentrations.
Several models have been used to study the distribution of electrolyte mixtures surrounding a cylindrical rigid polyelectrolyte mimicking a B-DNA molecule at various ionic conditions. At microscopic level, we observe significant discrepancies in the ionic density profiles predicted by the different aqueous electrolyte models used in this work. However, the corresponding excess number of ions adsorbed to DNA are very similar in a wide range of electrolyte concentrations. Therefore, experimental data on the number of excess ions should not be considered alone, in general, as a conclusive test to determine the accuracy of DNA-electrolyte molecular models.10,70
On the other hand, the ionic potential of mean force has been analyzed and decomposed theoretically using our DFT approach in different contributions that depend on both electrostatic ion correlations and ionic excluded volume effects. At high electrolyte concentrations, the largest contribution to the ionic potential of mean force can be attributed to the electrostatic residual component in the presence of hydrated divalent counterions for the primitive model. At analogous conditions for the SPM model with Shannon's ionic sizes, it has been shown that the oscillatory behavior of the ionic potential of mean force associated to co-ions is promoted mainly by the hard sphere contribution.
Overall, the proposed theoretical DFT approach can be useful for studying ion and solvent dependent structural and thermodynamic properties of highly charged polyelectrolytes at low computation cost in comparison with explicit solvent simulations.
A better understanding of the ionic atmosphere around polymers, nanoparticles, and biological molecules requires the consideration of inhomogeneous charge distributions, irregular shapes, solvent polarization effects, and hydrogen bonding. Work along these directions is currently in progress.
ACKNOWLEDGMENTS
We thank the National Science Foundation (NSF)-PREM Grant No. DMR-0934218, G.I.G.G. and M.O.C. thank the support of the NSF MRSEC Award No DMR-1121262. The computer cluster where the simulations were performed was funded by the office of the Director of Defense Research and Engineering (DDR&E) and the (U.S.) Air Force Office of Scientific Research (USAFOSR) under Award No. FA9550-10-1-0167. One of us (M.O.F.) would like to acknowledge support from National Institutes of Health (NIH)-NIGMS Grant No. 5R44GM073391 and thank Mr. Travis Mackoy for his help in preparing Fig. 1 and Dr. Robert C. Harris for providing some comments about the paper.
APPENDIX: THEORETICAL APPROACH
1. Density functional theory for inhomogeneous fluid mixtures
The density functional theory for inhomogeneous fluid mixtures is based on the definition of the exact Grand Potential functional of the ion density profiles Ω[{ρj}] from which the structural and thermodynamic properties of the system can be obtained.34 Specifically, the Legendre transform of the Helmholtz Free energy of the system F[{ρj}] defines the Grand Potential functional as follows:71
| (A1) |
where μi represents the chemical potential of the ith ionic component. The Helmholtz free energy functional is generally expressed as the sum of the ideal gas Fid and the excess Fex free energies
| (A2) |
The ideal gas free energy is known exactly but approximations must be developed for the excess free energy. At equilibrium the Grand Potential functional is minimal with respect to variations in the density profiles yielding the following formal exact expression for the singlet ion density profiles {ρj(r)}:
| (A3) |
where β is the inverse of the thermal energy and the one particle direct correlation function for inhomogeneous fluids is defined as
| (A4) |
and . Note that ψSolute(r) represents the MEP generated by the polyelectrolyte surface charge. As a result, qiψSolute(r), where r = ‖r‖ determines the electric potential energy required by the fixed polyelectrolyte surface charge to bring an ion of species i from infinity to a distance r from the center of the polyelectrolyte
| (A5) |
On the other hand, represents the excluded volume potential energy generated by the cylindrical polyelectrolyte on an ion of species i located at a distance r from the center of the polyelectrolyte
| (A6) |
By replacing the latter expression into Eq. (A3) we obtain the following new expression for the ion (Boltzmann) distributions:
| (A7) |
Using the decomposition for the excess Helmholtz Free energy of the system Fex[{ρj}] given by the expression (2) and setting , the first functional derivative of the excess free energy yields
where ψion(r; {ρj}) represents the MEP due to the ionic distributions. By replacing the latter expression into Eq. (A7) we recover the conventional Boltzmann distribution approximation for the ionic species i
| (A8) |
where ψ(r; {ρj}) ≡ ψSolute(r; {ρj}) + ψion(r; {ρj}) represents the MEP due to the polyelectrolyte surface charge plus the ion distribution. The fundamental expressions for the ion distributions given in Eq. (4) are obtained by substituting Eq. (2) into Eq. (A4) and then substituting the resulting expression into Eq. (A7).
Under this framework, most of the relevant thermodynamic properties of ionic atmosphere (electrical double layers) can be obtained from the expressions for the ion distributions given in Eq. (4). For instance, the coordination number ni(r) gives the average ion number of species i that will be found in an imaginary cylinder of radius r centered on the polyelectrolyte axis. It is calculated in terms of the ion density profiles by the following expression:
| (A9) |
Equation (10) and Gauss's law can be used to calculate the MEP ψ(r; {ρj}) due to the polyelectrolyte surface and the ion distributions in a solvent with isotropic and constant relative permittivity ε. Alternatively, it can be obtained by solving the Poisson equation,
| (A10) |
and using the boundary conditions ψ(r; {ρj})|r → ∞ → 0, ε∂ψ(r; {ρj})/∂r|r = R = −σ = −λ/(2πR), and the electroneutrality condition
In particular, the formal solution of Eq. (A10) in cylindrical coordinates reads
| (A11) |
When the latter equation is substituted into Eq. (4) it yields an implicit equation for the ion profiles {ρi(r)}. The expression corresponding to the hard sphere one particle direct correlation functions for inhomogeneous fluids is provided in Subsection A 2 of the Appendix. It plays a key role in the formulation of the approach introduced in this work.
2. The White Bear version II of FMT approach to calculate hard sphere direct correlation functions
The key assumption of FMT is that the hard sphere excess free energy functional for inhomogeneous has the form
| (A12) |
where the hard sphere free energy density (per thermal energy unit) is a function of a set of scalar and vector weighted densities, each one defined in the form of Eq. (A12), i.e.,
and
Under this framework, the weighted density functions are chosen to be equal to those characteristic functions present in the solution for the two particle direct correlation functions in the MSA, e.g.,
The hard sphere correlation function is obtained when the expressions for the weighted densities are substituted into the expression for the excess free energy density for inhomogeneous fluids. The expression (5) is obtained from a third order expansion in the dimensionless scaled parameter ξ3 of the following free energy density for homogeneous fluids:
| (A13) |
where
and
and c1 = 1/(18π), b2 = 1/3, c2 = 1/(36π), a3 = c3 = 0, and b3 = −1/3. The first term in Eq. (A13) corresponds to the free energy density obtained with the scaled particle theory72,73 and the other terms introduce corrections in such a way that the corresponding equation of state (5) recovers the quasi-exact Carnahan-Starling result in the case of a one component fluid.45 Using the standard homogeneous-to-inhomogeneous generalization method, the expression for the approximate excess free energy for inhomogeneous fluids reads
| (A14) |
Having the expression for the , the hard sphere one particle direct correlation function for inhomogeneous fluids is obtained by differentiation of the free energy as follows:
| (A15) |
The corresponding expression for the homogeneous fluids can be subsequently obtained from Eq. (A14) by replacing and by setting .
3. Residual (electrostatic) correlation functions
Another important contribution to the ion density profiles appearing in the argument of the exponential in Eq. (4) is given by the remaining (residual) one particle correlation function for inhomogeneous fluids. It is usually approximated by using functional Taylor expansion at first order in power of the ion density profiles around uniform fluids as follows:74
| (A16) |
where the following relationship is used:
| (A17) |
The latter equation implies that where the expression for is given by Eq. (A15). An advantageous approximate explicit expression for the two particle correlation functions for multicomponent homogeneous fluids is provided by Hiroike.42
The two particle correlation function for homogeneous fluids predicted by the conventional MSA reduces to the PY correlation function when the ions are not charged, such that .75 Here, it is assumed that the following difference for short-range two particle correlation functions between the MSA and Hansen-Goos and Roth FMT approximations:
is negligible compared with the corresponding contribution coming from the electrostatic ion-ion correlations. Under this assumption, the residual one particle direct correlation function for inhomogeneous fluids is approximated as follows:
| (A18) |
4. MSA approach to calculate electrical direct correlation functions
We use the analytic expressions for c(2)res obtained by Hiroike using the MSA,42 when σi < σj and 0 ≦ r ≦ (σj − σi)/2
| (A19) |
When (σi − σj)/2≦r < (σi + σj)/2,
| (A20) |
where Xi is defined as
| (A21) |
and
| (A22) |
The parameter Γ in Ref. 42 is obtained numerically by solving the set of nonlinear equations given by
| (A23) |
and Eq. (A21).
5. Algorithm
The theoretical model described above yields a set of implicit nonlinear equations that are used to calculate the ion density profiles. The corresponding numerical solution of the coupled Eqs. (4), (A10), (A12), (A14), (A15), and (A18) are obtained using iterative techniques based on the Picard algorithm. The numerical solution for the ion density profiles is obtained with an accuracy of 6 digits of precision, and satisfies the electroneutrality condition.
The nonlinear equations of MSA are solved by tensor methods using Algorithm 768 of ACM: TENSOLVE software package, which is suitable for small-medium problems with up to 100 unknowns.76 The three-dimensional integrals involved in the computation of correlation functionals are reduced to one-dimensional integrals along the radial direction due to the cylindrical symmetry of the polyelectrolyte. These one-dimensional integrals are evaluated using the trapezoidal algorithm with a linear mesh resolution of the order 0.05-0.1 Å. The cutoff (rmax) for the grid used in the theoretical calculations is varied between 60 Å and 100 Å depending on the ionic solution conditions.
REFERENCES
- 1.Ballin J. D., Wilson D. M., and Tadashi E. M., Role and Applications of Electrostatic Effects on Nucleic Acid Conformational Transitions and Binding Processes: In Application of Thermodynamics to Biological and Materials Science (InTech, Rijeka, 2011). [Google Scholar]
- 2.Wong G. C. L. and Pollack L., Annu. Rev. Phys. Chem. 61, 171 (2010). 10.1146/annurev.physchem.58.032806.104436 [DOI] [PubMed] [Google Scholar]
- 3.Record M. T., Lohman T. M., and de Haseth P. L., J. Mol. Biol. 107, 145 (1976). 10.1016/S0022-2836(76)80023-X [DOI] [PubMed] [Google Scholar]
- 4.Manning G. S., Q. Rev. Biophys. 11, 179 (1978). 10.1017/S0033583500002031 [DOI] [PubMed] [Google Scholar]
- 5.Pollack L., Annu. Rev. Biophys. 40, 225 (2011). 10.1146/annurev-biophys-042910-155349 [DOI] [PubMed] [Google Scholar]
- 6.Pabit S. A., Meisburger S. P., Li L., Blose J. M., Jones C. D., and Pollack L., J. Am. Chem. Soc. 132, 16334 (2010). 10.1021/ja107259y [DOI] [PMC free article] [PubMed] [Google Scholar]
- 7.Bai Y., Greenfeld M., Travers K. J., Chu S. D. V. B., Lipfert J., and Herschlag D., J. Am. Chem. Soc. 129, 14981 (2007). 10.1021/ja075020g [DOI] [PMC free article] [PubMed] [Google Scholar]
- 8.Chen A. A., Marucho M., Baker N. A., and Pappu R. V., Methods Enzymol. 469, 411 (2009). 10.1016/S0076-6879(09)69020-0 [DOI] [PubMed] [Google Scholar]
- 9.Kirmizialtin S. and Elber R., J. Phys. Chem. B 114, 8207 (2010). 10.1021/jp911992t [DOI] [PMC free article] [PubMed] [Google Scholar]
- 10.Yoo J. and Aksimentiev A., J. Phys. Chem. B 116, 12946 (2012). 10.1021/jp306598y [DOI] [PubMed] [Google Scholar]
- 11.Young M. A., Jayaram B., and Beveridge D. L., J. Am. Chem. Soc. 119, 59 (1997). 10.1021/ja960459m [DOI] [Google Scholar]
- 12.Fenley M. O., Russo C., and Manning G. S., J. Phys. Chem. B 115, 9864 (2011). 10.1021/jp204915y [DOI] [PMC free article] [PubMed] [Google Scholar]
- 13.Privalov P. L., Dragan A. I., and Crane-Robinson C., Nucl. Acids Res. 39, 2483 (2011). 10.1093/nar/gkq984 [DOI] [PMC free article] [PubMed] [Google Scholar]
- 14.García-García C. and Draper D. E., J. Mol. Biol. 331, 75 (2003). 10.1016/S0022-2836(03)00615-6 [DOI] [PubMed] [Google Scholar]
- 15.Sharp K. A., Friedman R. A., Misra V., Hecht J., and Honig B., Biopolymers 36, 245 (1995). 10.1002/bip.360360211 [DOI] [PubMed] [Google Scholar]
- 16.Fenley M. O., Harris R. C., Jayaram B., and Boschitsch A. H., Biophys. J. 99, 879 (2010). 10.1016/j.bpj.2010.04.066 [DOI] [PMC free article] [PubMed] [Google Scholar]
- 17.Gonzáles-Tovar E., Lozada-Cassou M., and Henderson D., J. Chem. Phys. 83, 361 (1985). 10.1063/1.449779 [DOI] [Google Scholar]
- 18.Bagatella-Flores N. and González-Mozuelos P., J. Chem. Phys. 117, 6133 (2002). 10.1063/1.1503333 [DOI] [Google Scholar]
- 19.Guerrero-García G. I., González-Mozuelos P., and de la Cruz M. O., J. Chem. Phys. 135, 164705 (2011). 10.1063/1.3656763 [DOI] [PubMed] [Google Scholar]
- 20.Martín-Molina A., Ibarra-Armenta J. G., González-Tovar E., Hidalgo-Álvarez R., and Quesada-Párez M., Soft Matter 7, 1441 (2011). 10.1039/c0sm00609b [DOI] [Google Scholar]
- 21.Frydel D. and Levin Y., J. Chem. Phys. 137, 164703 (2012). 10.1063/1.4761938 [DOI] [PubMed] [Google Scholar]
- 22.Nedyalkova M., Madurga S., Pisov S., Pastor E. V. I., and Mas F., J. Chem. Phys. 137, 174701 (2012). 10.1063/1.4762830 [DOI] [PubMed] [Google Scholar]
- 23.Bandopadhyay A. and Chakraborty S., Electrophoresis 34, 2193 (2013). 10.1002/elps.201300094 [DOI] [PubMed] [Google Scholar]
- 24.Moncho-Jordá A., Anta J. A., and Callejas-Fernández J., J. Chem. Phys. 138, 134902 (2013). 10.1063/1.4798708 [DOI] [PubMed] [Google Scholar]
- 25.Wang F.-H., Wu Y.-Y., and Tan Z.-J., Biopolymers 99, 370 (2013). 10.1002/bip.22189 [DOI] [PubMed] [Google Scholar]
- 26.Guerrero-García G. I. and de la Cruz M. O., J. Chem. Theory Comput. 9, 1 (2013). 10.1021/ct300673m [DOI] [PubMed] [Google Scholar]
- 27.Guerrero-García G. I., Ying Y., and de la Cruz M. O., Soft Matter 9, 6046 (2013). 10.1039/c3sm50753j [DOI] [Google Scholar]
- 28.González-Mozuelos P., Guerrero-García G. I., and de la Cruz M. O., J. Chem. Phys. 139, 064709 (2013). 10.1063/1.4817776 [DOI] [PubMed] [Google Scholar]
- 29.Ramirez R. and Borgis D., J. Phys. Chem. B 109, 6754 (2005). 10.1021/jp045453v [DOI] [PubMed] [Google Scholar]
- 30.Medasani B., Ovanesyan Z., Thomas D. G., Sushko M. L., and Marucho M., J. Chem. Phys. 140, 204510 (2014). 10.1063/1.4876002 [DOI] [PMC free article] [PubMed] [Google Scholar]
- 31.Knepley M. G., Karpeev D. A., Davidovits S., Eisenberg R. S., and Gillespie D., J. Chem. Phys. 132, 124101 (2010). 10.1063/1.3357981 [DOI] [PMC free article] [PubMed] [Google Scholar]
- 32.Howard J. J., Lynch G. C., and Pettitt B. M., J. Phys. Chem. B 115, 547 (2011). 10.1021/jp107383s [DOI] [PMC free article] [PubMed] [Google Scholar]
- 33.Patra C. N. and Yethiraj A., J. Phys. Chem. B 103, 6080 (1999). 10.1021/jp991062i [DOI] [Google Scholar]
- 34.Hansen J.-P. and McDonald I. R., Theory of Simple Liquids, 3rd ed. (Academic Press, 2006). [Google Scholar]
- 35.Andersen H. C. and Chandler D., J. Chem. Phys. 53, 547 (1970). 10.1063/1.1674024 [DOI] [Google Scholar]
- 36.Rowlinson J. S., Rep. Prog. Phys. 28, 169 (1965). 10.1088/0034-4885/28/1/306 [DOI] [Google Scholar]
- 37.Hoye J. S., Stell G., and Waisman E., Mol. Phys. 52, 1071 (1976). 10.1080/00268978400101791 [DOI] [Google Scholar]
- 38.Hoye J. S. and Stell G., J. Chem. Phys. 67, 524 (1977). 10.1063/1.434908 [DOI] [Google Scholar]
- 39.Deserno M., Jiménez-Ángeles F., Holm C., and Lozada-Cassou M., J. Phys. Chem. B 105, 10983 (2001). 10.1021/jp010861+ [DOI] [Google Scholar]
- 40.Quesada-Pérez M., González-Tovar E., Martín-Molina A., Lozada-Cassou M., and Álvarez R. H., ChemPhysChem 4, 234 (2003). 10.1002/cphc.200390040 [DOI] [PubMed] [Google Scholar]
- 41.Kovalenko A. and Hirata F., J. Chem. Phys. 110, 10095 (1999). 10.1063/1.478883 [DOI] [Google Scholar]
- 42.Hiroike K., Mol. Phys. 30, 1195 (1977). 10.1080/00268977700101011 [DOI] [Google Scholar]
- 43.Blum L., Mol. Phys. 30, 1529 (1975). 10.1080/00268977500103051 [DOI] [Google Scholar]
- 44.Hansen-Goos H. and Roth R., J. Chem. Phys. 124, 154506 (2006). 10.1063/1.2187491 [DOI] [PubMed] [Google Scholar]
- 45.Carnahan N. F. and Starling K. E., J. Chem. Phys. 51, 635 (1969). 10.1063/1.1672048 [DOI] [Google Scholar]
- 46.Hughes J., Krebs E. J., and Roundy D., J. Chem. Phys. 138, 024509 (2013). 10.1063/1.4774155 [DOI] [PubMed] [Google Scholar]
- 47.Carnie S. L. and Chan D. Y. C., J. Chem. Phys. 73, 2949 (1980). 10.1063/1.440468 [DOI] [Google Scholar]
- 48.Goel T., Patra C. N., Gosh S. K., and Mukherjee T., J. Chem. Phys. 129, 154707 (2008). 10.1063/1.2981057 [DOI] [PubMed] [Google Scholar]
- 49.Goel T., Patra C. N., Gosh S. K., and Mukherjee T., J. Phys. Chem. B 115, 10903 (2011). 10.1021/jp203779t [DOI] [PubMed] [Google Scholar]
- 50.Patra C. N. and Yethiraj A., Biophys J. 78, 699 (2000). 10.1016/S0006-3495(00)76628-8 [DOI] [PMC free article] [PubMed] [Google Scholar]
- 51.Wang K., Yu Y.-X., and Gao G.-H., Phys. Rev. E 70, 011912 (2004). 10.1103/PhysRevE.70.011912 [DOI] [Google Scholar]
- 52.Wang K., Yu Y.-X., Gao G.-H., and Luo G.-S., J. Chem. Phys. 123, 234904 (2005). 10.1063/1.2137710 [DOI] [PubMed] [Google Scholar]
- 53.Stell G. and Sun S. F., J. Chem. Phys. 63, 5333 (1975). 10.1063/1.431338 [DOI] [Google Scholar]
- 54.Percus J. K. and Yevick G. J., Phys. Rev. 110, 1 (1958). 10.1103/PhysRev.110.1 [DOI] [Google Scholar]
- 55.Boublík T., J. Chem. Phys. 53, 471 (1970). 10.1063/1.1673824 [DOI] [Google Scholar]
- 56.Allen M. P. and Tildesley D. J., Computer Simulation of Liquids (Oxford University Press, New York, USA, 1989). [Google Scholar]
- 57.Frenkel D. and Smit B., Understanding Molecular Simulation (Academic, London, 2002). [Google Scholar]
- 58.Fukuda I., Yonezawa Y., and Nakamura H., J. Chem. Phys. 134, 164107 (2011). 10.1063/1.3582791 [DOI] [PubMed] [Google Scholar]
- 59.Vernizzi G., Guerrero-García G. I., and de la Cruz M. O., Phys. Rev. E 84, 016707 (2011). 10.1103/PhysRevE.84.016707 [DOI] [PubMed] [Google Scholar]
- 60.Fukuda I. and Nakamura H., Biophys. Rev. 4, 161 (2012). 10.1007/s12551-012-0089-4 [DOI] [PMC free article] [PubMed] [Google Scholar]
- 61.Viveros-Mendez P. X. and Gil-Villegas A., J. Chem. Phys. 136, 154507 (2012). 10.1063/1.4704743 [DOI] [PubMed] [Google Scholar]
- 62.Kamiya N., Fukuda I., and Nakamura H., Chem. Phys. Lett. 568, 26 (2013). 10.1016/j.cplett.2013.03.014 [DOI] [Google Scholar]
- 63.Guerrero-García G. I., González-Tovar E., and Chavez-Páez M., Phys. Rev. E 80, 021503 (2009). 10.1103/PhysRevE.80.021503 [DOI] [PubMed] [Google Scholar]
- 64.Guerrero-García G. I., González-Tovar E., and de la Cruz M. O., Soft Matter 6, 2056 (2010). 10.1039/b924438g [DOI] [Google Scholar]
- 65.Guerrero-García G. I., González-Tovar E., and de la Cruz M. O., J. Chem. Phys. 135, 054701 (2011). 10.1063/1.3622046 [DOI] [PubMed] [Google Scholar]
- 66.Goel T., Patra C. N., Gosh S. K., and Mukherjee T., J. Chem. Phys. 132, 194706 (2010). 10.1063/1.3428702 [DOI] [PubMed] [Google Scholar]
- 67.Messina R., Holm C., and Kremer K., Eur. Phys. J. E. 4, 363 (2001). 10.1007/s101890170119 [DOI] [Google Scholar]
- 68.Shannon R. D., Acta Crystallogr. 32, 751 (1976). 10.1107/S0567739476001551 [DOI] [Google Scholar]
- 69.Harris R. C., Boschitsch A. H., and Fenley M. O., J. Chem. Phys. 140, 075102 (2014). 10.1063/1.4864460 [DOI] [PMC free article] [PubMed] [Google Scholar]
- 70.Giambaşu G. M., Luchko T., Herschlag D., York D. M., and Case D. A., Biophys. J. 106, 883 (2014). 10.1016/j.bpj.2014.01.021 [DOI] [PMC free article] [PubMed] [Google Scholar]
- 71.Evans R., Adv. Phys. 28, 143 (1979). 10.1080/00018737900101365 [DOI] [Google Scholar]
- 72.Reiss H., Frish H. L., and Lebowitz J. L., J. Chem. Phys. 31, 369 (1959). 10.1063/1.1730361 [DOI] [Google Scholar]
- 73.Barker J. A. and Henderson D., Rev. Mod. Phys. 48, 587 (1976). 10.1103/RevModPhys.48.587 [DOI] [Google Scholar]
- 74.Yu Y.-X., Wu J., and Gao G.-H., J. Chem. Phys. 120, 7223 (2004). 10.1063/1.1676121 [DOI] [PubMed] [Google Scholar]
- 75.Waisman E. and Lebowitz J. L., J. Chem. Phys. 56, 3086 (1972). 10.1063/1.1677644 [DOI] [Google Scholar]
- 76.Bouaricha A. and Schnable R. B., ACM Trans. Math. Softw. 23, 174 (1997). 10.1145/264029.264032 [DOI] [Google Scholar]
- 77.Volkov A. G., Paula S., and Deamer D. W., Bioelectrochem. Bioenerg. 42, 153 (1997). 10.1016/S0302-4598(96)05097-0 [DOI] [Google Scholar]
- 78.Zhang Y. and Xu Z., Am. Mineral. 80, 670 (1995). [Google Scholar]
- 79.Boschitsch A. H. and Fenley M. O., J. Chem. Theory Comput. 7, 1524 (2011). 10.1021/ct1006983 [DOI] [PMC free article] [PubMed] [Google Scholar]
- 80.Boschitsch A. H. and Fenley M. O., J. Comput. Chem. 28, 909 (2007). 10.1002/jcc.20565 [DOI] [PubMed] [Google Scholar]


