

Abstract
Purpose
Traditional disease-free survival (DFS) does not reflect changes in prognosis over time. Conditional DFS accounts for elapsed time since achieving remission and may provide more relevant prognostic information for patients and clinicians. This study aimed to estimate conditional DFS among patients with ovarian cancer and to evaluate the impact of patient characteristics.
Patients and Methods
Patients were recruited as part of the Hormones and Ovarian Cancer Prediction case-control study and were included in the current study if they had achieved remission after a diagnosis of cancer of the ovary, fallopian tube, or peritoneum (N = 404). Demographic and lifestyle information was collected at enrollment; disease, treatment, and outcome information was abstracted from medical records. DFS was calculated using the Kaplan-Meier method. Conditional DFS estimates were computed using cumulative DFS estimates.
Results
Median DFS was 2.54 years (range, 0.03-9.96 years) and 3-year DFS was 48.2%. The probability of surviving an additional 3 years without recurrence, conditioned on having already survived 1, 2, 3, 4, and 5 years after remission, was 63.8%, 80.5%, 90.4%, 97.0%, and 97.7%, respectively. Initial differences in 3-year DFS at time of remission between age, stage, histology, and grade groups decreased over time.
Conclusion
DFS estimates for patients with ovarian cancer improved dramatically over time, in particular among those with poorer initial prognoses. Conditional DFS is a more relevant measure of prognosis for patients with ovarian cancer who have already achieved a period of remission, and time elapsed since remission should be taken into account when making follow-up care decisions.
INTRODUCTION
There were approximately 22,240 incident cases of ovarian cancer (OC) and 14,030 deaths due to OC in the United States in 2013.1 Patients diagnosed with localized OC have an estimated survival rate of 92%. Unfortunately, the majority of OC cases are diagnosed with regional or distant disease when survival rates are 72% and 27%, respectively.2
Survival estimates are traditionally reported from the time of diagnosis (overall survival [OS]) or remission (disease-free survival [DFS]). Although these estimates provide important information for patients and clinicians, they are not necessarily still applicable to patients who have already survived a period of time after their initial diagnosis and treatment. Conditional survival, which takes into account changes in risk over time, may offer more accurate estimates for these patients. Several previous studies assessed conditional OS among patients with OC; three used data from the SEER database,3–5 and one used data from the European Network for Indicators on Cancer (EUNICE).6 They reported that OS estimates improved as time elapsed since diagnosis and that the impact of prognostic factors such as age, stage, and histology diminished over time. These findings provide evidence that survival probabilities change significantly when accounting for time elapsed after diagnosis.
The majority of patients with OC achieve remission but, unfortunately, most will also eventually relapse. Follow-up care typically includes physical exams, imaging tests, and the close monitoring of CA-125 levels. There is, however, controversy regarding the effectiveness of these efforts to meaningfully impact disease outcomes.7–9 In addition, results from a recent clinical trial suggest that there is no survival benefit to initiating chemotherapy when CA-125 levels increase compared with delaying treatment until there is clinical evidence of disease.10 Moreover, earlier deterioration in quality of life was observed among women who were treated based on rising CA-125 levels alone.10 Therefore, there is a need to provide more accurate information regarding risk of recurrence, such as conditional DFS estimates, to patients so that they can make better informed decisions concerning their follow-up care.
To our knowledge, no prior studies have assessed conditional DFS among patients with OC. The objective of this study was to estimate conditional DFS among patients with OC and to evaluate the impact of patient characteristics.
PATIENTS AND METHODS
Study Population and Data Collection
Patients included in our analysis were enrolled as part of the Hormones and Ovarian Cancer Prediction (HOPE) case-control study, which has been described in detail previously.11,12 Briefly, HOPE includes 902 ovarian, peritoneal, and fallopian tube cases from a contiguous region of Western Pennsylvania (PA), Eastern Ohio (OH), and Western New York (NY). Cases were diagnosed between February 2003 and December 2008, ≥ 25 years old, and within 9 months of initial diagnosis at the time of recruitment. All participants provided informed consent. The study was approved by the University of Pittsburgh institutional review board and by human subject committees at each hospital where cases were identified and enrolled.
Trained interviewers collected demographic, lifestyle, and medical history information via in-person interviews, using 9 months before enrollment as reference date. Follow-up data has been collected on an ongoing basis through annual requests for patients' medical records from their treating physicians. Information collected includes CA-125 laboratory results, chemotherapy flow sheets, pathology reports, surgical and hospitalization records, imaging results, and oncologist notes. The Social Security Death Index (SSDI) and the National Death Index (NDI) were also used to determine vital status. For the purposes of this study, the cutoff date for follow-up data collection was April 16, 2013.
Patients recruited from OH or PA were included in the current study if they had achieved remission. Cases with borderline or nonepithelial tumors were excluded. Of the 651 patients recruited from OH or PA, 404 fulfilled these criteria and were included.
Disease Characteristics, Treatment, and Outcome
Information on disease characteristics, treatment and outcome was abstracted from medical records. Tumors reported to be of mixed grade were assigned to the highest tumor grade category. Cases were considered to be optimally debulked if their residual disease was less than 1 cm. If residual tumor size was unavailable, they were classified as optimally debulked if their surgeon/oncologist declared them to be optimally debulked. The presence of ascites and pleural effusion was collected from imaging results. If scans were not available, the presence of ascites or pleural effusion was considered to be “could not be assessed.” Chemotherapy agents were categorized into three groups: platinum-based (carboplatin, cisplatin, oxaliplatin, and abraxane), taxanes (taxol, taxotere, and xyotax), and other (all other chemotherapy agents, including: avastin, doxil, topotecan, gemzar, cytoxan, interferon, mytomycin, erbitux, ifosphomaide, catumaxomab, and ovarex). Total number of cycles received for each group was the sum of all neoadjuvant, adjuvant, maintenance, and persistent disease-related chemotherapy. Persistent disease was defined as the presence of measurable disease after primary treatment.
Date of diagnosis was the date of first positive cytology or, in cases with no available cytology before primary surgery, the date of primary surgery. Date of remission was the date an oncologist first declared the patient to have no evidence of disease (n = 278). For patients missing this information (n = 126), we used the following (listed in order of use): (1) date of the first negative surgical results (n = 17); (2) date of the first negative imaging results (n = 19); (3) date of first other event indicating no evidence of disease (eg, normalized CA-125 level; n = 3); and, if none of this was available, (4) a date of 4 weeks after completion of chemotherapy (n = 75) or, if no chemotherapy was received, the date of primary surgery (n = 12). Recurrence was defined as the return of disease after being in remission. A similar process as for date of remission was applied to determine date of recurrence. If available, the date an oncologist first diagnosed the patient with recurrence was used (n = 179); when this was not available, we used the following (listed in order of use): (1) date of the first positive surgical results (n = 16); (2) date of the first positive imaging results (n = 11); (3) date of chemotherapy/radiation initiation (n = 14); and (4) date of first other event indicating return of disease (eg, elevated CA-125 level; n = 2) after being disease-free. OS was defined as the time elapsed between date of diagnosis and date of death or last contact. DFS was defined as the interval between date of remission and date of recurrence or last contact. Patients who were not diagnosed with recurrent OC during the follow-up period were censored at the date of last contact.
Statistical Analysis
Traditional OS and DFS estimates were calculated using the Kaplan-Meier approach. Conditional DFS, an extension of the concept of conditional OS, is the probability of staying disease-free an additional y years given that the patient has already been in remission for x years.13–15 Conditional DFS estimates were computed using cumulative DFS estimates.14 For example, to compute the 3-year conditional DFS estimate for patients who had already been in remission for 2 years, the 5-year cumulative DFS was divided by the 2-year cumulative DFS. Changes in DFS over time were assessed by comparing 3-year conditional DFS estimates at 1, 2, 3, 4, and 5 years after achieving remission with baseline (date of remission) 3-year DFS estimates. In addition to overall conditional DFS, to evaluate the effect of patient characteristics, we also computed 3-year conditional DFS estimates within strata defined by age, stage, histology, and grade. Impact of patient characteristics on DFS at baseline and at 1 and 2 years after achieving remission was also evaluated using age-adjusted Cox proportional hazards models to calculate hazard ratios and corresponding 95% CIs for recurrence. We used the landmark analysis approach to assess impact at years 1 and 2 of remission.16,17 The size of some of the subgroups and the number of events was too small to yield meaningful results for later years. Women who had recurred or whose date of last contact was within 1 year of remission were excluded from the 1-year time point analysis. Similarly, women who had this happen within 2 years of remission were excluded from the 2-year time point analysis. DFS was measured from the time point of interest and age used in the models was current age (that is, age at baseline plus 1 year for the 1-year time point, plus 2 years for the 2-year time point). All significance tests were two-sided; P values less than 0.05 were considered statistically significant. All analyses were conducted using Stata version 12.1 (StataCorp LP, College Station, TX).
RESULTS
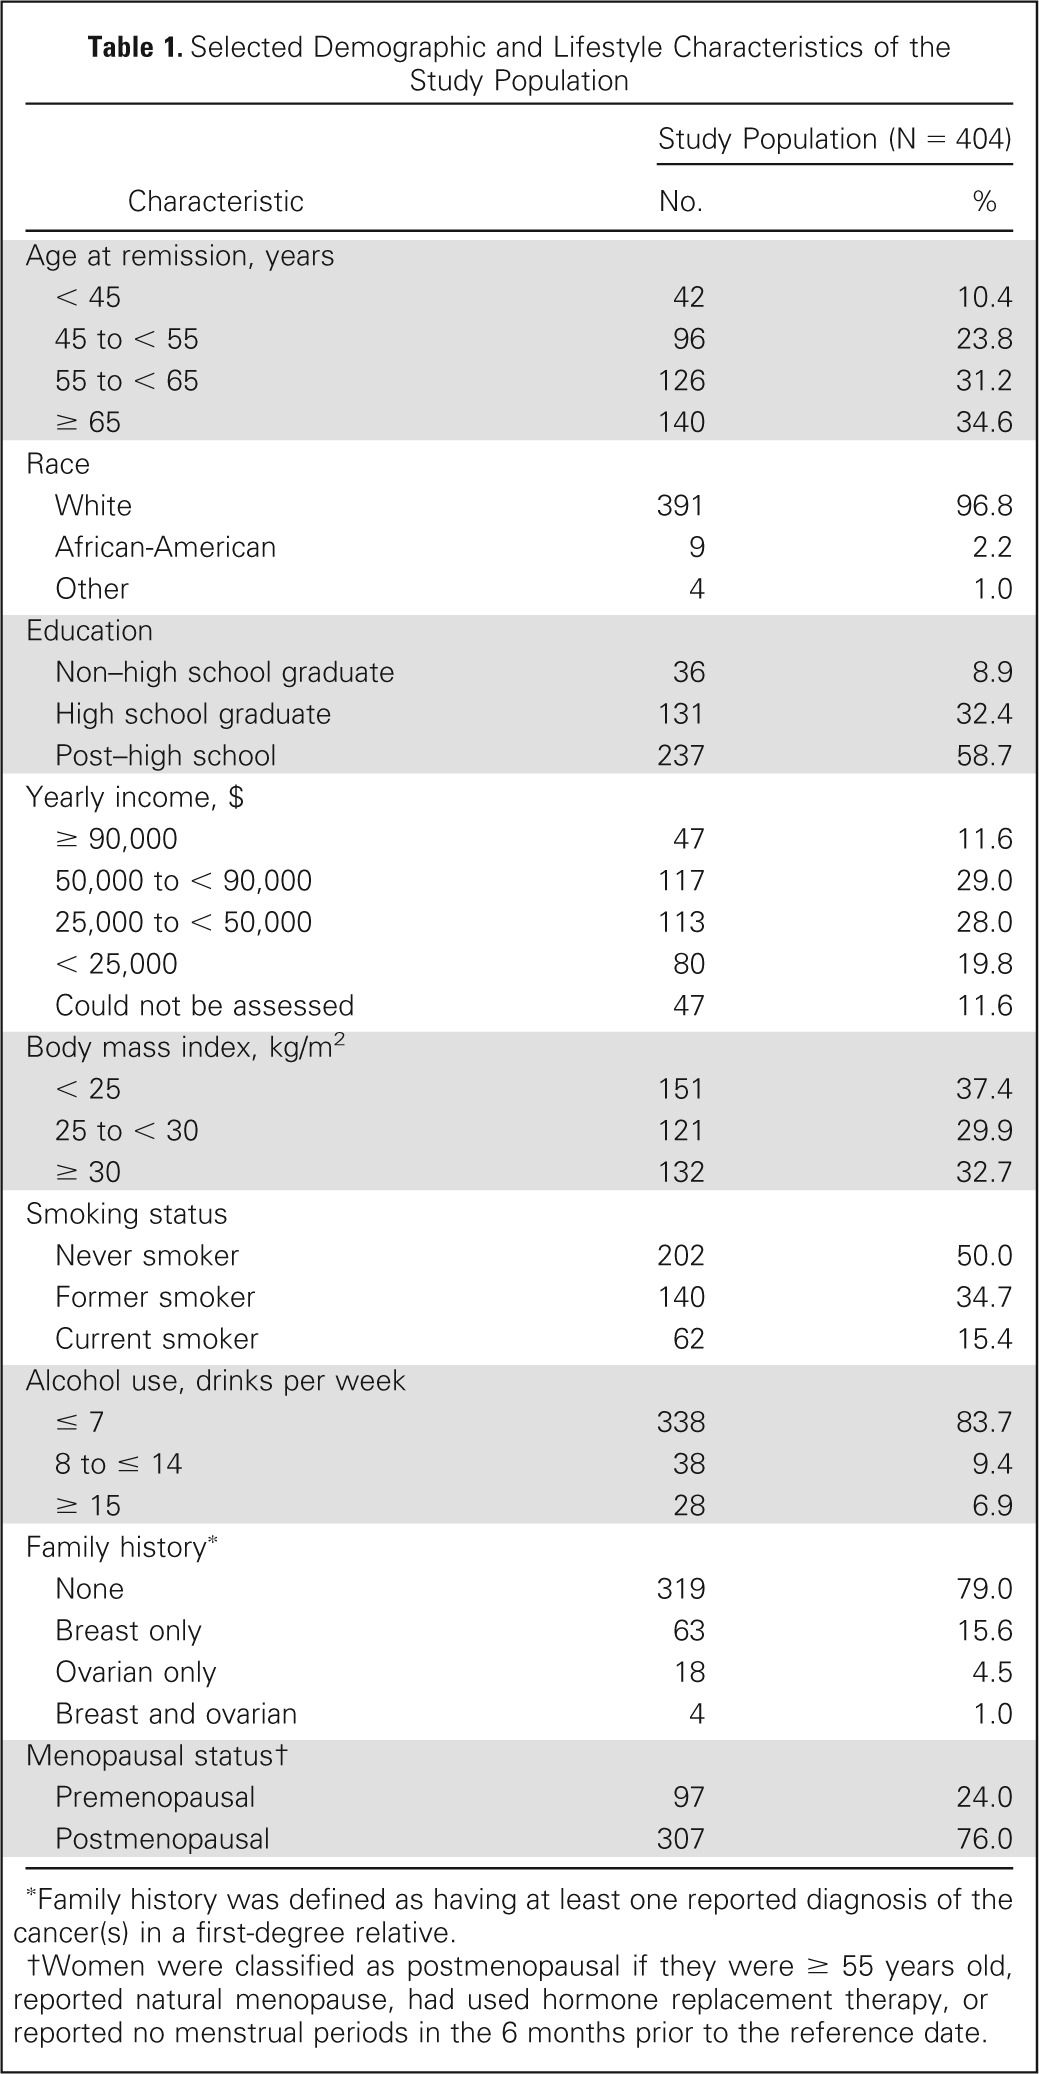
Selected demographic and lifestyle characteristics of the study population are shown in Table 1. The majority of patients were white and postmenopausal. Median age at diagnosis was 58.6 years (not in table), and 5.5% had a family history of ovarian-only or breast and ovarian cancer.
Table 1.
Selected Demographic and Lifestyle Characteristics of the Study Population
| Characteristic | Study Population (N = 404) |
|
|---|---|---|
| No. | % | |
| Age at remission, years | ||
| < 45 | 42 | 10.4 |
| 45 to < 55 | 96 | 23.8 |
| 55 to < 65 | 126 | 31.2 |
| ≥ 65 | 140 | 34.6 |
| Race | ||
| White | 391 | 96.8 |
| African-American | 9 | 2.2 |
| Other | 4 | 1.0 |
| Education | ||
| Non–high school graduate | 36 | 8.9 |
| High school graduate | 131 | 32.4 |
| Post–high school | 237 | 58.7 |
| Yearly income, $ | ||
| ≥ 90,000 | 47 | 11.6 |
| 50,000 to < 90,000 | 117 | 29.0 |
| 25,000 to < 50,000 | 113 | 28.0 |
| < 25,000 | 80 | 19.8 |
| Could not be assessed | 47 | 11.6 |
| Body mass index, kg/m2 | ||
| < 25 | 151 | 37.4 |
| 25 to < 30 | 121 | 29.9 |
| ≥ 30 | 132 | 32.7 |
| Smoking status | ||
| Never smoker | 202 | 50.0 |
| Former smoker | 140 | 34.7 |
| Current smoker | 62 | 15.4 |
| Alcohol use, drinks per week | ||
| ≤ 7 | 338 | 83.7 |
| 8 to ≤ 14 | 38 | 9.4 |
| ≥ 15 | 28 | 6.9 |
| Family history* | ||
| None | 319 | 79.0 |
| Breast only | 63 | 15.6 |
| Ovarian only | 18 | 4.5 |
| Breast and ovarian | 4 | 1.0 |
| Menopausal status† | ||
| Premenopausal | 97 | 24.0 |
| Postmenopausal | 307 | 76.0 |
Family history was defined as having at least one reported diagnosis of the cancer(s) in a first-degree relative.
Women were classified as postmenopausal if they were ≥ 55 years old, reported natural menopause, had used hormone replacement therapy, or reported no menstrual periods in the 6 months prior to the reference date.
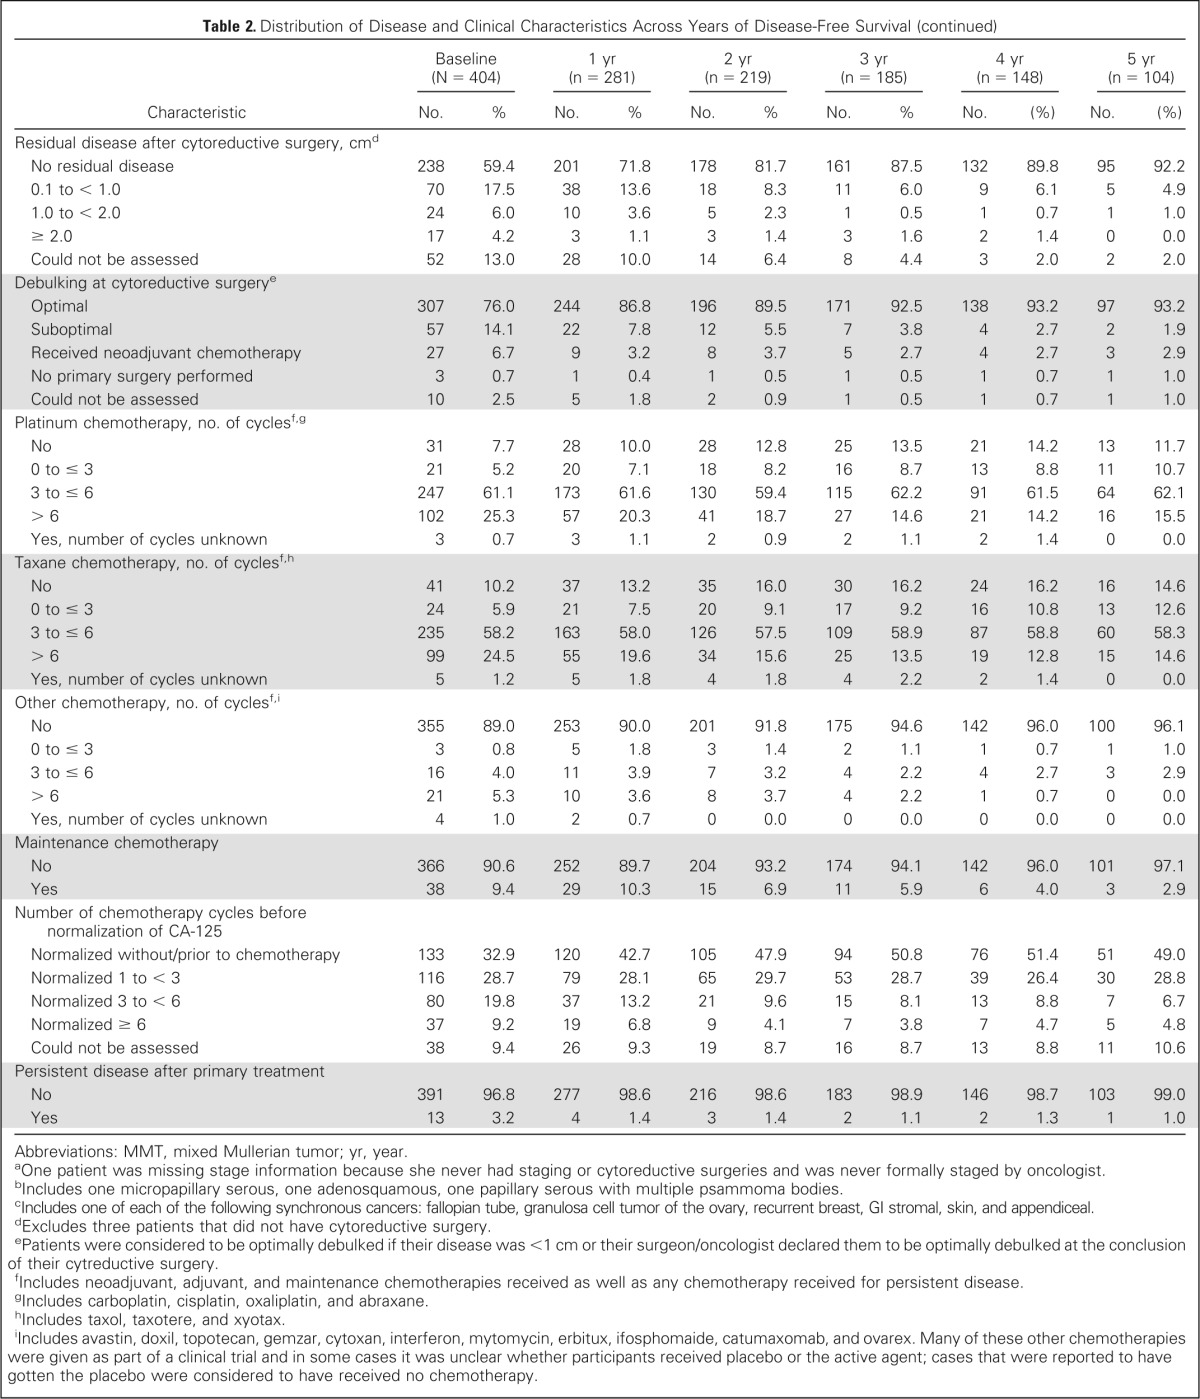
Table 2 presents the distribution of disease and clinical characteristics among patients across years of disease-free survival (ie, at baseline and 1, 2, 3, 4, and 5 years after achieving remission, given that they remained in remission at these time points). Only 30.8% of the study participants had been diagnosed with stage I disease, however, 61.8% of the women who survived 5 years without recurrence had stage I disease. Similar relationships were observed for histologic subtypes, cytology of ascites/pelvic washings, pretreatment ascites, lymph node involvement, presence and size of residual disease, debulking status, and number of chemotherapy cycles before normalization of CA-125.
Table 2.
Distribution of Disease and Clinical Characteristics Across Years of Disease-Free Survival

| Characteristic | Baseline (N = 404) |
1 yr (n = 281) |
2 yr (n = 219) |
3 yr (n = 185) |
4 yr (n = 148) |
5 yr (n = 104) |
||||||
|---|---|---|---|---|---|---|---|---|---|---|---|---|
| No. | % | No. | % | No. | % | No. | % | No. | (%) | No. | (%) | |
| Stagea | ||||||||||||
| I | 124 | 30.8 | 118 | 42.1 | 112 | 51.4 | 108 | 58.7 | 89 | 60.5 | 64 | 61.8 |
| II | 44 | 10.9 | 37 | 13.2 | 31 | 14.2 | 28 | 15.2 | 25 | 17.0 | 19 | 18.6 |
| III | 205 | 50.9 | 113 | 40.4 | 69 | 31.7 | 44 | 23.9 | 30 | 20.4 | 17 | 16.7 |
| IV | 30 | 7.4 | 12 | 4.3 | 6 | 2.8 | 4 | 2.2 | 3 | 2.0 | 3 | 2.9 |
| Primary site | ||||||||||||
| Ovarian | 341 | 84.4 | 239 | 85.1 | 189 | 86.3 | 165 | 89.2 | 130 | 87.8 | 94 | 90.3 |
| Peritoneal | 30 | 7.4 | 18 | 6.4 | 11 | 5.0 | 4 | 2.2 | 3 | 2.0 | 2 | 1.9 |
| Fallopian | 28 | 6.9 | 22 | 7.8 | 17 | 7.8 | 15 | 8.1 | 14 | 9.5 | 7 | 6.8 |
| Could not be assessed | 5 | 1.2 | 2 | 0.7 | 2 | 0.9 | 1 | 0.5 | 1 | 0.7 | 1 | 1.0 |
| Grade | ||||||||||||
| Well differentiated | 42 | 10.4 | 39 | 13.9 | 34 | 15.5 | 32 | 17.3 | 28 | 18.9 | 16 | 15.4 |
| Moderately differentiated | 106 | 26.2 | 78 | 27.8 | 61 | 27.9 | 53 | 28.6 | 41 | 27.7 | 31 | 29.8 |
| Poorly differentiated | 221 | 54.7 | 139 | 49.5 | 102 | 46.6 | 83 | 44.9 | 63 | 42.6 | 47 | 45.2 |
| Could not be assessed | 35 | 8.7 | 25 | 8.9 | 22 | 10.0 | 17 | 9.2 | 16 | 10.8 | 10 | 9.6 |
| Histology | ||||||||||||
| Serous | 216 | 53.5 | 125 | 44.5 | 81 | 37.0 | 60 | 32.4 | 45 | 30.4 | 29 | 28.2 |
| Endometrioid | 68 | 16.8 | 60 | 21.4 | 52 | 23.7 | 51 | 27.6 | 38 | 25.7 | 32 | 31.1 |
| Mucinous | 21 | 5.2 | 20 | 7.1 | 20 | 9.1 | 18 | 9.7 | 16 | 10.8 | 10 | 8.7 |
| Clear cell | 29 | 7.2 | 28 | 10.0 | 24 | 11.0 | 22 | 11.9 | 20 | 13.5 | 14 | 13.6 |
| Brenner | 5 | 1.2 | 4 | 1.4 | 4 | 1.8 | 3 | 1.6 | 3 | 2.0 | 3 | 2.9 |
| MMT | 9 | 2.2 | 7 | 2.5 | 6 | 2.7 | 5 | 2.7 | 5 | 3.4 | 4 | 3.9 |
| Mixed | 40 | 9.9 | 29 | 10.3 | 25 | 11.4 | 21 | 11.4 | 17 | 11.5 | 11 | 10.7 |
| Otherb | 3 | 0.7 | 2 | 0.7 | 1 | 0.5 | 1 | 0.5 | 0 | 0.0 | 0 | 0.0 |
| Could not be assessed | 13 | 3.2 | 6 | 2.1 | 6 | 2.7 | 4 | 2.2 | 4 | 2.7 | 1 | 1.0 |
| Pretreatment CA-125 | ||||||||||||
| ≤ 35 U/mL | 60 | 14.9 | 54 | 19.2 | 49 | 22.4 | 45 | 24.3 | 38 | 25.7 | 28 | 26.2 |
| > 35 U/mL | 274 | 67.8 | 178 | 63.4 | 136 | 62.1 | 112 | 60.5 | 94 | 63.5 | 68 | 66.0 |
| Could not be assessed | 70 | 17.3 | 49 | 17.4 | 34 | 15.5 | 28 | 15.1 | 16 | 10.8 | 8 | 7.8 |
| Pretreatment pleural effusion | ||||||||||||
| No | 58 | 14.4 | 36 | 12.8 | 29 | 13.2 | 29 | 15.7 | 27 | 18.2 | 19 | 18.5 |
| Yes | 44 | 10.9 | 23 | 8.2 | 15 | 6.9 | 10 | 5.4 | 7 | 4.7 | 6 | 5.8 |
| Could not be assessed | 302 | 74.8 | 222 | 79.0 | 175 | 79.9 | 146 | 78.9 | 114 | 77.0 | 79 | 75.7 |
| Cytology of ascites/pelvic washings | ||||||||||||
| Negative | 138 | 34.2 | 123 | 43.8 | 114 | 52.1 | 107 | 57.8 | 85 | 57.4 | 64 | 61.2 |
| Positive | 182 | 45.1 | 103 | 36.6 | 60 | 27.4 | 44 | 23.8 | 37 | 25.0 | 23 | 22.3 |
| Atypical | 16 | 4.0 | 11 | 3.9 | 9 | 4.1 | 7 | 3.8 | 7 | 4.7 | 4 | 3.9 |
| Could not be assessed | 68 | 16.8 | 44 | 15.7 | 36 | 16.4 | 27 | 14.6 | 19 | 12.8 | 13 | 12.6 |
| Pretreatment ascites | ||||||||||||
| No | 153 | 37.9 | 128 | 45.6 | 112 | 51.1 | 99 | 53.5 | 83 | 56.1 | 60 | 57.3 |
| Yes | 246 | 60.9 | 148 | 52.7 | 103 | 47.0 | 84 | 45.4 | 63 | 42.6 | 43 | 41.8 |
| Could not be assessed | 5 | 1.2 | 5 | 1.8 | 4 | 1.8 | 2 | 1.1 | 2 | 1.4 | 1 | 1.0 |
| Lymph node involvement | ||||||||||||
| No palpable nodes, no biopsies | 152 | 37.6 | 83 | 29.5 | 55 | 25.1 | 42 | 22.7 | 31 | 21.0 | 18 | 17.5 |
| Palpable nodes, no biopsies | 6 | 1.5 | 5 | 1.8 | 1 | 0.5 | 0 | 0.0 | 0 | 0.0 | 0 | 0.0 |
| Biopsies negative | 183 | 45.3 | 157 | 55.9 | 139 | 63.5 | 125 | 67.6 | 105 | 71.0 | 76 | 72.8 |
| Biopsies positive | 57 | 14.1 | 33 | 11.7 | 21 | 9.6 | 16 | 8.7 | 10 | 6.8 | 8 | 7.8 |
| Could not be assessed | 6 | 1.5 | 3 | 1.1 | 3 | 1.4 | 2 | 1.1 | 2 | 1.4 | 2 | 1.9 |
| Synchronous primary tumor | ||||||||||||
| No | 375 | 93.5 | 261 | 93.2 | 202 | 92.7 | 170 | 92.4 | 135 | 91.8 | 96 | 93.1 |
| Yes, endometrial | 20 | 5.0 | 15 | 5.4 | 14 | 6.4 | 13 | 7.1 | 11 | 7.5 | 7 | 6.9 |
| Yes, otherc | 6 | 1.5 | 4 | 1.4 | 2 | 0.9 | 1 | 0.5 | 1 | 0.7 | 0 | 0.0 |
| Residual disease after cytoreductive surgeryd | ||||||||||||
| No | 238 | 59.4 | 199 | 71.1 | 176 | 80.7 | 160 | 87.0 | 132 | 89.8 | 95 | 92.2 |
| Yes | 133 | 33.2 | 65 | 23.2 | 34 | 15.6 | 21 | 11.4 | 15 | 6.1 | 8 | 7.8 |
| Could not be assessed | 30 | 7.5 | 16 | 5.7 | 8 | 3.7 | 3 | 1.6 | 0 | 0.0 | 0 | 0.0 |
| Residual disease after cytoreductive surgery, cmd | ||||||||||||
| No residual disease | 238 | 59.4 | 201 | 71.8 | 178 | 81.7 | 161 | 87.5 | 132 | 89.8 | 95 | 92.2 |
| 0.1 to < 1.0 | 70 | 17.5 | 38 | 13.6 | 18 | 8.3 | 11 | 6.0 | 9 | 6.1 | 5 | 4.9 |
| 1.0 to < 2.0 | 24 | 6.0 | 10 | 3.6 | 5 | 2.3 | 1 | 0.5 | 1 | 0.7 | 1 | 1.0 |
| ≥ 2.0 | 17 | 4.2 | 3 | 1.1 | 3 | 1.4 | 3 | 1.6 | 2 | 1.4 | 0 | 0.0 |
| Could not be assessed | 52 | 13.0 | 28 | 10.0 | 14 | 6.4 | 8 | 4.4 | 3 | 2.0 | 2 | 2.0 |
| Debulking at cytoreductive surgerye | ||||||||||||
| Optimal | 307 | 76.0 | 244 | 86.8 | 196 | 89.5 | 171 | 92.5 | 138 | 93.2 | 97 | 93.2 |
| Suboptimal | 57 | 14.1 | 22 | 7.8 | 12 | 5.5 | 7 | 3.8 | 4 | 2.7 | 2 | 1.9 |
| Received neoadjuvant chemotherapy | 27 | 6.7 | 9 | 3.2 | 8 | 3.7 | 5 | 2.7 | 4 | 2.7 | 3 | 2.9 |
| No primary surgery performed | 3 | 0.7 | 1 | 0.4 | 1 | 0.5 | 1 | 0.5 | 1 | 0.7 | 1 | 1.0 |
| Could not be assessed | 10 | 2.5 | 5 | 1.8 | 2 | 0.9 | 1 | 0.5 | 1 | 0.7 | 1 | 1.0 |
| Platinum chemotherapy, no. of cyclesf,g | ||||||||||||
| No | 31 | 7.7 | 28 | 10.0 | 28 | 12.8 | 25 | 13.5 | 21 | 14.2 | 13 | 11.7 |
| 0 to ≤ 3 | 21 | 5.2 | 20 | 7.1 | 18 | 8.2 | 16 | 8.7 | 13 | 8.8 | 11 | 10.7 |
| 3 to ≤ 6 | 247 | 61.1 | 173 | 61.6 | 130 | 59.4 | 115 | 62.2 | 91 | 61.5 | 64 | 62.1 |
| > 6 | 102 | 25.3 | 57 | 20.3 | 41 | 18.7 | 27 | 14.6 | 21 | 14.2 | 16 | 15.5 |
| Yes, number of cycles unknown | 3 | 0.7 | 3 | 1.1 | 2 | 0.9 | 2 | 1.1 | 2 | 1.4 | 0 | 0.0 |
| Taxane chemotherapy, no. of cyclesf,h | ||||||||||||
| No | 41 | 10.2 | 37 | 13.2 | 35 | 16.0 | 30 | 16.2 | 24 | 16.2 | 16 | 14.6 |
| 0 to ≤ 3 | 24 | 5.9 | 21 | 7.5 | 20 | 9.1 | 17 | 9.2 | 16 | 10.8 | 13 | 12.6 |
| 3 to ≤ 6 | 235 | 58.2 | 163 | 58.0 | 126 | 57.5 | 109 | 58.9 | 87 | 58.8 | 60 | 58.3 |
| > 6 | 99 | 24.5 | 55 | 19.6 | 34 | 15.6 | 25 | 13.5 | 19 | 12.8 | 15 | 14.6 |
| Yes, number of cycles unknown | 5 | 1.2 | 5 | 1.8 | 4 | 1.8 | 4 | 2.2 | 2 | 1.4 | 0 | 0.0 |
| Other chemotherapy, no. of cyclesf,i | ||||||||||||
| No | 355 | 89.0 | 253 | 90.0 | 201 | 91.8 | 175 | 94.6 | 142 | 96.0 | 100 | 96.1 |
| 0 to ≤ 3 | 3 | 0.8 | 5 | 1.8 | 3 | 1.4 | 2 | 1.1 | 1 | 0.7 | 1 | 1.0 |
| 3 to ≤ 6 | 16 | 4.0 | 11 | 3.9 | 7 | 3.2 | 4 | 2.2 | 4 | 2.7 | 3 | 2.9 |
| > 6 | 21 | 5.3 | 10 | 3.6 | 8 | 3.7 | 4 | 2.2 | 1 | 0.7 | 0 | 0.0 |
| Yes, number of cycles unknown | 4 | 1.0 | 2 | 0.7 | 0 | 0.0 | 0 | 0.0 | 0 | 0.0 | 0 | 0.0 |
| Maintenance chemotherapy | ||||||||||||
| No | 366 | 90.6 | 252 | 89.7 | 204 | 93.2 | 174 | 94.1 | 142 | 96.0 | 101 | 97.1 |
| Yes | 38 | 9.4 | 29 | 10.3 | 15 | 6.9 | 11 | 5.9 | 6 | 4.0 | 3 | 2.9 |
| Number of chemotherapy cycles before normalization of CA-125 | ||||||||||||
| Normalized without/prior to chemotherapy | 133 | 32.9 | 120 | 42.7 | 105 | 47.9 | 94 | 50.8 | 76 | 51.4 | 51 | 49.0 |
| Normalized 1 to < 3 | 116 | 28.7 | 79 | 28.1 | 65 | 29.7 | 53 | 28.7 | 39 | 26.4 | 30 | 28.8 |
| Normalized 3 to < 6 | 80 | 19.8 | 37 | 13.2 | 21 | 9.6 | 15 | 8.1 | 13 | 8.8 | 7 | 6.7 |
| Normalized ≥ 6 | 37 | 9.2 | 19 | 6.8 | 9 | 4.1 | 7 | 3.8 | 7 | 4.7 | 5 | 4.8 |
| Could not be assessed | 38 | 9.4 | 26 | 9.3 | 19 | 8.7 | 16 | 8.7 | 13 | 8.8 | 11 | 10.6 |
| Persistent disease after primary treatment | ||||||||||||
| No | 391 | 96.8 | 277 | 98.6 | 216 | 98.6 | 183 | 98.9 | 146 | 98.7 | 103 | 99.0 |
| Yes | 13 | 3.2 | 4 | 1.4 | 3 | 1.4 | 2 | 1.1 | 2 | 1.3 | 1 | 1.0 |
Abbreviations: MMT, mixed Mullerian tumor; yr, year.
One patient was missing stage information because she never had staging or cytoreductive surgeries and was never formally staged by oncologist.
Includes one micropapillary serous, one adenosquamous, one papillary serous with multiple psammoma bodies.
Includes one of each of the following synchronous cancers: fallopian tube, granulosa cell tumor of the ovary, recurrent breast, GI stromal, skin, and appendiceal.
Excludes three patients that did not have cytoreductive surgery.
Patients were considered to be optimally debulked if their disease was <1 cm or their surgeon/oncologist declared them to be optimally debulked at the conclusion of their cytreductive surgery.
Includes neoadjuvant, adjuvant, and maintenance chemotherapies received as well as any chemotherapy received for persistent disease.
Includes carboplatin, cisplatin, oxaliplatin, and abraxane.
Includes taxol, taxotere, and xyotax.
Includes avastin, doxil, topotecan, gemzar, cytoxan, interferon, mytomycin, erbitux, ifosphomaide, catumaxomab, and ovarex. Many of these other chemotherapies were given as part of a clinical trial and in some cases it was unclear whether participants received placebo or the active agent; cases that were reported to have gotten the placebo were considered to have received no chemotherapy.
Among all 404 patients included in this study, median OS was 4.50 years (range, 0.82-9.89 years). At the cutoff date for follow-up, 235 (58.2%) study participants were still alive. Median time elapsed between date of diagnosis and remission was 6.45 months (range, 0-26.20 months; this includes 12 women whose date of diagnosis was the date of their cytoreductive surgery after which there was no residual disease and no further treatment necessary). Traditional DFS curves, stratified by age at remission and stage, are depicted in Appendix Figure A1 (online only). Within our study, 222 (55.0%) women were diagnosed with recurrent OC and median DFS was 2.54 years (range, 0.03-9.36 years).
At baseline, 3-year DFS was 48.2%. The probability of surviving an additional 3 years without recurrence, conditioned on having already survived 1, 2, 3, 4, and 5 years after remission, improved to 63.8%, 80.5%, 90.4%, 97.0%, and 97.7%, respectively (see Fig 1). Presented differently, the probability that a patient will still be disease-free 5 years after achieving remission increases from 44.6% at baseline to 63.3%, 80.5%, 92.4%, and 99.2% after being already disease-free for, respectively, 1, 2, 3, and 4 years.
Fig 1.

Three–year conditional disease-free survival estimates. Number of patients still in remission at particular time point.
Figure 2 shows 3-year conditional DFS estimates stratified by age, stage, histology, and grade. Generally, 3-year DFS estimates increased for all age, stage, histology, and grade groups evaluated and the disparity in estimates decreased with longer time in remission. For instance, 3-year DFS estimates for histology groups ranged from 28.8% to 95.2% at baseline but this range became tighter over time and at year 5 was 90.9% to 100% (see Fig 2). The largest improvements in 3-year DFS estimates were observed for older women and those diagnosed with stage III/IV disease, serous tumors, and poorly differentiated tumors (see Fig 2).
Fig 2.

Three-year conditional disease-free estimates stratified by age at remission (A), stage (B), histology (C), and grade (D). Number of patients still in remission at particular time point. diff., differentiated.
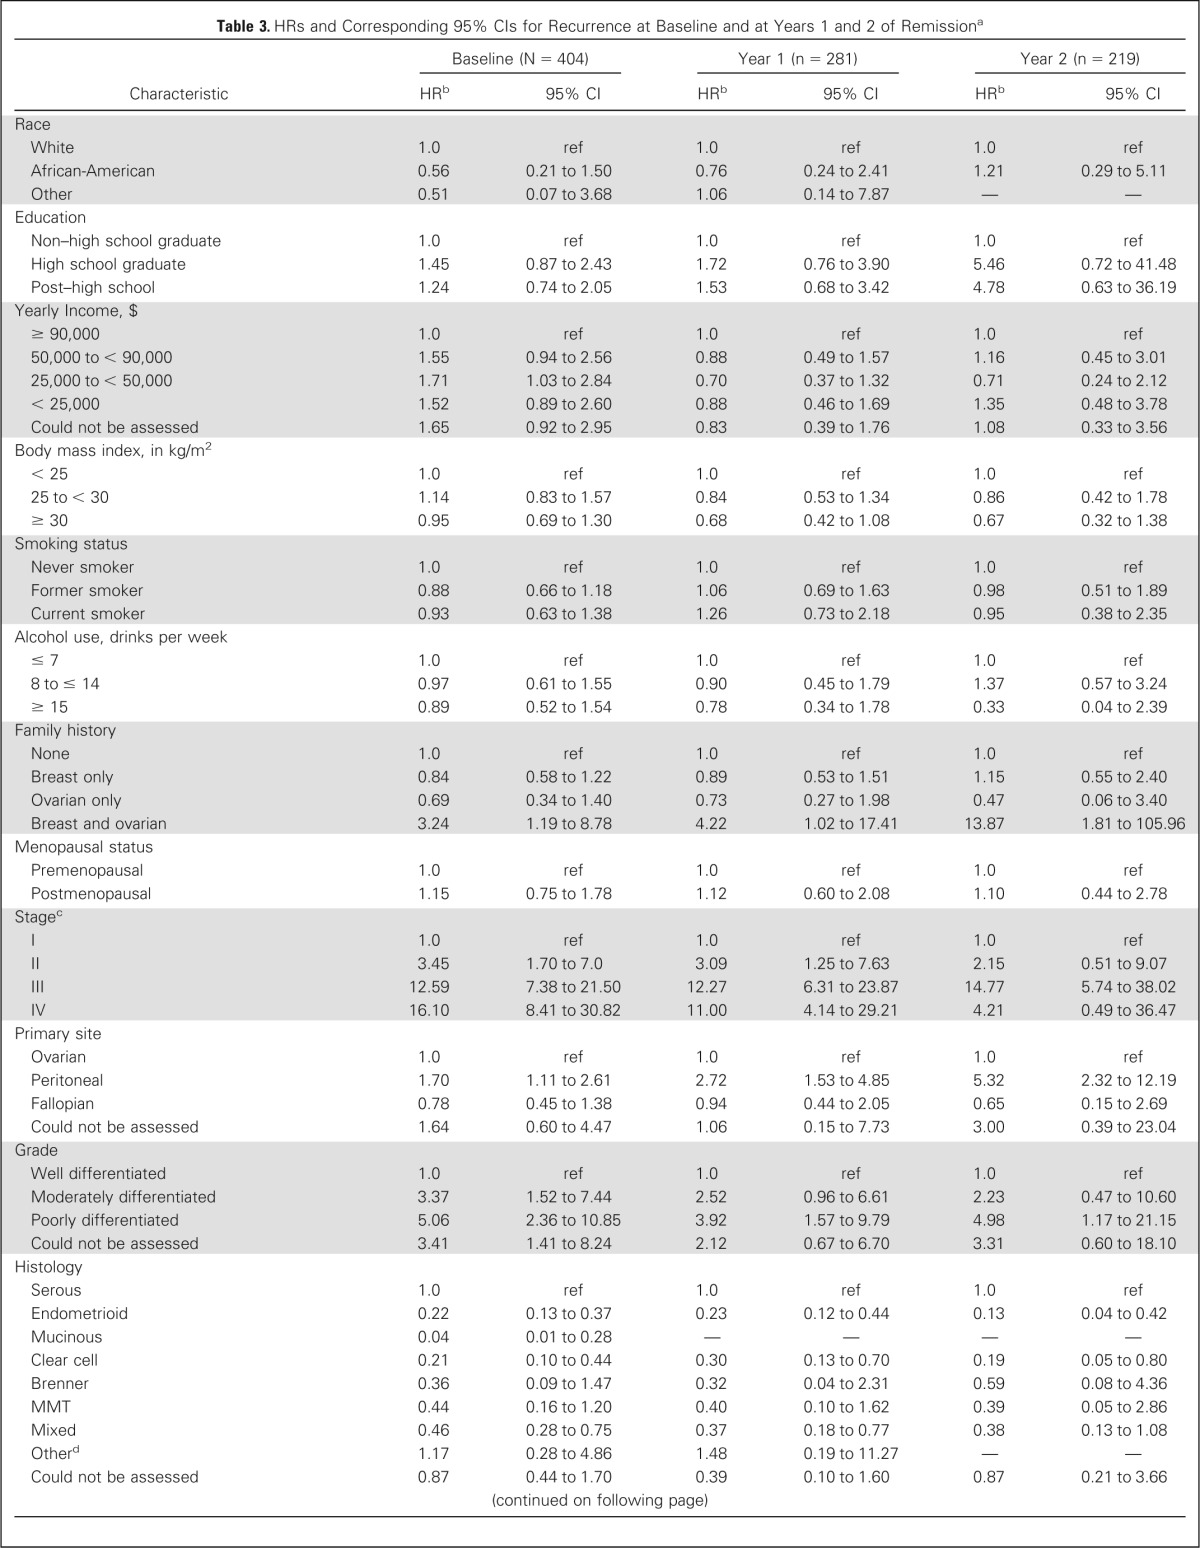
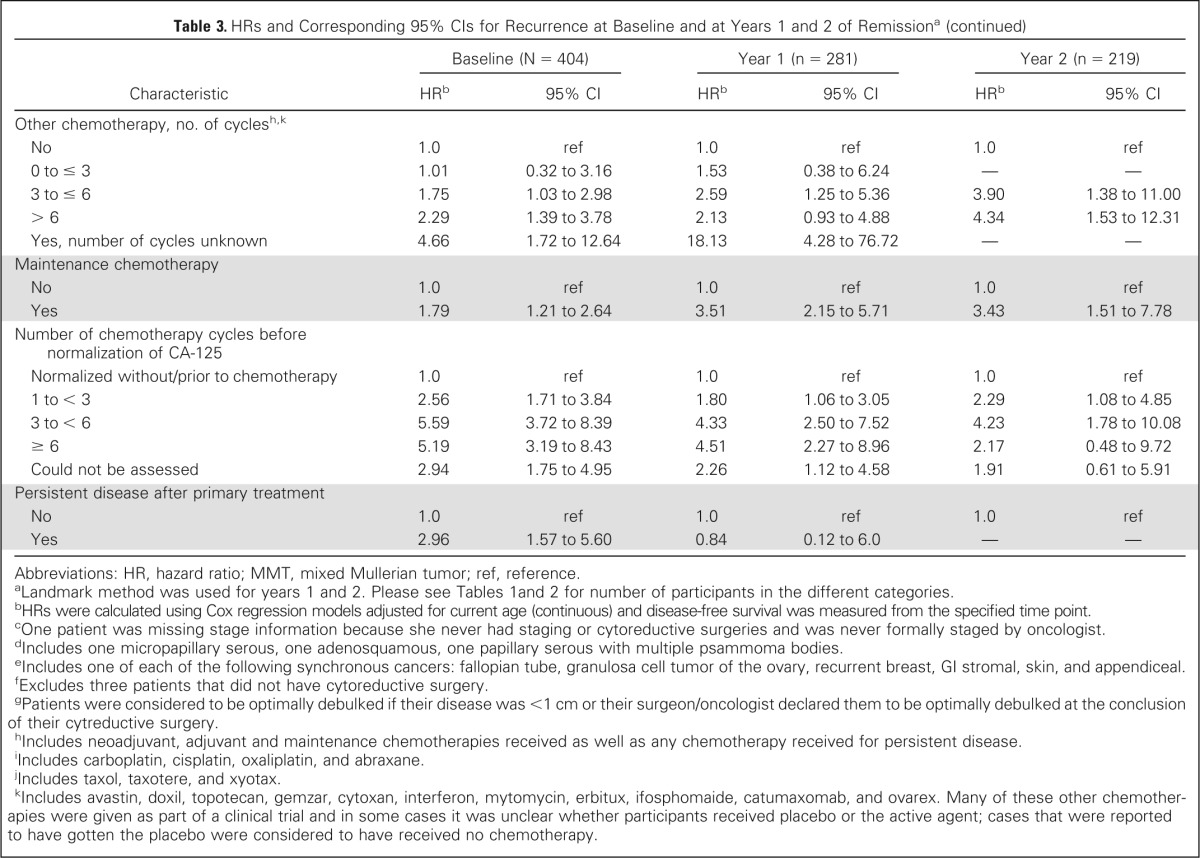
Cox proportional hazards models adjusted for current age were used to evaluate the effect of patient characteristics on subsequent DFS at baseline and at years 1 and 2 of remission; results are reported in Table 3. For the 1- and 2-year time points, DFS was measured from the specified time point and only women who were still disease-free at that time point were included in the analysis. At baseline, characteristics significantly associated with higher risk of recurrence (compared with reference group, see Table 3) included family history of breast and OC, later stage, peritoneal cancer, higher grade, pretreatment CA-125 greater than 35 U/mL, pretreatment pleural effusion, positive cytology of ascites/pelvic washings, pretreatment ascites, presence and larger size of residual disease, nonoptimal debulking, higher number of platinum, taxane, and other chemotherapy cycles, receiving maintenance chemotherapy, higher number of chemotherapy cycles before CA-125 normalization, and having persistent disease after primary treatment. Decreased risk of recurrence was significantly associated with negative lymph node biopsies and endometrioid, mucinous, clear cell, and mixed tumors. All these characteristics except pretreatment CA-125 level and persistent disease after primary treatment remained predictive of subsequent DFS at the 1- and 2-year time points. We were unable to assess the impact of several characteristics at the 2-year time point due to limitations of subgroup size.
Table 3.
HRs and Corresponding 95% CIs for Recurrence at Baseline and at Years 1 and 2 of Remissiona

| Characteristic | Baseline (N = 404) |
Year 1 (n = 281) |
Year 2 (n = 219) |
|||
|---|---|---|---|---|---|---|
| HRb | 95% CI | HRb | 95% CI | HRb | 95% CI | |
| Race | ||||||
| White | 1.0 | ref | 1.0 | ref | 1.0 | ref |
| African-American | 0.56 | 0.21 to 1.50 | 0.76 | 0.24 to 2.41 | 1.21 | 0.29 to 5.11 |
| Other | 0.51 | 0.07 to 3.68 | 1.06 | 0.14 to 7.87 | — | — |
| Education | ||||||
| Non–high school graduate | 1.0 | ref | 1.0 | ref | 1.0 | ref |
| High school graduate | 1.45 | 0.87 to 2.43 | 1.72 | 0.76 to 3.90 | 5.46 | 0.72 to 41.48 |
| Post–high school | 1.24 | 0.74 to 2.05 | 1.53 | 0.68 to 3.42 | 4.78 | 0.63 to 36.19 |
| Yearly Income, $ | ||||||
| ≥ 90,000 | 1.0 | ref | 1.0 | ref | 1.0 | ref |
| 50,000 to < 90,000 | 1.55 | 0.94 to 2.56 | 0.88 | 0.49 to 1.57 | 1.16 | 0.45 to 3.01 |
| 25,000 to < 50,000 | 1.71 | 1.03 to 2.84 | 0.70 | 0.37 to 1.32 | 0.71 | 0.24 to 2.12 |
| < 25,000 | 1.52 | 0.89 to 2.60 | 0.88 | 0.46 to 1.69 | 1.35 | 0.48 to 3.78 |
| Could not be assessed | 1.65 | 0.92 to 2.95 | 0.83 | 0.39 to 1.76 | 1.08 | 0.33 to 3.56 |
| Body mass index, in kg/m2 | ||||||
| < 25 | 1.0 | ref | 1.0 | ref | 1.0 | ref |
| 25 to < 30 | 1.14 | 0.83 to 1.57 | 0.84 | 0.53 to 1.34 | 0.86 | 0.42 to 1.78 |
| ≥ 30 | 0.95 | 0.69 to 1.30 | 0.68 | 0.42 to 1.08 | 0.67 | 0.32 to 1.38 |
| Smoking status | ||||||
| Never smoker | 1.0 | ref | 1.0 | ref | 1.0 | ref |
| Former smoker | 0.88 | 0.66 to 1.18 | 1.06 | 0.69 to 1.63 | 0.98 | 0.51 to 1.89 |
| Current smoker | 0.93 | 0.63 to 1.38 | 1.26 | 0.73 to 2.18 | 0.95 | 0.38 to 2.35 |
| Alcohol use, drinks per week | ||||||
| ≤ 7 | 1.0 | ref | 1.0 | ref | 1.0 | ref |
| 8 to ≤ 14 | 0.97 | 0.61 to 1.55 | 0.90 | 0.45 to 1.79 | 1.37 | 0.57 to 3.24 |
| ≥ 15 | 0.89 | 0.52 to 1.54 | 0.78 | 0.34 to 1.78 | 0.33 | 0.04 to 2.39 |
| Family history | ||||||
| None | 1.0 | ref | 1.0 | ref | 1.0 | ref |
| Breast only | 0.84 | 0.58 to 1.22 | 0.89 | 0.53 to 1.51 | 1.15 | 0.55 to 2.40 |
| Ovarian only | 0.69 | 0.34 to 1.40 | 0.73 | 0.27 to 1.98 | 0.47 | 0.06 to 3.40 |
| Breast and ovarian | 3.24 | 1.19 to 8.78 | 4.22 | 1.02 to 17.41 | 13.87 | 1.81 to 105.96 |
| Menopausal status | ||||||
| Premenopausal | 1.0 | ref | 1.0 | ref | 1.0 | ref |
| Postmenopausal | 1.15 | 0.75 to 1.78 | 1.12 | 0.60 to 2.08 | 1.10 | 0.44 to 2.78 |
| Stagec | ||||||
| I | 1.0 | ref | 1.0 | ref | 1.0 | ref |
| II | 3.45 | 1.70 to 7.0 | 3.09 | 1.25 to 7.63 | 2.15 | 0.51 to 9.07 |
| III | 12.59 | 7.38 to 21.50 | 12.27 | 6.31 to 23.87 | 14.77 | 5.74 to 38.02 |
| IV | 16.10 | 8.41 to 30.82 | 11.00 | 4.14 to 29.21 | 4.21 | 0.49 to 36.47 |
| Primary site | ||||||
| Ovarian | 1.0 | ref | 1.0 | ref | 1.0 | ref |
| Peritoneal | 1.70 | 1.11 to 2.61 | 2.72 | 1.53 to 4.85 | 5.32 | 2.32 to 12.19 |
| Fallopian | 0.78 | 0.45 to 1.38 | 0.94 | 0.44 to 2.05 | 0.65 | 0.15 to 2.69 |
| Could not be assessed | 1.64 | 0.60 to 4.47 | 1.06 | 0.15 to 7.73 | 3.00 | 0.39 to 23.04 |
| Grade | ||||||
| Well differentiated | 1.0 | ref | 1.0 | ref | 1.0 | ref |
| Moderately differentiated | 3.37 | 1.52 to 7.44 | 2.52 | 0.96 to 6.61 | 2.23 | 0.47 to 10.60 |
| Poorly differentiated | 5.06 | 2.36 to 10.85 | 3.92 | 1.57 to 9.79 | 4.98 | 1.17 to 21.15 |
| Could not be assessed | 3.41 | 1.41 to 8.24 | 2.12 | 0.67 to 6.70 | 3.31 | 0.60 to 18.10 |
| Histology | ||||||
| Serous | 1.0 | ref | 1.0 | ref | 1.0 | ref |
| Endometrioid | 0.22 | 0.13 to 0.37 | 0.23 | 0.12 to 0.44 | 0.13 | 0.04 to 0.42 |
| Mucinous | 0.04 | 0.01 to 0.28 | — | — | — | — |
| Clear cell | 0.21 | 0.10 to 0.44 | 0.30 | 0.13 to 0.70 | 0.19 | 0.05 to 0.80 |
| Brenner | 0.36 | 0.09 to 1.47 | 0.32 | 0.04 to 2.31 | 0.59 | 0.08 to 4.36 |
| MMT | 0.44 | 0.16 to 1.20 | 0.40 | 0.10 to 1.62 | 0.39 | 0.05 to 2.86 |
| Mixed | 0.46 | 0.28 to 0.75 | 0.37 | 0.18 to 0.77 | 0.38 | 0.13 to 1.08 |
| Otherd | 1.17 | 0.28 to 4.86 | 1.48 | 0.19 to 11.27 | — | — |
| Could not be assessed | 0.87 | 0.44 to 1.70 | 0.39 | 0.10 to 1.60 | 0.87 | 0.21 to 3.66 |
| Pretreatment CA-125 | ||||||
| ≤ 35 U/mL | 1.0 | ref | 1.0 | ref | 1.0 | ref |
| > 35 U/mL | 2.92 | 1.75 to 4.89 | 2.35 | 1.21 to 4.58 | 2.27 | 0.88 to 5.87 |
| Could not be assessed | 2.93 | 1.64 to 5.22 | 2.96 | 1.40 to 6.26 | 2.24 | 0.71 to 7.07 |
| Pretreatment pleural effusion | ||||||
| No | 1.0 | ref | 1.0 | ref | 1.0 | ref |
| Yes | 1.98 | 1.22 to 3.24 | 3.66 | 1.53 to 8.75 | 17.02 | 2.04 to 141.74 |
| Could not be assessed | 0.97 | 0.66 to 1.44 | 1.91 | 0.92 to 3.96 | 7.64 | 1.04 to 55.97 |
| Cytology of ascites/pelvic washings | ||||||
| Negative | 1.0 | ref | 1.0 | ref | 1.0 | ref |
| Positive | 5.49 | 3.72 to 8.09 | 5.58 | 3.33 to 9.36 | 4.67 | 2.20 to 9.91 |
| Atypical | 3.20 | 1.52 to 6.70 | 2.91 | 0.99 to 8.56 | 3.09 | 0.67 to 14.15 |
| Could not be assessed | 3.52 | 2.21 to 5.59 | 3.02 | 1.59 to 5.77 | 3.68 | 1.53 to 8.84 |
| Pretreatment ascites | ||||||
| No | 1.0 | ref | 1.0 | ref | 1.0 | ref |
| Yes | 2.85 | 2.08 to 3.89 | 2.77 | 1.79 to 4.29 | 2.97 | 1.52 to 5.81 |
| Could not be assessed | 1.10 | 0.27 to 4.50 | 2.00 | 0.48 to 8.41 | 2.54 | 0.33 to 19.73 |
| Lymph node involvement | ||||||
| No palpable nodes, no biopsies | 1.0 | ref | 1.0 | ref | 1.0 | ref |
| Palpable nodes, no biopsies | 1.48 | 0.64 to 3.38 | 5.39 | 2.10 to 13.82 | 6.53 | 0.84 to 50.92 |
| Biopsies negative | 0.30 | 0.22 to 0.42 | 0.36 | 0.23 to 0.58 | 0.43 | 0.21 to 0.88 |
| Biopsies positive | 1.16 | 0.82 to 1.64 | 1.41 | 0.84 to 2.37 | 2.06 | 0.93 to 4.56 |
| Could not be assessed | 0.59 | 0.19 to 1.87 | — | — | — | — |
| Synchronous primary tumor | ||||||
| No | 1.0 | ref | 1.0 | ref | 1.0 | ref |
| Yes, endometrial | 0.42 | 0.17 to 1.01 | 0.16 | 0.02 to 1.18 | 0.36 | 0.05 to 2.61 |
| Yes, othere | 1.20 | 0.44 to 3.25 | 1.61 | 0.39 to 6.66 | — | — |
| Residual disease after cytoreductive surgeryf | ||||||
| No | 1.0 | ref | 1.0 | ref | 1.0 | ref |
| Yes | 4.82 | 3.59 to 6.48 | 5.02 | 3.29 to 7.66 | 4.54 | 2.34 to 8.78 |
| Could not be assessed | 5.31 | 3.39 to 8.32 | 6.99 | 3.73 to 13.10 | 9.71 | 3.61 to 26.09 |
| Size of residual disease after cytoreductive surgery, cmf | ||||||
| No residual disease | 1.0 | ref | 1.0 | ref | 1.0 | ref |
| 0.1 to < 1.0 | 4.41 | 3.12 to 6.22 | 5.23 | 3.21 to 8.5 | 4.43 | 1.96 to 10.04 |
| 1.0 to < 2.0 | 5.62 | 3.50 to 9.02 | 6.86 | 3.32 to 14.19 | 11.12 | 3.77 to 32.84 |
| ≥ 2.0 | 6.72 | 3.85 to 11.75 | 1.40 | 0.19 to 10.18 | 2.76 | 0.37 to 20.51 |
| Could Not Be Assessed | 4.89 | 3.37 to 7.11 | 5.87 | 3.47 to 9.92 | 5.54 | 2.36 to 12.99 |
| Debulking at cytoreductive surgeryg | ||||||
| Optimal | 1.0 | ref | 1.0 | ref | 1.0 | ref |
| Suboptimal | 3.77 | 2.72 to 5.22 | 3.40 | 2.01 to 5.77 | 4.60 | 2.02 to 10.48 |
| Received neoadjuvant chemotherapy | 2.99 | 1.89 to 4.72 | 1.31 | 0.48 to 3.58 | 2.50 | 0.76 to 8.20 |
| No primary surgery performed | 1.70 | 0.42 to 6.95 | — | — | — | — |
| Unknown | 3.76 | 1.91 to 7.40 | 4.27 | 1.56 to 11.70 | 3.60 | 0.49 to 26.39 |
| Platinum chemotherapy, no. of cyclesh,i | ||||||
| No | 1.0 | ref | 1.0 | ref | 1.0 | ref |
| 0 to ≤ 3 | 2.21 | 0.63 to 7.85 | 3.80 | 0.74 to 19.59 | 2.33 | 0.39 to 13.93 |
| 3 to ≤ 6 | 5.66 | 2.09 to 15.31 | 6.29 | 1.54 to 25.70 | 2.38 | 0.56 to 10.11 |
| > 6 | 9.96 | 3.64 to 27.24 | 10.72 | 2.57 to 44.76 | 6.59 | 1.51 to 28.67 |
| Yes, number of cycles unknown | 2.46 | 0.27 to 22.02 | 5.14 | 0.46 to 56.88 | — | — |
| Taxane chemotherapy, no. of cycles)h,j | ||||||
| No | 1.0 | ref | 1.0 | ref | 1.0 | ref |
| 0 to ≤ 3 | 1.50 | 0.54 to 4.14 | 1.34 | 0.36 to 4.99 | 1.66 | 0.33 to 8.23 |
| 3 to ≤ 6 | 3.52 | 1.72 to 7.19 | 2.96 | 1.19 to 7.36 | 2.15 | 0.65 to 7.14 |
| > 6 | 6.82 | 3.29 to 14.14 | 6.03 | 2.35 to 15.47 | 4.49 | 1.27 to 15.92 |
| Yes, number of cycles unknown | 1.84 | 0.39 to 8.66 | 2.95 | 0.57 to 15.23 | 2.54 | 0.26 to 24.67 |
| Other chemotherapy, no. of cyclesh,k | ||||||
| No | 1.0 | ref | 1.0 | ref | 1.0 | ref |
| 0 to ≤ 3 | 1.01 | 0.32 to 3.16 | 1.53 | 0.38 to 6.24 | — | — |
| 3 to ≤ 6 | 1.75 | 1.03 to 2.98 | 2.59 | 1.25 to 5.36 | 3.90 | 1.38 to 11.00 |
| > 6 | 2.29 | 1.39 to 3.78 | 2.13 | 0.93 to 4.88 | 4.34 | 1.53 to 12.31 |
| Yes, number of cycles unknown | 4.66 | 1.72 to 12.64 | 18.13 | 4.28 to 76.72 | — | — |
| Maintenance chemotherapy | ||||||
| No | 1.0 | ref | 1.0 | ref | 1.0 | ref |
| Yes | 1.79 | 1.21 to 2.64 | 3.51 | 2.15 to 5.71 | 3.43 | 1.51 to 7.78 |
| Number of chemotherapy cycles before normalization of CA-125 | ||||||
| Normalized without/prior to chemotherapy | 1.0 | ref | 1.0 | ref | 1.0 | ref |
| 1 to < 3 | 2.56 | 1.71 to 3.84 | 1.80 | 1.06 to 3.05 | 2.29 | 1.08 to 4.85 |
| 3 to < 6 | 5.59 | 3.72 to 8.39 | 4.33 | 2.50 to 7.52 | 4.23 | 1.78 to 10.08 |
| ≥ 6 | 5.19 | 3.19 to 8.43 | 4.51 | 2.27 to 8.96 | 2.17 | 0.48 to 9.72 |
| Could not be assessed | 2.94 | 1.75 to 4.95 | 2.26 | 1.12 to 4.58 | 1.91 | 0.61 to 5.91 |
| Persistent disease after primary treatment | ||||||
| No | 1.0 | ref | 1.0 | ref | 1.0 | ref |
| Yes | 2.96 | 1.57 to 5.60 | 0.84 | 0.12 to 6.0 | — | — |
Abbreviations: HR, hazard ratio; MMT, mixed Mullerian tumor; ref, reference.
Landmark method was used for years 1 and 2. Please see Tables 1 and 2 for number of participants in the different categories.
HRs were calculated using Cox regression models adjusted for current age (continuous) and disease-free survival was measured from the specified time point.
One patient was missing stage information because she never had staging or cytoreductive surgeries and was never formally staged by oncologist.
Includes one micropapillary serous, one adenosquamous, one papillary serous with multiple psammoma bodies.
Includes one of each of the following synchronous cancers: fallopian tube, granulosa cell tumor of the ovary, recurrent breast, GI stromal, skin, and appendiceal.
Excludes three patients that did not have cytoreductive surgery.
Patients were considered to be optimally debulked if their disease was <1 cm or their surgeon/oncologist declared them to be optimally debulked at the conclusion of their cytreductive surgery.
Includes neoadjuvant, adjuvant and maintenance chemotherapies received as well as any chemotherapy received for persistent disease.
Includes carboplatin, cisplatin, oxaliplatin, and abraxane.
Includes taxol, taxotere, and xyotax.
Includes avastin, doxil, topotecan, gemzar, cytoxan, interferon, mytomycin, erbitux, ifosphomaide, catumaxomab, and ovarex. Many of these other chemotherapies were given as part of a clinical trial and in some cases it was unclear whether participants received placebo or the active agent; cases that were reported to have gotten the placebo were considered to have received no chemotherapy.
DISCUSSION
To our knowledge, this is the first study to assess conditional DFS among patients with OC. Our findings demonstrate that DFS estimates improve dramatically for patients with OC who have already achieved a period of remission and that conditional DFS is a more relevant measure of prognosis for these women. Generally, we observed that DFS improved most for patients who initially had the poorest prognosis. Consistent with results from studies examining conditional OS among patients with OC,3–6 we found that the initial differences in DFS at time of remission between age, stage, histology, and grade groups diminished over time. This suggests that the prognostic importance of these factors decreases as time in remission increases.
At baseline, we observed significant associations between a large number of the evaluated patient characteristics and risk of recurrence. Our results are in line with previous studies that established these factors as predictors of overall or disease-free survival. The significant characteristics included: family history,18 stage,19,20 primary site,21 grade,19,22,23 histology,20,21–24 pretreatment CA-125,25,26 pretreatment pleural effusion,27,28 cytology of ascites/pelvic washings,29,30 pretreatment ascites,20 lymph node involvement,23,31–33 residual disease and debulking status after cytoreductive surgery,20,22,24,34 number of chemotherapy cycles before normalization of CA-125,35–37 and total number of platinum, taxane, and other chemotherapy cycles received.20,23,38,39 While previous studies have provided conflicting results regarding the role of maintenance chemotherapy in improving overall survival,40,41 risk of recurrence was significantly increased for patients receiving maintenance chemotherapy in our population. It is important to note that maintenance chemotherapy is not considered standard of care for patients with OC and it is possible that in particular women who were at high risk of recurrence were more likely to be prescribed maintenance chemotherapy. Risk of recurrence was also significantly increased among those with persistent disease after primary treatment. However, the number of women with persistent disease after primary treatment was small; most HOPE patients with persistent disease after completion of primary therapy never achieved remission and were therefore excluded from this study. We also evaluated the effect of patient characteristics on subsequent DFS among women who had already been in remission for 1 or 2 years. In these analyses, all factors that were predictive of prognosis at baseline with the exception of pretreatment CA-125 and persistent disease after primary treatment remained significant. This is consistent with the results presented in Figure 2 where the difference in 3-year conditional DFS estimates between the various stage, histology. and grade groups was still large in the first 2 years and suggests that at least in the first 2 years after achieving remission these factors are still of prognostic value.
Follow-up care after treatment for OC is a controversial topic with disagreement over whether increased surveillance for recurrent disease effectively improves OS.18–20,42 Although monitoring of CA-125 levels for the early detection of recurrent disease has not resulted in meaningful improvements in OS,21 a study by Oskay-Oezcelik et al43 found that the majority of patients believe routine CA-125 testing was the most important factor in determining their cancer outcomes. This suggests that physician-patient communication regarding the goals and efficacy of follow-up care may be insufficient. Improved measures of recurrence risk, such as conditional DFS estimates, may help clinicians provide more accurate prognostic information to patients. Risk assessment tools that take into account time already in remission should be developed to help inform personalized follow-up treatment plans.
The extensive follow-up information collected from our participants allowed us to estimate 3-year conditional DFS estimates up to 5 years after achieving remission and to examine the impact of many different patient characteristics. Use of the landmark approach16,17 enabled us to explore whether patient characteristics were predictive of subsequent DFS at years 1 and 2 of remission. Our study was further strengthened by a short recruitment period, which limits the possibility that OC outcomes were influenced by changes in standard of care. Although our study included 404 participants in total, the small size of certain subgroups resulted in large CIs and some associations with risk of recurrence may not have been detected due to insufficient power. In addition, as more time elapsed from the date of remission, the number of women in the study, and thus in the subgroups, decreased because they developed a recurrence, died, or became lost to further follow-up, and it is possible that some of the trends observed were due to small patient numbers. Demographic and lifestyle characteristics were collected at time of enrollment and, therefore, do not necessarily reflect the status of the participants throughout treatment and follow-up. In addition, women included in this study were predominantly white and the majority had completed at least some post–high school education and a yearly income of at least $25,000, which does not reflect the general US population and hence may limit the generalizability of our results.
To conclude, DFS estimates for patients with OC improved dramatically over time, in particular among patients with poorer initial prognoses. If confirmed by other studies, future research should focus on the development and validation of prognostic tools that take time in remission into account. More accurate information about risk of recurrence will allow patients and clinicians to make better informed decisions regarding follow-up care after cancer treatment and may also improve quality of life by ameliorating patients' fear of recurrence.
Appendix
Fig A1.

Traditional disease-free survival curves (Kaplan-Meier curves), stratified by age at remission (A; log-rank test, P = .01) and stage (B; log-rank test, P < .01).
Footnotes
Listen to the podcast by Dr Iasonos at www.jco.org/podcasts
Supported by National Institutes of Health Grant Nos R01 CA095023, R01 CA126841, P30 CA047904, and R25 CA057703.
Presented in part at the American Association for Cancer Research Annual Meeting 2014, April 5-9, 2014, San Diego, CA (abstract LB-273).
Authors' disclosures of potential conflicts of interest are found in the article online at www.jco.org. Author contributions are found at the end of this article.
AUTHORS' DISCLOSURES OF POTENTIAL CONFLICTS OF INTEREST
Disclosures provided by the authors are available with this article at www.jco.org.
AUTHOR CONTRIBUTIONS
Conception and design: Michelle Kurta, Robert Edwards, Francesmary Modugno, Brenda Diergaarde
Collection and assembly of data: Michelle Kurta, Robert Edwards, Kirsten Moysich, Kathleen McDonough, Francesmary Modugno, Clareann Bunker, Roberta Ness, Brenda Diergaarde
Data analysis and interpretation: Michelle Kurta, Robert Edwards, Marnie Bertolet, Joel Weissfeld, Janet Catov, Brenda Diergaarde
Manuscript writing: All authors
Final approval of manuscript: All authors
AUTHORS' DISCLOSURES OF POTENTIAL CONFLICTS OF INTEREST
Prognosis and Conditional Disease-Free Survival Among Patients With Ovarian Cancer
The following represents disclosure information provided by authors of this manuscript. All relationships are considered compensated. Relationships are self-held unless noted. I = Immediate Family Member, Inst = My Institution. Relationships may not relate to the subject matter of this manuscript. For more information about ASCO's conflict of interest policy, please refer to www.asco.org/rwc or jco.ascopubs.org/site/ifc.
Michelle Kurta
No relationship to disclose
Robert Edwards
No relationship to disclose
Kirsten Moysich
No relationship to disclose
Kathleen McDonough
No relationship to disclose
Marnie Bertolet
No relationship to disclose
Joel Weissfeld
No relationship to disclose
Janet Catov
No relationship to disclose
Francesmary Modugno
No relationship to disclose
Clareann Bunker
No relationship to disclose
Roberta Ness
No relationship to disclose
Brenda Diergaarde
No relationship to disclose
REFERENCES
- 1.Siegel R, Naishadham D, Jemal A. Cancer statistics, 2013. CA Cancer J Clin. 2013;63:11–30. doi: 10.3322/caac.21166. [DOI] [PubMed] [Google Scholar]
- 2.Howlader N, Noone AM, Krapcho M, et al. Bethesda, MD: National Cancer Institute; 1975-2010. SEER Cancer Statistics Review. http://seer.cancer.gov/csr/1975_2010/ [Google Scholar]
- 3.Choi M, Fuller CD, Thomas CR, Jr, et al. Conditional survival in ovarian cancer: Results from the SEER dataset 1988-2001. Gynecol Oncol. 2008;109:203–209. doi: 10.1016/j.ygyno.2008.01.033. [DOI] [PubMed] [Google Scholar]
- 4.Merrill RM, Hunter BD. Conditional survival among cancer patients in the United States. Oncologist. 2010;15:873–882. doi: 10.1634/theoncologist.2009-0211. [DOI] [PMC free article] [PubMed] [Google Scholar]
- 5.Gloeckler Ries LA, Reichman ME, et al. Cancer survival and incidence from the Surveillance, Epidemiology, and End Results (SEER) program. Oncologist. 2003;8:541–552. doi: 10.1634/theoncologist.8-6-541. [DOI] [PubMed] [Google Scholar]
- 6.Janssen-Heijnen ML, Gondos A, Bray F, et al. Clinical relevance of conditional survival of cancer patients in Europe: Age-specific analyses of 13 cancers. J Clin Oncol. 2010;28:2520–2528. doi: 10.1200/JCO.2009.25.9697. [DOI] [PubMed] [Google Scholar]
- 7.Miller RE, Rustin GJ. How to follow-up patients with epithelial ovarian cancer. Curr Opin Oncol. 2010;22:498–502. doi: 10.1097/CCO.0b013e32833ae8b6. [DOI] [PubMed] [Google Scholar]
- 8.Gadducci A, Fuso L, Cosio S, et al. Are surveillance procedures of clinical benefit for patients treated for ovarian cancer? A retrospective Italian multicentric study. Int J Gynecol Cancer. 2009;19:367–374. doi: 10.1111/IGC.0b013e3181a1cc02. [DOI] [PubMed] [Google Scholar]
- 9.Tanner EJ, Chi DS, Eisenhauer EL, et al. Surveillance for the detection of recurrent ovarian cancer: Survival impact or lead-time bias? Gynecol Oncol. 2010;117:336–340. doi: 10.1016/j.ygyno.2010.01.014. [DOI] [PubMed] [Google Scholar]
- 10.Rustin GJ, van der Burg ME, Griffin CL, et al. Early versus delayed treatment of relapsed ovarian cancer (MRC OV05/EORTC 55955): A randomised trial. Lancet. 2010;376:1155–1163. doi: 10.1016/S0140-6736(10)61268-8. [DOI] [PubMed] [Google Scholar]
- 11.Ness RB, Dodge RC, Edwards RP, et al. Contraception methods, beyond oral contraceptives and tubal ligation, and risk of ovarian cancer. Ann Epidemiol. 2011;21:188–196. doi: 10.1016/j.annepidem.2010.10.002. [DOI] [PMC free article] [PubMed] [Google Scholar]
- 12.Kurta ML, Moysich KB, Weissfeld JL, et al. Use of fertility drugs and risk of ovarian cancer: Results from a U.S.-based case-control study. Cancer Epidemiol Biomarkers Prev. 2012;21:1282–1292. doi: 10.1158/1055-9965.EPI-12-0426. [DOI] [PMC free article] [PubMed] [Google Scholar]
- 13.Henson DE, Ries LA. On the estimation of survival. Semin Surg Oncol. 1994;10:2–6. doi: 10.1002/ssu.2980100103. [DOI] [PubMed] [Google Scholar]
- 14.Zabor EC, Gonen M, Chapman PB, et al. Dynamic prognostication using conditional survival estimates. Cancer. 2013;119:3589–3592. doi: 10.1002/cncr.28273. [DOI] [PubMed] [Google Scholar]
- 15.Zamboni BA, Yothers G, Choi M, et al. Conditional survival and the choice of conditioning set for patients with colon cancer: An analysis of NSABP trials C-03 through C-07. J Clin Oncol. 2010;28:2544–2548. doi: 10.1200/JCO.2009.23.0573. [DOI] [PMC free article] [PubMed] [Google Scholar]
- 16.Anderson JR, Cain KC, Gelber RD. Analysis of survival by tumor response. J Clin Oncol. 1983;1:710–719. doi: 10.1200/JCO.1983.1.11.710. [DOI] [PubMed] [Google Scholar]
- 17.Anderson JR, Cain KC, Gelber RD. Analysis of survival by tumor response and other comparisons of time-to-event by outcome variables. J Clin Oncol. 2008;26:3913–3915. doi: 10.1200/JCO.2008.16.1000. [DOI] [PubMed] [Google Scholar]
- 18.Ji J, Försti A, Sundquist J, et al. Survival in ovarian cancer patients by histology and family history. Acta Oncol. 2008;47:1133–1139. doi: 10.1080/02841860701784544. [DOI] [PubMed] [Google Scholar]
- 19.Rubin SC, Randall TC, Armstrong KA, et al. Ten-year follow-up of ovarian cancer patients after second-look laparotomy with negative findings. Obstet Gynecol. 1999;93:21–24. doi: 10.1016/s0029-7844(98)00334-2. [DOI] [PubMed] [Google Scholar]
- 20.Omura GA, Brady MF, Homesley HD, et al. Long-term follow-up and prognostic factor analysis in advanced ovarian carcinoma: The Gynecologic Oncology Group experience. J Clin Oncol. 1991;9:1138–1150. doi: 10.1200/JCO.1991.9.7.1138. [DOI] [PubMed] [Google Scholar]
- 21.Halperin R, Zehavi S, Langer R, et al. Primary peritoneal serous papillary carcinoma: A new epidemiologic trend? A matched-case comparison with ovarian serous papillary cancer. Int J Gynecol Cancer. 2001;11:403–408. doi: 10.1046/j.1525-1438.2001.01027.x. [DOI] [PubMed] [Google Scholar]
- 22.Hoskins WJ, Bundy BN, Thigpen JT, et al. The influence of cytoreductive surgery on recurrence-free interval and survival in small-volume stage III epithelial ovarian cancer: A Gynecologic Oncology Group study. Gynecol Oncol. 1992;47:159–166. doi: 10.1016/0090-8258(92)90100-w. [DOI] [PubMed] [Google Scholar]
- 23.Marszalek A, Alran S, Scholl S, et al. Outcome in advanced ovarian cancer following an appropriate and comprehensive effort at upfront cytoreduction: A twenty-year experience in a single cancer institute. Int J Surg Oncol. 2010;2010:214919. doi: 10.1155/2010/214919. [DOI] [PMC free article] [PubMed] [Google Scholar]
- 24.Winter WE, 3rd, Maxwell GL, Tian C, et al. Prognostic factors for stage III epithelial ovarian cancer: A Gynecologic Oncology Group Study. J Clin Oncol. 2007;25:3621–3627. doi: 10.1200/JCO.2006.10.2517. [DOI] [PubMed] [Google Scholar]
- 25.Zorn KK, Tian C, McGuire WP, et al. The prognostic value of pretreatment CA 125 in patients with advanced ovarian carcinoma: A Gynecologic Oncology Group study. Cancer. 2009;115:1028–1035. doi: 10.1002/cncr.24084. [DOI] [PMC free article] [PubMed] [Google Scholar]
- 26.Markman M, Liu PY, Rothenberg ML, et al. Pretreatment CA-125 and risk of relapse in advanced ovarian cancer. J Clin Oncol. 2006;24:1454–1458. doi: 10.1200/JCO.2005.04.7373. [DOI] [PubMed] [Google Scholar]
- 27.Eitan R, Levine DA, Abu-Rustum N, et al. The clinical significance of malignant pleural effusions in patients with optimally debulked ovarian carcinoma. Cancer. 2005;103:1397–1401. doi: 10.1002/cncr.20920. [DOI] [PubMed] [Google Scholar]
- 28.Mironov O, Ishill NM, Mironov S, et al. Pleural effusion detected at CT prior to primary cytoreduction for stage III or IV ovarian carcinoma: Effect on survival. Radiology. 2011;258:776–784. doi: 10.1148/radiol.10100162. [DOI] [PMC free article] [PubMed] [Google Scholar]
- 29.Zuna RE, Behrens A. Peritoneal washing cytology in gynecologic cancers: Long-term follow-up of 355 patients. J Natl Cancer Inst. 1996;88:980–987. doi: 10.1093/jnci/88.14.980. [DOI] [PubMed] [Google Scholar]
- 30.Brun JL, Feyler A, Chene G, et al. Long-term results and prognostic factors in patients with epithelial ovarian cancer. Gynecol Oncol. 2000;78:21–27. doi: 10.1006/gyno.2000.5805. [DOI] [PubMed] [Google Scholar]
- 31.Burghardt E, Girardi F, Lahousen M, et al. Patterns of pelvic and paraaortic lymph node involvement in ovarian cancer. Gynecol Oncol. 1991;40:103–106. doi: 10.1016/0090-8258(91)90099-q. [DOI] [PubMed] [Google Scholar]
- 32.di Re F, Baiocchi G, Fontanelli R, et al. Systematic pelvic and paraaortic lymphadenectomy for advanced ovarian cancer: Prognostic significance of node metastases. Gynecol Oncol. 1996;62:360–365. doi: 10.1006/gyno.1996.0249. [DOI] [PubMed] [Google Scholar]
- 33.Panici PB, Maggioni A, Hacker N, et al. Systematic aortic and pelvic lymphadenectomy versus resection of bulky nodes only in optimally debulked advanced ovarian cancer: A randomized clinical trial. J Natl Cancer Inst. 2005;97:560–566. doi: 10.1093/jnci/dji102. [DOI] [PubMed] [Google Scholar]
- 34.Gerestein CG, Eijkemans MJ, de Jong D, et al. The prediction of progression-free and overall survival in women with an advanced stage of epithelial ovarian carcinoma. BJOG. 2009;116:372–380. doi: 10.1111/j.1471-0528.2008.02033.x. [DOI] [PubMed] [Google Scholar]
- 35.Gupta D, Lis CG. Role of CA125 in predicting ovarian cancer survival: A review of the epidemiological literature. J Ovarian Res. 2009;2:13. doi: 10.1186/1757-2215-2-13. [DOI] [PMC free article] [PubMed] [Google Scholar]
- 36.Skaznik-Wikiel ME, Sukumvanich P, Beriwal S, et al. Possible use of CA-125 level normalization after the third chemotherapy cycle in deciding on chemotherapy regimen in patients with epithelial ovarian cancer: Brief report. Int J Gynecol Cancer. 2011;21:1013–1017. doi: 10.1097/IGC.0b013e31821ce903. [DOI] [PubMed] [Google Scholar]
- 37.van Dalen A, Favier J, Burges A, et al. Prognostic significance of CA 125 and TPS levels after 3 chemotherapy courses in ovarian cancer patients. Gynecol Oncol. 2000;79:444–450. doi: 10.1006/gyno.2000.5982. [DOI] [PubMed] [Google Scholar]
- 38.McGuire WP, Hoskins WJ, Brady MF, et al. Cyclophosphamide and cisplatin compared with paclitaxel and cisplatin in patients with stage III and stage IV ovarian cancer. N Engl J Med. 1996;334:1–6. doi: 10.1056/NEJM199601043340101. [DOI] [PubMed] [Google Scholar]
- 39.Burger RA, Brady MF, Bookman MA, et al. Incorporation of bevacizumab in the primary treatment of ovarian cancer. N Engl J Med. 2011;365:2473–2483. doi: 10.1056/NEJMoa1104390. [DOI] [PubMed] [Google Scholar]
- 40.Abaid LN, Goldstein BH, Micha JP, et al. Improved overall survival with 12 cycles of single-agent paclitaxel maintenance therapy following a complete response to induction chemotherapy in advanced ovarian carcinoma. Oncology. 2010;78:389–393. doi: 10.1159/000320579. [DOI] [PubMed] [Google Scholar]
- 41.Markman M, Liu PY, Wilczynski S, et al. Phase III randomized trial of 12 versus 3 months of maintenance paclitaxel in patients with advanced ovarian cancer after complete response to platinum and paclitaxel-based chemotherapy: A Southwest Oncology Group and Gynecologic Oncology Group trial. J Clin Oncol. 2003;21:2460–2465. doi: 10.1200/JCO.2003.07.013. [DOI] [PubMed] [Google Scholar]
- 42.Rustin GJ. Follow-up with CA125 after primary therapy of advanced ovarian cancer has major implications for treatment outcome and trial performances and should not be routinely performed. Ann Oncol. 2011;22(suppl 8):viii45–viii8. doi: 10.1093/annonc/mdr471. [DOI] [PubMed] [Google Scholar]
- 43.Oskay-Oezcelik G, du Bois A, Fasching PA, et al. What do patients think about CA-125 monitoring in the follow-up? Results from a multicenter trial in 1,060 patients with ovarian cancer. J Clin Oncol. 2009;27(suppl 15):282s. abstr 5522. [Google Scholar]