

Abstract
Inherently, confined animal farming operations (CAFOs) and other intense fecal-rich environments are potential sources of groundwater contamination by enteric pathogens. The ubiquity of microbial matter poses unique technical challenges in addition to economic constraints when sampling wells in such environments. In this paper, we evaluate a groundwater sampling protocol that relies on extended purging with a portable submersible stainless steel pump and Teflon® tubing as an alternative to equipment sterilization. The protocol allows for collecting a large number of samples quickly, relatively inexpensively, and under field conditions with limited access to capacity for sterilizing equipment. The protocol is tested on CAFO monitoring wells and considers three cross-contamination sources: equipment, wellbore, and ambient air. For the assessment, we use Enterococcus, a ubiquitous fecal indicator bacterium (FIB), in laboratory and field tests with spiked and blank samples, and in an extensive, multi-year field sampling campaign on 17 wells within 2 CAFOs. The assessment shows that extended purging can successfully control for equipment cross-contamination, but also controls for significant contamination of the well-head, within the well casing and within the immediate aquifer vicinity of the well-screen. Importantly, our tests further indicate that Enterococcus is frequently entrained in water samples when exposed to ambient air at a CAFO during sample collection. Wellbore and air contamination pose separate challenges in the design of groundwater monitoring strategies on CAFOs that are not addressed by equipment sterilization, but require adequate QA/QC procedures and can be addressed by the proposed sampling strategy.
Introduction
Fecal contamination from animal agriculture can affect human health through food and water, including groundwater. Livestock may excrete pathogens such as Salmonella enterica, Escherichia coli O157:H7, and Cryptosporidium parvum. Manure has been implicated in outbreaks of infectious disease, for example, in Carrollton, Georgia in 1989 (Cryptosporidium), in Washington County, New York in 1999, and in Walkerton, Ontario in 2000 (Campylobacter, E. coli O157:H7) (Solo-Gabriele and Neumeister 1996; Public Health Dispatch 1999; Valcour et al., 2002). Enteric microbes, including pathogens excreted by infected livestock may reach groundwater via surface runoff entrainment of feces deposited on the ground and other surfaces and subsequent leaching of runoff, via irrigation with liquid effluents of manure, or directly from seepage of manure storage facilities.
Groundwater monitoring for fecal indicator bacteria (FIBs) and pathogens is an important step toward assessing microbial contamination risk in intensive fecal-rich environments (IFREs) such as confined animal farming operations (CAFOs). Feces, containing very high concentrations of microbial matter (bacteria can make up over half of the fecal mass; Stephen and Cummings 1980), are dispersed throughout the CAFO environment, including floors and walls of animal corrals and pens, solid and liquid manure storage areas, manure transportation pathways, and on and nearby all animal traffic areas (Lewis et al., 2005; Beck et al., 2007; Edrington et al., 2009; Purdy et al., 2010; Toth et al., 2011; Watson et al., 2012). Cropland that is surrounding CAFOs often receives liquid or solid manure by way of waste disposal or to aid nutrient management, thus extending the geographical area of high fecal loading. On small farms, the area affected by significant fecal deposition may be one-quarter hectare or less. Animal yards and manure storage facilities at larger facilities, especially modern beef cattle and dairy farms may occupy tens of hectares, often surrounded by additional hundreds of hectares of cropland also treated with manure (Harter et al., 2002). Similar IFREs are encountered in rural and sometimes even urban communities of developing countries, where high population density, open defecation, sometimes combined with the presence of significant large animal populations are juxtaposed with inadequate sanitation (World Health Organization [WHO] 2013a).
Sampling groundwater for microbial analyses in IFREs poses multiple challenges. The ubiquity of highly dense microbial populations on the land surface and potentially in surficial soil, in groundwater, and in the ambient air environment provides many potential pathways for cross-contamination of well water samples. Yet, microbial groundwater sampling procedures have rarely been evaluated in IFREs. Also, IFRE-associated land owners and stakeholders (in developed countries and in developing countries) do not necessarily have the technical, economic, or political capacity to construct and maintain proper monitoring wells and to employ expensive water quality sampling procedures designed typically for use in industrial or urban, modern wastewater processing facilities or public supply wells of communities in Europe or the United States (Crane 2006). Yet, microbial water contamination in these areas often poses by far the greatest health risk to resident populations (World Health Organization [WHO] 2013a, 2013b). Crane (2006) and Crane and Silliman (2009) suggest the need for developing simplified, yet functional sampling methods that do not rely, for example, on expensive sterilization of sampling equipment.
Current protocols for microbial sampling of groundwater are primarily designed to prevent cross-contamination due to carryover in equipment, and to circumvent sampling stagnant wellbore water not representative of the aquifer environment. The U.S. EPA recommends sterilization by autoclaving of all sampling equipment prior to use (U.S. EPA 1975, 1977, 1978, 1985, 2011; Dunlap et al., 1977). Using traditional multiple volume purge method, the U.S. EPA suggests to remove three to five well volumes prior to sampling and to use field measurements of pH, turbidity, and dissolved oxygen (DO) concentration as chemical stabilization criteria (U.S. EPA 2011). The U.S. Geological Survey (USGS) also recommends to clean first and then sterilize all equipment for collection and analysis, preferably by autoclaving (Myers et al., 2007; USGS 2008). For non-autoclavable portable submersible pumps and portable pump tubing systems, sterilization by sodium hypochlorite solution followed by a treatment with sterile sodium thiosulfate, and sterile deionized or distilled water is recommended. When using a pump that cannot be disinfected, it is recommended to purge the well with the pump used for sampling to allow the pump and the tubing to be thoroughly flushed with aquifer water before sampling (USGS 2008). Examples of efforts to minimize cross-contamination between sampling wells include sterile bailers dedicated to each well (Chee-Sanford et al., 2001), washing the tubing attached to a peristaltic pump with DI water between samples (Powell et al., 2003), and cleaning the pump tubing with 70% ethanol between samples to prevent the well-to-well cross contamination (Anderson and Sobsey 2006).
Besides added cost and training needs, equipment sterilization may not address the potential for significant contamination from microbial contamination of the well head, well casing, well filter pack, or the aquifer in the immediate vicinity of the well due to the omnipresence of fecal matter and inadequate well construction. Significant differences may exist in the microbial compositions of standing water obtained from within a well pipe (unpurged sample) and water freshly obtained from the surrounding aquifer after purging (Roudnew et al., 2012). Purging in IFREs has been found to require a significantly higher volumes of water to be removed than the standard three wet well volumes (Knappett et al., 2010) suggesting the need for water sampling equipment capable of removing at least tens to hundreds of liters of water from a well prior to sampling. Finally, the presence of microbial matter in the ambient air immediately around the wellhead, for example in CAFOs during arid conditions (Wilson et al., 2002), provides additional pathways of potential cross-contamination of well water samples that cannot be controlled by either equipment sterilization or purging.
In this paper, we evaluate an alternate groundwater sampling protocol that does not rely on sterilization, but applies extended purging instead. Furthermore, the protocol can be used to simultaneously collect both, chemical and microbial water samples on CAFOs and similar IFREs. Specifically, this paper (1) investigates whether extended purging using a mobile pump-tubing system without sterilization can be used to avoid inter-sample FIB contamination between wells due to equipment contamination, (2) determines if extended purging can control wellbore or near-well FIB contamination, and (3) determines whether ambient air in IFREs is a potential source of FIB cross-contamination.
Materials and Methods
Overview
We implemented a suite of QA/QC procedures to evaluate the sampling protocol for proper equipment transport, sample collection, and equipment handling, and to identify the degree to which the three possible sources of FIB cross-contamination (equipment, well-bore, and ambient air) affect sampling results in IFREs. We also field-tested the methodology during a 4-year, 7-trip sampling campaign of up to 17 monitoring wells. All field testing was implemented within a freestall commercial dairy setting (a type of CAFO).
The sampling protocol was tested using Enterococcus, a highly prevalent and frequently detected FIB (Asholt et al., 2001). At our field sites we have found Enterococcus to be much more prevalent than E. coli (Li, unpublished data). Elsewhere, Enterococcus prevalence has been shown, in fine sandy aquifer sediments similar to our study site, to far outnumber the prevalence of other FIBs such as E. coli (Conn et al., 2011), although this may not apply to aquifers with much larger pore or fracture opening (e.g., coarse gravel, Page et al. [2012]). Testing the proposed protocol on a microorganism that has a high prevalence and concentration in our monitoring well network created an ideal research environment because the potential for FIB cross-contamination or other bias was anticipated to be much higher with Enterococcus than with other lower prevalent FIB options (e.g., E. coli, fecal coliforms).
Procedure and Pump Assembly for Microbial Field Sampling Without Sterilization
For all laboratory and field sampling, the same portable, submersible, variable speed, stainless steel Grundfos™ RediFlo2 pump with a diameter of 4.6 cm was used. The pump was assembled with a ball check-valve at the outlet of the pump housing that prevents backflow. It was attached to 76.2 m of PTFE (TEFLON™) lined polyethylene (TLPE) tubing on a portable hose wheel (REEL-EZ®). From the hose wheel, 2 m of TLPE sample tubing extends to allow for filling of sample containers.
Immediately prior to purging and sampling a well, the outside of the stainless steel submersible pump and of all TLPE tubing within 10 m of the pump were wiped with a clean cloth. The pump-tubing system was not otherwise sterilized externally or internally. The pump-tubing system was then lowered inside the PVC casing of a monitoring well to 2 to 4 m below the water table, just above or near the mid-point of the well-screen (see below). The inside of the pump-tubing system was purged with well water prior to collecting samples from the well. Constant flow rates (12 L/min) were used with no change in flow rate between purging and water sampling. For purging, discharge water from the pump-tubing system was routed through a flow through cell equipped with a YSI® 556 Multi-Parameter Water Quality sensor (pH, salinity, temperature, DO). Samples were obtained after water quality parameters stabilized (U.S. EPA 2011). For sampling, discharge was routed via tubing across a short (less than 30 cm) air gap into sterilized wide-mouth polypropylene carboys (10 L). During sample container filling, the discharge end of the TLPE tubing was maintained to be close, but not in contact with the sampling container.
For transport between sites, all sampling equipment was wrapped into plastic covers. Each morning and also immediately upon return from a sampling trip to our field staging area on the university campus in Davis, California, (every 2nd or 3rd day) all sampling equipment was rinsed and purged with 1% Alconox™ detergent (Fisher Scientific, http://www.fishersci.com, accessed May 27, 2014), followed by rinsing with approximately 400 L of tap water. Equipment was stored in a dry, indoor field equipment storage area. The same field equipment was typically in use for chemical water quality sampling from dairy monitoring wells for 2 to 10 days per campaign, up to six times per year.
Laboratory Spike and Purging Test
An assay was conducted in the laboratory to determine breakthrough of Enterococcus when using the pump and tubing assembly under controlled laboratory conditions. This test was used to determine the percent recovery of bacteria after passing through the pump and tubing system, to observe the potential tail length of the bacteria breakthrough due to attachment-detachment of Enterococcus to pump and tubing walls, and to determine a minimum pump and tubing assembly purging volume that would prevent the potential of equipment carry-over from one well to another. Enterococcus was spiked to DI water at a concentration of 1500 cfu/100 mL (a concentration not exceeded by 99% of dairy groundwater samples in our database). The pump-tubing system was brought into the laboratory from the storage area. Forty liters of DI water spiked with Enterococcus was pumped through the submersed pump-tubing system at a rate of approximately 6 L/min followed by pumping 200 L of Enterococcus-free DI water. Discharge water (volumes of 2 mL to 5 L) was collected from the beginning of pumping, at intervals of one liter for detection of Enterococcus.
Field Purging Test
A field purging experiment was performed to determine the association of Enterococcus concentration in groundwater with water parameters and the volume of water sampled. For the test we selected a monitoring well located in a highly fecal contaminated area that was surrounded by fenced animal corrals, frequently flooded with runoff from the corral, and with generally significant accumulation of feces in the immediate area surrounding the well housing. The monitoring well is protected with a traffic-rated well box, sealed at the surface. The groundwater was pumped at approximately 7.6 L/min for a total of 1900 L, which corresponds to 150 wet well bore volumes. Using a multiparameter water quality sensor, water temperature, electric conductivity, pH, and DO were measured continuously. Five liter samples were collected for analysis of Enterococcus after 19, 38, 94, 190, 380, 950, and 1900 L (1.5, 3, 7.5, 15, 30, 75, and 150 well volumes, respectively) of purging.
Quality Control Samples
Equipment blanks: Two equipment blanks were collected to confirm that the sampling equipment is not a source of contamination. The tests were performed at the UC Davis campus immediately upon completion of multi-day sampling trips to the dairy monitoring well network. First, standard equipment cleaning was completed in our field staging area (see above). Then, DI water was pumped from a sterile, continuously refilled 20 L bucket at a rate of approximately 6 L/min. After purging 200 L of DI water through the hose-pump assembly, two replicate 5 L water samples were collected and analyzed for presence or absence of Enterococcus.
Field pumping blanks: Ten field-pumping blanks were collected to evaluate the sampling protocol under IFRE field conditions. A well location was selected and tests performed at the end of a regular sampling day during which the pump equipment had been used to collect groundwater samples for chemical analyses from 6 to 8 monitoring wells on dairy farms (Harter et al., 2002). The pump was not detergent washed or sterilized before the field blank test, but treated according to the above described sampling protocol (without sterilization). Conditions of pumping and sampling were equivalent to sampling from a monitoring well. For the field pumping blank, DI water was transported to the dairy farm in autoclaved 10-L carboys and poured into a 20-L bucket. The submersible pump was placed into the bucket to pump water at approximately 12 L/min while the bucket was maintained at full level with replacement DI water. Approximately 200 L of DI water was pumped through the submersible pump sampling system for purging. Then, 10 L water samples were collected from the pump discharge hose into an autoclaved carboy. Samples were split into two 5 L samples for analysis. The test was repeated five times.
Field open air blank: For field open air blanks DI water was transported to the dairy field site in airtight autoclaved containers, and poured into an open, sterile 20-L bucket at the commencement of the field pumping blank procedure. The open bucket containing the air blank sample was exposed to ambient air approximately 20 m away from the location of the field pumping blank sampling. Ambient wind speed was negligible (less than 3 km/h). Upon completion of sampling the concurrent field pumping blank, the exposed water was immediately poured from the bucket into a 10 L carboy, sealed, cooled, and transported to laboratory. Five 10 L open air blanks were collected and split into ten 5 L samples for analysis.
Field transfer blank: After collecting field pumping blanks and field open air blanks, field transfer blanks were collected: DI water was transported to the dairy field site in an airtight container, where it was transferred, within a dairy freestall location, by pouring DI water directly into another autoclaved carboy at the dairy sampling location, which was then promptly closed and returned to the laboratory. During sample transfer between containers, sample water was briefly exposed to ambient air. Five 10 L field transfer blanks were collected and split into ten 5 L samples for analysis.
Trip blanks: Ten trip blanks were collected. Five 10 L carboys, filled in the laboratory with DI water and closed to airtight conditions were brought to the dairy farm, and returned to the laboratory without opening the carboy during the entire trip. Samples were split into ten 5 L samples for analysis.
All QA/QC samples were collected during the spring of 2008 under warm, dry field sampling conditions.
Multi-Year Field Sampling Campaign and Statistical Analysis
A multi-year field sampling campaign was performed using 17 monitoring wells on two freestall dairies that are part of a monitoring well network described in detail by Harter et al. (2002). Briefly, 5.1 cm diameter PVC monitoring wells are located within or immediately downgradient from one of three dairy management units on the two dairies: corrals and open freestall areas (no walls), liquid manure storage lagoons, and forage fields regularly treated with liquid dairy manure (slurry). The underlying aquifer is unconfined consisting of fine sandy to loamy sand alluvial sediments with water table depth at approximately 3 m below ground surface and monitoring wells screened from 3 m to 9 m below ground surface. Microbial water samples were collected in October 2006, May 2007, and September 2007 from four monitoring wells on two dairies; and in January, April, and September 2008, and in March 2009, from 13 to 17 monitoring wells (depending on accessibility on the sampling date) on the same two dairies.
The results of the field sampling trips were statistically tested for cross-contamination (bias) between wells due to the lack of sterilization. Conceptually, cross-contamination during the field campaign causes a sample to be a composite of actual aquifer microbial concentration plus an unknown amount of carry-over bacteria from the previous well sample, via attachment-detachment processes on the field sampling equipment. The carry-over is assumed to not significantly lower the concentration of the previously collected, donating sample. The measured concentration in cross-contaminated samples would therefore be higher than actual groundwater concentration, thus introducing cross-correlation between subsequent samples. Here, we only consider systemic, continuous cross-contamination. We neglect the possibility of sudden, uncontrollable spikes in cross-contamination, which are unlikely to occur because the purging process is steady. Microbial cross-contamination can only lead to an upward bias in the measured concentration (relative to the true concentration), but not to a downward bias, due to its intrinsic additive nature. Hence, cross-contamination cannot cause the true water quality to be diluted into lower concentration (“non-dilution property”).
We tested for cross-contamination first by considering autocorrelation in the time series. Second, the non-dilution property allows us to obtain a sub-sample of groundwater samples that are unaffected by cross-contamination: selecting only those samples, yunbiased, from the time series of Enterococcus concentrations that have higher concentration than the preceding sample. We also consider the difference between two consecutive unbiased samples (the second and third sample in any sub-series of three consecutive time-series samples with increasing concentration only) and we compare those to the absolute concentration difference between other pairs of consecutive samples. This yields the following two test statistics:
| (1a) |
| (1b) |
where < > indicates the expected value operator and:
 |
We compare those to the test statistics obtained from simulated sample time series based on two hypothetical models: Model 1 simulates a time series of random, independent and identically distributed (iid) groundwater samples:
| (2) |
where y1(k) is the log10 concentration of Enterococcus in the kth groundwater sample, and m and s are the mean and standard deviation, respectively of the iid normal random variable N. Model 2 simulates a time series of random, but cross-contaminated groundwater samples:
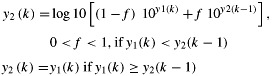 |
(3) |
where f is the fraction of the previous sample's concentration that is added to the new sample concentration. The sample data are considered significantly different from Model 1 or Model 2, if the sample test statistics fall within the 2.5% tails on each side of the simulated distributions of the test statistics (p < 0.05). The Monte Carlo simulations for Model 1 and Model 2 are each based on one million time series of the same series length as the field campaign. Simulation models and statistical analysis are implemented with the statistical software R (R Core Team 2013).
Microbial Analysis
All samples were maintained on ice immediately after sample collection and during transport to the laboratory. Water samples were stored at 4°C in laboratory until processed within 24 h of collection. Membrane filtration methods were used for enumeration of Enterococcus using a pressure vessel filter system for large volume samples (up to 10 L) and a vacuum filtration system for small volume samples in the breakthrough experiment. Water was filtered using 47 or 142 mm diameter filter with 0.45 µm pore size. After filtration, the filters were placed onto modified Enterococcus agar (mEI) and cultured at 41°C for 24 h. Presumptive Enterococcus colonies on mEI agar were confirmed to be Enterococcus spp. by biochemical tests. Two representative colonies from each mEI agar plate were selected for biochemical tests which including growth at Brain Heart Infusion Broth (BHIB) at 45 ± 0.5°C, BHIB with NaCl at 35 ± 0.5°C, and BEA (Bile Esculin Agar) at 35 ± 0.5°C. The number of confirmed typical colonies on each plate was counted and the concentration of bacteria was expressed as colony forming units (CFUs) per 100 mL (cfu/100 mL). For the breakthrough experiment, the detection limit was 2 cfu/100 mL, and for the field samples, it was 0.01 cfu/100 mL, due to the larger sample size in the field.
Results and Discussion
Cross-Contamination due to Equipment Reuse
Laboratory spike and purging results show that the Enterococcus concentration during the breakthrough experiment responded rapidly to the concentration changes in the influent (Figure 1). During purging of the pump-tubing assembly, switching from spiked solution to DI water, the Enterococcus concentration also responded quickly and fell below the detection limit after flushing the total tubing volume plus an additional 2 L. No tailing (i.e., long-term elution of Enterococcus) was observed at levels exceeding the detection limit or 0.13% of peak concentration. Hence, the pump-tubing assembly itself was considered appropriate for microbial sampling from wells following an appropriate purge. The average recovery rate (n = 38) for Enterococcus in the effluent was 95.3% with a relative standard deviation (RSD) of 10.5%, well within analytical acceptance standards (U.S. EPA 2009), indicating that no significant observable loss of Enterococcus occurred during the pumping process.
Figure 1.

Breakthrough curve of Enterococcus (1500 cfu/100 mL) through a submersible pump. The thick gray line above the graph indicates the time interval over which the influent contained Enterococcus. Enterococcus was observed in the effluent after the lag time corresponding to the pump volume. Average peak concentration was 95.3% (standard deviation 10.0%) of the target influent concentration. Values after 48 L are below detection (detection limit: 2 cfu/100 mL up to 60 L, and 0.1 cfu/100 mL after 60 L).
Cross-Contamination due to Wellhead, Well Casing, or Near-Well Groundwater Contamination
Under field purging conditions, temperature, electrical conductivity, and DO concentrations stabilized after purging 150 to 200 L (12 to 16 well volumes) from the dairy monitoring well. In contrast, only small changes were observed in pH. Similarly, Enterococcus concentrations in monitoring well samples, initially very high, stabilized after purging the same volume of water, at a concentration that was two orders of magnitude smaller than the initial concentration (Figure 2), suggesting that field water quality parameters are sufficient indicators to screen out wellbore and near-well microbial contamination.
Figure 2.
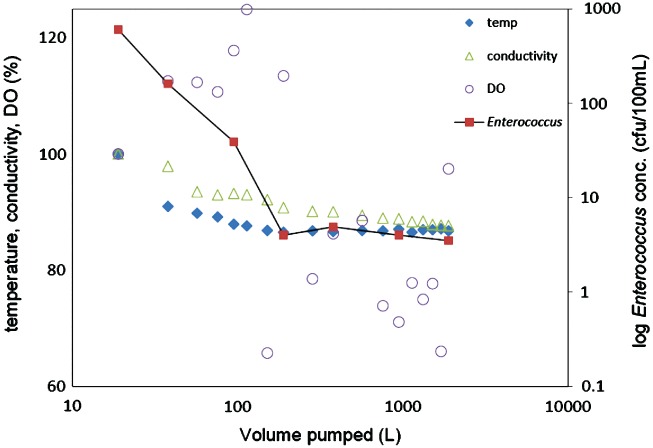
Enterococcus concentration changes (right axis, logarithmic scale) and relative changes in field parameters (left axis, linear scale) during purging. Values for field parameters are shown as the percentage of the initial readings (100%). The initial values are temperature 22.9°C, conductivity 3080 μS/cm, DO 2.37 ppm.
The approximately 13 to 18 wet well volumes of purging necessary to reach ambient groundwater conditions outside the zone of influence of the monitoring well (6 m screen immediately below the water table, 5.1 cm diameter) is in contrast to the much smaller purge volume needed in the laboratory spike and purging test to flush the pump-hose assembly. It also significantly exceeds the 3 to 5 wet well volumes suggested by standard methods, but is consistent with the recommendation to not sample until chemical water quality parameters stabilize (U.S. EPA 2011).
The long transition in water quality and Enterococcus concentrations prior to 190 L (15 well volumes) may be due to groundwater contamination in the immediate surroundings of the monitoring well, due to a leak around the well seal into the annular well grout seal (Ross 2010), or due to contamination introduced while lowering the pump inside the well. Another source of fecal contamination may be the development of biofilm on the well screen and in the filter pack of the well at the well-aquifer interface due to high concentration of dissolved organic carbon (Chomycia et al., 2008) with atmospheric oxygen available through the well bore. During 14 other sampling events at this well, at 6-weekly intervals between 2007 and 2009, water quality parameters stabilized after an average of 99 L (7.5 well volumes) with a standard deviation of 39 L (3 well volumes), consistent with this specific field test. On the other 16 monitoring wells in this 2 dairy network, average purging volume needed ranged from 83 L to 101 L (6.5 to 8 well volumes) during as many as 19 sampling campaigns (mostly to collect water samples for N species and salinity analysis).
The results are consistent with microbial sampling conducted by Knappett et al. (2010) in a similar IFRE, where 3 to 5 well volumes needed to be purged from a shallow sedimentary aquifer. Kozuskanich et al. (2010) also found consistent 1- to 2-log unit decline in bacteria concentrations in fractured bedrock wells, although the decline in this case occurred much more rapidly, while purging 3 to 5 wet well volumes. Slightly smaller declines (about 1-log unit) in microbial concentrations between sampling within-well-bore water and after purging the standard 3 to 5 well volumes were found in an Australian aquifer of unspecified geology (Roudnew et al., 2012). However, in this latter experiment, purging was stopped after the chemical parameters stabilized. Microbial concentrations were not confirmed by sampling later in time, leaving the possibility of further concentration decline.
Cross-Contamination due to Ambient Air Conditions
Enterococcus was not detected in the equipment blank or in the trip blank samples confirming that standard equipment cleaning procedures, the pumping system, and the carboys used for sampling and the transportation would successfully prevent bacterial contamination and not act as a source of contamination. However, there were consistent detections of Enterococcus in the field transfer blanks, field open air blanks, and field pumping blanks (Table 1) indicating that sampling dairy groundwater could result in water contamination due to exposure to ambient air in the dairy environment.
Table 1.
Concentration of Enterococcus (cfu/100 mL) in Field Transfer Blank, Field Pump Blank, and Field Open Air Blank
| Sample Number | Field Transfer Blank | Field Pumping Blank | Field Open Air Blank |
|---|---|---|---|
| 1 | 0.04 | 4.92 | >251 |
| 2 | 0.06 | 8.44 | >25 |
| 3 | 1.34 | 6.22 | >25 |
| 4 | 2.98 | 12.9 | >25 |
| 5 | 3.10 | 4.02 | >25 |
| 6 | 2.44 | 8.38 | >25 |
| 9 | 3.78 | 2.14 | >25 |
| 8 | 2.32 | 4.26 | >25 |
| 9 | 5.78 | 3.22 | >25 |
| 10 | 6.48 | 6.64 | >25 |
| Geometric mean (cfu/100 mL) | 1.4 | 5.4 | — |
| Back-transformed standard deviation of log-concentration | 6.1 | 1.7 | — |
Unexpectedly, these samples were too numerous to count (TNTC). >25 was calculated assuming TNTC was twice the value of the largest count per plate (646 CFU counts) with a sample volume of 5 L.
Concentration of Enterococcus in the 10 field transfer blank samples ranged from 0.04 to 6.48 cfu/100 mL. Field transfer blanks were only in contact with ambient air and/or associated suspended atmospheric particles within the CAFO. Longer exposure time to air and larger open area may explain the higher Enterococcus concentration in the field open air blank (>25 cfu/100 mL, Table 1) when compared to that in the field transfer blank.
Enterococcus was detected in all field pumping blanks, at higher concentrations (2.1 to 12.9 cfu/100 mL) than in the field transfer blank. The field pumping blank involved multiple potential air entrapment points, which may explain the higher concentrations: the bucket used to pump from was itself open to the atmosphere; replacement DI water was transferred into the bucket by pouring; and the pumped water was exposed to air while filling the sample bottle. Similarly, the field open air blank had multiple access points to ambient air exposure: during filling of the bucket, while resting in the bucket, and again upon filling the sampling container from the bucket. The higher concentration in the field open air blank when compared to the field pumping blank (Table 1) may be the result of dilution in the field pumping blank, which involved the transfer of 12 times more water than the field open air blank.
In the field pumping blank, the pump and tubing equipment may have been an additional source of Enterococcus. However, based on the laboratory spike and purge results, the inside of the pump and the tubing are not likely sources after purging 200 L of water. Also, Enterococcus contamination from equipment would likely cause a decrease in concentration over time, which was not the case here. Hence, the pump and tubing are not considered a likely source, supporting the conclusion that ambient air contamination is the most likely source.
Research indicates that ambient air on CAFOs is a significant source of FIB contamination: Wilson et al. (2002) found airborne, gram positive cocci bacteria commonly associated with feces, and similar in size to Enterococcus, in and near open feedlots at concentrations from 10 to several 1000 cfu/m3 during peak dust hours. Upwind concentrations were found to be in the range of ten to hundreds of cfu/m3 at ambient temperatures of 28 to 37°C and relatively low humidity (similar to our arid sampling conditions). Popescu et al. (2011) identified Enterococcus in one-quarter of air samples in dairy barns, at concentrations on the order of 104 cfu/m3. Indoor concentrations are typically found to be higher than outdoor concentrations due to larger air diffusion in outside air (Wilson et al., 2002). Abd-Elall et al. (2009) found only small differences in the prevalence of airborne Enterococcus between dairy (23%) and beef (27%) cattle housing, and at concentrations either the same or higher than Popescu et al. (2011). In all of these studies ambient air was sampled at 0.5 to 1 m above ground surface, at or above the height of the opening of our sampling containers (˜0.4 m). Also, our sampling occurred on days with no wind or obvious fugitive dust, comparable to early morning samples in the study of Popescu et al. (2011) or upwind conditions with minimal influence from cattle activity (Wilson et al., 2002).
The collection of environmental samples such as sampling wells from animal farming operations should therefore consider levels of contamination from airborne microbial pathways. Importantly, airborne contamination of equipment and materials at IFREs may occur after equipment sterilization. Field blanks exposed to the atmosphere in a manner similar to the actual well water samples can be used to enumerate background levels caused by deposition of enteric bacteria in ambient air during the sampling process, for example, a field transfer sample: At our field sites, the geometric mean of the transfer blanks is 1.4 cfu/100 mL with a considerable standard deviation. For the assessment of the field campaign, Enterococcus concentrations of 1 cfu/100 mL or less are considered to be potentially influenced by ambient air contamination. Only concentrations above 10 cfu/100 mL are likely to represent actual groundwater concentrations. This concentration is still well below the U.S. EPA criteria of 61 cfu/100 mL for freshwater designated beach areas with primary human contact.
Application in a Field Sampling Campaign
A total of 69 Enterococcus samples were collected during seven field campaigns in 2006 through 2009. The first three campaigns sampled two wells on each dairy (12 samples, 3 wells located in corrals, one well located in a manure treated field). Enterococcus levels ranged from 0.24 to 33,000 cfu/100 mL. The four 2008 through 2009 field sampling campaigns yielded 57 samples of Enterococcus, sampling from 13 to 17 wells in each campaign (Figure 3). Only two of the 57 samples had concentrations below the detection limit. Concentrations of Enterococcus were as high as 21,000 cfu/100 mL. After replacing MDL occurrences with values at half of the MDL (0.005 cfu/100 mL), concentration data were log-transformed. Log-transformed values were significantly different from a normal distribution, especially when considering the last four campaigns (Lillifors test, p < 0.05). After removing the two non-detects and the three highest values (outliers) from either the entire dataset or from the dataset of the last four (long) sampling campaigns, the distribution of log-transformed values was no longer significantly different from a normal distribution (Figure 3). Using 10 cfu/100 mL as the sampling method detection limit due to ambient air contamination during sampling, only 3 of 12 groundwater samples (25%) tested positive for Enterococcus during the first three campaigns on 4 wells, and only 29 of 57 groundwater samples (50%) tested positive for Enterococcus during the last four sampling campaigns on as many as 17 wells.
Figure 3.

Enterococcus concentrations detected in the field sampling campaign: Time series of the four long sampling campaigns (a) performed on 13 to 17 wells between 2008 and 2009 (blue circles: 1/2008, red squares: 4/2008, green diamonds: 9/2008, black triangles: 3/2009). Histogram, median, interquartile range, non-outlier range, and outliers of Enterococcus during all seven field sampling campaigns (b). Normal probability plot for (c) all seven sampling campaigns (after removing outliers) and (d) for the four long sampling campaigns (after removing outliers).
Considering the 52 non-outlier samples from the last four sampling campaigns, no significant autocorrelation was found between consecutive samples, suggesting that no measurable cross-contamination had occurred (Figure 3). Furthermore, the comparison of the sample test statistics (1) with the distribution of the same test statistics obtained from Model 1 simulations (no cross-contamination) indicated no statistically significant difference (Table 2), confirming that the results were consistent with the assumption that cross-contamination was negligible. If we simulate cross-contamination at a fractional level f = 0.025 (half of the 5% non-recovered Enterococcus value observed in the lab recovery test) and use Model 2, there also is no statistically significant difference in the measured test statistics from the distribution of the simulated Model 2 test statistics, possibly because of the small value of f (Table 2). Cross-contamination at that fractional level may therefore have occurred, but is not discoverable with these test statistics. This also reflects the high recovery rate achieved in the lab test. We note that the tests do not consider the effects of ambient air contamination, which may have introduced additional bias in the sample concentration. Together with the rigorous quality control sample results, statistical evaluation of the field sampling campaign provides consistent evidence that the sampling method in fact does not lead to equipment cross-contaminated samples.
Table 2.
Results of the Field Measurements and of the Monte Carlos Simulation of 52 Field Measurements During the Last Four (Long) Sampling Campaigns
| Mean | Standard Deviation | Difference Between Means, del.m (Equation 1a) | Difference in Mean Step Size, del.Diff.m (Equation 1b) | First Order Autocorrelation | Second Order Autocorrelation | ||
|---|---|---|---|---|---|---|---|
| Field measurements (n = 52) | 0.973 | 0.859 | 0.709 | 0.068 | 0.196 | 0.258 | |
| MCS Model 1 (Equation 2) (n = 106) | Average | 0.973 | 0.855 | 0.957 | −0.265 | −0.020 | 0.001 |
| 2.5%-ile | 0.740 | 0.693 | 0.659 | −0.717 | −0.287 | −0.267 | |
| 97.5%-ile | 1.207 | 1.025 | 1.270 | 0.251 | 0.249 | 0.267 | |
| p-value | 50% | 53% | 5% | 91% | 94% | 97% | |
| MCS Model 2 (Equation 3) (n = 106) | Average | 0.979 | 0.847 | 0.894 | −0.111 | 0.145 | 0.164 |
| 2.5%-ile | 0.708 | 0.692 | 0.624 | −0.588 | −0.105 | −0.082 | |
| 97.5%-ile | 1.252 | 1.017 | 1.169 | 0.474 | 0.381 | 0.395 | |
| p-value | 49% | 57% | 9% | 77% | 65% | 77% |
p-value: MCS quantile of the measured statistic level.
MCS: Monte Carlo simulation, 1 million random realizations, with each realization consisting of a simulation of 52 field measurements.
Conclusion
In conclusion, the proposed microbial field sampling approach using extended purging without sterilization yields reproducible results when sampling wells in IFREs. The option to not disinfect a mobile pump-tubing system used for monitoring well sampling yields a less cumbersome and, hence, less expensive sampling protocol for remote and/or low resource regions. This is of particular importance in IFREs (animal farming operations, rural areas lacking appropriate sanitation services, e.g., in developing countries), where sterilization is difficult to perform due to the ubiquitous presence of fecal matter on any surfaces and in the atmosphere.
In IFREs such as CAFOs, extended purging is often necessary to obtain water samples that are representative of ambient aquifer conditions. It appears that water within a wellbore and within the immediate vicinity of a wellbore may have significantly higher concentrations of FIB than the aquifer itself. If not addressed by adequate purging, the wellbore contamination within some wells may pose a risk for sample contamination. DO, electrical conductivity, and temperature field monitoring appeared sufficient to determine the amount of purging needed.
Importantly, purging a large volume of water to obtain samples representative of aquifer conditions (rather than in-well conditions) will further reduce the possibility of equipment cross-contamination between wells (Figure 1). The cross-contamination from within the sampled well, in many cases, may be a higher risk than cross-contamination between wells. Furthermore, the risk for in-well contamination exists regardless of equipment sterilization, and even in the case of a completely sealed well (due to the presence of oxygen in the well bore).
Our work demonstrates for the first time that exposure to ambient air during sample water collection is an important source of microbial cross-contamination in IFREs. Properly controlling for ambient air contamination through QA/QC procedures allowed us to suggest an alternate MDL that was determined by the sampling procedure rather than the laboratory procedure. To achieve better MDLs, sampling equipment that avoids contact of the water sample with ambient air would need to be installed, for example, dedicated, sealed pump equipment within a sealed monitoring well. Samples would be collected through closed loop transfer into sampling containers to also avoid contamination of the air in the well bore. Installation of such dedicated pumping equipment adds significant and sometimes unaffordable cost to microbial field sampling programs, especially in developing economies.
Acknowledgments
Funding for this research was provided by the California State Water Resources Control Board (04-184-555-0), and California Department of Food and Agriculture (07-0893). We gratefully acknowledge the constructive review comments of Jack Schijven, Larry McKay, and an anonymous reviewer, which have greatly improved the quality of this manuscript.
References
- Abd-Elall AMM, Mohamed MEM. Awadallah MAI. Potential airborne microbial hazards for workers on dairy and beef cattle farms in Egypt. Veterinaria Italiana. 2009;45:275–285. [PubMed] [Google Scholar]
- Anderson ME. Sobsey MD. Detection and occurrence of antimicrobially resistant E. coli in groundwater on or near swine farms in eastern North Carolina. Water Science and Technology. 2006;54(3):211–218. doi: 10.2166/wst.2006.471. [DOI] [PubMed] [Google Scholar]
- Asholt NJ, Grabow WOK. Snozzi M. Indicators of microbial water quality. In: Fewtrell F, editor; Bartram J, editor. World Health Organization (WHO). Water Quality: Guidelines, Standards and Health. London, UK: IWA Publishing; 2001. pp. 289–316. http://www.who.int/water_sanitation_health/dwq/iwachap13.pdf (accessed September 6, 2013) [Google Scholar]
- Beck JP, Heutelbeck A. Dunkelberg H. Volatile organic compounds in dwelling houses and stables of dairy and cattle farms in Northern Germany. Science of the Total Environment. 2007;372(2–3):440–454. doi: 10.1016/j.scitotenv.2006.10.009. [DOI] [PubMed] [Google Scholar]
- Chee-Sanford JC, Aminov RI, Krapac IJ, Garrigues-Jeanjean N. Mackie RI. Occurrence and diversity of tetracycline resistance genes in lagoons and groundwater underlying two swine production facilities. Applied and Environmental Microbiology. 2001;67(4):1494–1502. doi: 10.1128/AEM.67.4.1494-1502.2001. [DOI] [PMC free article] [PubMed] [Google Scholar]
- Chomycia JC, Hernes PJ, Harter T. Bergamaschi BA. Land management impacts on dairy-derived dissolved organic carbon in ground water. Journal of Environmental Quality. 2008;37(2):333–343. doi: 10.2134/jeq2007.0183. DOI: 10.2134/jeq2007.0183. [DOI] [PubMed] [Google Scholar]
- Conn KE, Habteselassie MY, Blackwood AD. Noble RT. Microbial water quality before and after the repair of a failing onsite wastewater treatment system adjacent to coastal waters. Journal of Applied Microbiology. 2011;112(1):214–224. doi: 10.1111/j.1365-2672.2011.05183.x. DOI: 10.1111/j.1365-2672.2011.05183.x. [DOI] [PubMed] [Google Scholar]
- Crane PE. Silliman SE. Sampling strategies for estimation of parameters related to groundwater quality. Ground Water. 2009;47(5):699–708. doi: 10.1111/j.1745-6584.2009.00578.x. DOI: 10.1111/j.1745-6584.2009.00578.x. [DOI] [PubMed] [Google Scholar]
- Crane PE. University of Notre Dame, Notre Dame, Indiana; 2006. Implementation of a sustainable groundwater quality monitoring program in rural Benin, West Africa. M.S. thesis. [Google Scholar]
- Dunlap WJ, McNabb JF, Scalf MR, Cosby RL. Sampling for organic chemicals and microorganisms in the subsurface. Ada, Oklahoma: U.S. EPA Office of Research and Development, Robert S. Kerr Environmental Research Laboratory; 1977. EPA-600/2-77-176. [Google Scholar]
- Edrington TS, Fox WE, Callaway TR, Anderson RC, Hoffman DW. Nisbet DJ. Pathogen prevalence and influence of composted dairy manure application on antimicrobial resistance profiles of commensal soil bacteria. Foodborne Pathogens and Disease. 2009;6(2):217–224. doi: 10.1089/fpd.2008.0184. [DOI] [PubMed] [Google Scholar]
- Harter T, Davis H, Mathews MC. Meyer RD. Shallow groundwater quality on dairy farms with irrigated forage crops. Journal of Contaminant Hydrology. 2002;55(3–4):287–315. doi: 10.1016/s0169-7722(01)00189-9. [DOI] [PubMed] [Google Scholar]
- Knappett PSK, Layton A, McKay LD, Williams D, Mailloux BJ, Huq MR, Alam MJ, Ahmed KM, Akita Y, Serre ML, Sayler GS. van Geen A. Efficacy of hollow-fiber ultrafiltration for microbial sampling in groundwater. Ground Water. 2010;49:53–65. doi: 10.1111/j.1745-6584.2010.00712.x. DOI: 10.1111/j.1745-3336584.2010.00712.x. [DOI] [PubMed] [Google Scholar]
- Kozuskanich J, Novakowski KS. Anderson BC. Faecal indicator bacteria variability in samples pumped from monitoring wells. Ground Water. 2010;49:43–52. doi: 10.1111/j.1745-6584.2010.00713.x. DOI: 10.1111/j.1745-3376584.2010.00713.x. [DOI] [PubMed] [Google Scholar]
- Lewis DJ, Atwill ER, Lennox MS, Hou L, Karle B. Tate KW. Linking on-farm dairy management practices to storm-flow fecal coliform loading for California coastal watersheds. Environmental Monitoring and Assessment. 2005;107(1–3):407–425. doi: 10.1007/s10661-005-3911-7. [DOI] [PubMed] [Google Scholar]
- Myers DN, Stoeckel DM, Bushon RN, Francy DS. Brady AMG. Faecal indicator bacteria (ver. 2.0). U.S. Geological Survey Techniques of Water-Resources Investigations, Book 9, Chap. A7, Sec. 7.1; 2007. http://pubs.water.usgs.gov/twri9A7/ (accessed April 2, 2012) [Google Scholar]
- Page RM, Scheidler S, Polat E, Svoboda P. Huggenberger P. Faecal indicator bacteria: Groundwater dynamics and transport following precipitation and river water infiltration. Water, Air, and Soil Pollution. 2012;223:2771–2782. DOI: 10.1007/s11270-011-1065-5. [Google Scholar]
- Popescu S, Borda C. Diugan EA. Microbiological air quality in tie-stall dairy barns and some factors that influence it. African Journal of Agricultural Research. 2011;6(32):6726–6734. DOI: 10.5897/AJAR11.1428. [Google Scholar]
- Powell KL, Taylor RG, Cronin AA, Barrett MH, Pedley S, Sellwood J, Trowsdale SA. Lerner DN. Microbial contamination of two urban sandstone aquifers in the UK. Water Research. 2003;37(2):339–352. doi: 10.1016/s0043-1354(02)00280-4. [DOI] [PubMed] [Google Scholar]
- Public Health Dispatch Outbreak of Escherichia coli O157:H7 and Campylobacter among attendees of the Washington County Fair. Morbidity and Mortality Weekly Report. 1999;48:803. [PubMed] [Google Scholar]
- Purdy CW, Clark RN. Straus DC. Determination of water quality variables, endotoxin concentration, and Enterobacteriaceae concentration and identification in southern High Plains dairy lagoons. Journal of Dairy Science. 2010;93:1511–1522. doi: 10.3168/jds.2009-2497. [DOI] [PubMed] [Google Scholar]
- R Core Team . R: A language and environment for statistical computing. Vienna, Austria: R Foundation for Statistical Computing; 2013. http://www.R-project.org/ (accessed September 1, 2013) [Google Scholar]
- Ross J. The Nebraska grout study. Water Well Journal, National Ground Water Association; 2010. http://dhhs.ne.gov/publichealth/Documents/TheGroutStudy.pdf (accessed August 28, 2013) [Google Scholar]
- Roudnew B, Seymour JR, Jeffries TC, Lavery TJ, Smith RJ. Mitchell JG. Bacterial and virus-like particle abundance in purged and unpurged groundwater depth profiles. Ground Water Monitoring & Remediation. 2012;32(4):72–77. DOI: 10.1111/j1745-6592.2012.01393.x. [Google Scholar]
- Solo-Gabriele H. Neumeister S. US outbreaks of cryptosporidiosis. American Water Works Association Journal. 1996;88(9):76–86. [Google Scholar]
- Stephen AM. Cummings JH. The microbial contribution to human faecal mass. Journal of Medical Microbiology. 1980;13:45–56. doi: 10.1099/00222615-13-1-45. [DOI] [PubMed] [Google Scholar]
- Toth JD, Aceto HW, Rankin SC. Dou Z. Survival characteristics of Salmonella enterica serovar Newport in the dairy farm environment. Journal of Dairy Science. 2011;94:5238–5246. doi: 10.3168/jds.2011-4493. [DOI] [PubMed] [Google Scholar]
- U.S. EPA . SESD Operating Procedure for Groundwater Sampling. Washington, DC: U.S. Environmental Protection Agency; 2011. [Google Scholar]
- U.S. EPA Method 1600: in Water by Membrane Filtration Using membrane-Enterococcus Indoxyl=beta-D-Glucoside Agar (mEI) Enterococci. 2009. EPA-821-R-09-016. http://water.epa.gov/scitech/methods/cwa/bioindicators/upload/method_1600.pdf (accessed December 2009)
- U.S. EPA . Practical Guide for Ground-Water Sampling. Washington, DC: U.S. Environmental Protection Agency; 1985. [Google Scholar]
- U.S. EPA . Microbiological Methods for Monitoring the Environment, Water and Wastes. Cincinnati, Ohio: M. E. R. L. Office of Research and Development; 1978. [Google Scholar]
- U.S. EPA . Sampling for Organic Chemicals and Microorganisms in the Subsurface. Ada, Oklahoma: U.S. Environmental Protection Agency; 1977. [Google Scholar]
- U.S. EPA . Handbook for Evaluating Water Bacteriological Laboratories. Cincinnati, Ohio: M. E. R. L. Office of Research and Development; 1975. [Google Scholar]
- U.S. Geological Survey (USGS) National field manual for the collection of water quality data. Techniques of Water-Resources Investigations; 2008. Book 9. http://water.usgs.gov/owq/FieldManual/ (accessed September 6, 2013) [Google Scholar]
- Valcour JE, Michel P, McEwen SA. Wilson JB. Associations between indicators of livestock farming intensity and incidence of human Shiga toxin-producing Escherichia coli infection. Emerging Infectious Diseases. 2002;8:252–257. doi: 10.3201/eid0803.010159. [DOI] [PMC free article] [PubMed] [Google Scholar]
- Watson E, Jeckel S, Snow L, Stubbs R, Teale C, Wearing H, Horton R, Toszeghy M, Tearne O, Ellis-Iversen J. Coldham N. Epidemiology of extended spectrum beta-lactamase E. coli (CTX-M-15) on a commercial dairy farm. Veterinary Microbiology. 2012;154:339–346. doi: 10.1016/j.vetmic.2011.07.020. [DOI] [PubMed] [Google Scholar]
- Wilson SC, Morrow-Tesch J, Straus DC, Cooley JD, Wong WC, Mitloehner FM. McGlone JJ. Airborne microbial flora in a cattle feedlot. Applied and Environmental Microbiology. 2002;68:3238–3242. doi: 10.1128/AEM.68.7.3238-3242.2002. DOI: 10.1128/AEM.68.7.3238-3242.2002. [DOI] [PMC free article] [PubMed] [Google Scholar]
- World Health Organization (WHO) Progress on sanitation and drinking water, Update 2013. 2013a. http://www.who.int/water_sanitation_health/publications/2013/jmp_report/en/index.html (accessed on September 6, 2013)
- World Health Organization (WHO) Diarrheal disease, Factsheet 330, April 2013. 2013b. http://www.who.int/mediacentre/factsheets/fs330/en/index.html (accessed on September 6, 2013)