

Abstract
Objective
The diagnosis of mild cognitive impairment (MCI) and dementia requires detailed neuropsychological examinations. These examinations typically yield a large number of outcome variables, which may complicate the interpretation and communication of results. The purposes of this study were the following: (i) to reduce a large data set of interrelated neuropsychological variables to a smaller number of cognitive dimensions; (ii) to create a common metric for these dimensions (z-scores); and (iii) to study the ability of the cognitive dimensions to distinguish between groups of patients with different types of cognitive impairment.
Methods
We tested 1646 patients with different forms of dementia or with a major depression with a standard (n = 632) or, if cognitively less affected, a challenging neuropsychological battery (n = 1014). To identify the underlying cognitive dimensions of the two test batteries, maximum likelihood factor analyses with a promax rotation were conducted. To interpret the sum scores of the factors as standard scores, we divided them by the standard deviation of a cognitively healthy sample (n = 1145).
Results
The factor analyses yielded seven factors for each test battery. The cognitive dimensions in both test batteries distinguished patients with different forms of dementia (MCI, Alzheimer's dementia or frontotemporal dementia) and patients with major depression. Furthermore, patients with stable MCI could be separated from patients with progressing MCI. Discriminant analyses with an independent new sample of patients (n = 306) revealed that the new dimension scores distinguished new samples of patients with MCI from patients with Alzheimer's dementia with high accuracy.
Conclusion
These findings suggest that these cognitive dimensions may benefit neuropsychological diagnostics.
Keywords: dementia, cognitive dimensions, cognitive profiles, factor analysis
Introduction
Diagnoses of mild cognitive impairment (MCI) and dementia require detailed neuropsychological examinations (Dubois et al., 2007; Albert et al., 2011; McKhann et al., 2011; www.dsm5.org). Thus, it is critical that clinicians conduct comprehensive neuropsychological assessments examining a wide range of cognitive domains. To efficiently understand and communicate the multiplicity of outcome variables generated from neuropsychological test batteries, several investigators have created single summary or composite scores (Alzheimer's Disease Assessment Scale-cognitive subscale (ADAS-Cog) score; Rosen et al., 1984), different neuropsychological test battery (NTB) composite scores; e.g., Harrison et al., 2007; Lannfelt et al., 2008; Vellas et al., 2009) or the Consortium to Establish a Registry for Alzheimer's Disease (CERAD) total score (Ehrensperger et al., 2010). However, the use of single metacognitive summary scores dilutes potentially important differential contributions from different neuropsychological domains and may overlook treatment responses in specific cognitive domains. In an ideal clinical and research world, a neuropsychological test battery would produce one single, well-interpretable outcome score per cognitive domain, which would enable quantification of the extent of impairment in each domain and—at the same time—provide a cognitive profile of the patient's performance, which aids the identification of the underlying cause.
The aims of the present study were the following: (i) to reduce a data set of interrelated neuropsychological variables to a small number of interpretable cognitive dimensions; (ii) to create z-scores for these dimensions to equate the metric across the dimensions; and (iii) to determine the ability of these new cognitive dimension z-scores to distinguish between groups of patients with different types of cognitive impairment, that is, MCI, Alzheimer's dementia (AD), frontotemporal dementia (FTD) and cognitive impairment in individuals with major depression. We chose these diagnostic groups as the neuropsychological literature attests to the difficulty of distinguishing patients with MCI from those with AD (De Jager et al., 2003; Lambon Ralph et al., 2003) and depressed patients from patients with MCI or AD (Gianotti and Marra, 1994; Christensen et al., 1997; Künig et al., 2006) or patients with AD from patients with FTD (Perry and Hodges, 2000; Levy and Chelune, 2007; Rascovsky et al., 2007) on the basis of neuropsychological tests. A secondary analysis aimed to address the stability of the cognitive domain profiles with discriminant function analyses with a new sample of patients.
Methods
Participants
All participants were outpatients from the Memory Clinic, Department of Geriatrics, University Hospital Basel, Switzerland, who were examined between 2006 and 2011.
The multidisciplinary assessment included the following: (i) independent, detailed clinical interviews with the patient and (where possible) informant formally assessing the patients' mood and cognitive and everyday functioning; (ii) thorough medical examinations including neurological status; (iii) a magnetic resonance imaging examination with sequences optimized to detect structural brain abnormalities associated with cognitive impairment; (iv) a complete laboratory workup; (v) one of two comprehensive neuropsychological test batteries assessing the patients' cognitive functioning. Thereby, the challenging battery was used for higher functioning patients and the standard battery for more impaired patients (refer to the decision tree in the Supplementary Material). These two test batteries differ primarily in terms of the instruments assessing verbal and visual episodic memories (Table 1). A detailed description of each test in the two neuropsychological assessment batteries is provided as Supplementary Material.
Table 1.
The two neuropsychological test batteries used in the Memory Clinic Basel and the 18 variables of interest
| Standard battery | Challenging battery | |
|---|---|---|
| 1 | WMS-R—verbal digit span, forward | WMS-R—verbal digit span, forward |
| 2 | WMS-R—verbal digit span, backward | WMS-R—verbal digit span, backward |
| 3 | WMS-R—Corsi block, forward | WMS-R—Corsi block, forward |
| 4 | WMS-R—Corsi block, backward | WMS-R—Corsi block, backward |
| 5 | CERAD-NAB Word List, learning | CVLT, learning |
| 6 | CERAD-NAB Word List, delayed recall | CVLT, long delay free recall |
| 7 | CERAD-NAB word list, recognition | CVLT, recognition |
| 8 | CERAD-NAB Word List, intrusions | CVLT, free recall intrusions |
| 9 | CERAD-NAB figures, copy | Rey-figure, copy |
| 10 | CERAD-NAB figures, delayed recall | Rey-figure, delayed recall |
| 11 | Animal fluency | Animal fluency |
| 12 | S-words | S-words |
| 13 | BNT (15 items) | BNT (15 items) |
| 14 | TMT A | TMT A |
| 15 | TMT B | TMT B |
| 16 | Five-Point Test | Five-Point Test |
| 17 | Stroop, card 1 | Stroop, card 1 |
| 18 | Stroop, card 3/1 | Stroop, card 3/1 |
WMS-R, Wechsler Memory Scale-Revised (Wechsler, 1987); CERAD-NAB, Consortium to Establish a Registry for Alzheimer's Disease–Neuropsychological Assessment Battery (Morris et al., 1988); CVLT, California Verbal Learning Test (Delis et al., 1987); Rey-figure, Rey–Osterrieth Complex Figure Test (Rey, 1941); Animal fluency (Isaacs and Kennie, 1973); S-words (Spreen and Benton, 1977); BNT, Boston Naming Test (Kaplan et al., 1983); Trial Making Test A + B, TMT A and TMT B (Spreen and Strauss, 1991); Five-Point Test (Regard et al., 1982); Stroop Test (Stroop, 1935).
Diagnoses were established at an interdisciplinary diagnosis conference with geriatricians, neurologists, neuropsychologists, a neuropathologist, neuroimaging experts and psychiatrists. Because the neuropsychological data were available at the diagnosis conference, the question of circularity arises. However, diagnoses were never based on the neuropsychological assessment alone but rather on the integration of all comprehensive multidisciplinary findings. Nevertheless, it is not possible to completely rule out the possibility that the reported sensitivities and specificities were artificially inflated by the availability of the neuropsychological data at the diagnosis conference.
Six hundred and thirty-two patients received the standard battery, and 1014 cognitively less affected patients were administered the challenging battery. The demographic characteristics, mini mental status examination (Folstein et al., 1975) scores and diagnosis of the two patient groups are shown in Table 2. The two patient groups differed significantly with respect to age (p < 0.001) and mini mental status examination score (p < 0.001).
Table 2A.
Demographic characteristics of the different study samples: Memory Clinic study sample (n = 1646)
| Standard battery | Challenging battery | |
|---|---|---|
| N | 632 | 1014 |
| Gender, males (%) | 45.4 | 58.4 |
| Age ± SD (y) | 74.56 ± 7.91 | 65.42 ± 9.77 |
| Education ± SD (y) | 11.36 ± 2.92 | 13.21 ± 2.90 |
| MMSE ± SD | 25.28 ± 2.38 | 28.56 ± 1.31 |
| Probable AD | 241 | 90 |
| MCI | 215 | 468 |
| Amnestic MCI, single domain | 18 | 89 |
| Amnestic MCI, multiple domains | 100 | 178 |
| Nonamnestic MCI, single domain | 34 | 117 |
| Nonamnestic MCI, multiple domains | 63 | 84 |
| FTD | 14 | 5 |
| Major depression | 9 | 75 |
| No cognitive impairment | 18 | 218 |
| Mixed dementia | 34 | 5 |
| Probable VAD | 16 | 8 |
| Other diagnoses | 85 | 145 |
SD, standard deviation; MMSE, mini mental status examination (Folstein et al., 1975); MCI, mild cognitive impairment; AD, Alzheimer's dementia; VAD, vascular dementia; FTD, frontotemporal dementia.
Clinical diagnoses were made according to the following criteria. MCI was diagnosed according to the Winblad et al. (2004) criteria. Probable AD (probable AD) was diagnosed according to the criteria outlined by the National Institute for Neurological and Communicative Disorders and Stroke and the Alzheimer's Disease and Related Disorders Association (NINCDS-ADRDA; McKhann et al., 1984) and DSM-IV (American Psychiatric Association, 1994) criteria for AD. Probable vascular dementia was diagnosed according to the criteria outlined by the National Institute of Neurological Disorders and Stroke and the Association Internationale pour la Recherche et l'Enseignement en Neurosciences (Romàn et al., 1993). FTD was diagnosed according to the Neary et al. (1998) criteria, and major depression was diagnosed according to the DSM-IV criteria (American Psychiatric Association, 1994). Patients with a diagnosis of mixed dementia fulfilled two or more sets of diagnostic criteria for dementia listed in the previous texts.
Depression was assessed with two different questionnaires: the Geriatric Depression Scale; Sheikh and Yesavage, 1986) was used in the standard battery and the Beck Depression Inventory (Beck et al., 1961) was administered in the challenging battery. This retrospective data analysis was approved by the Ethics Committee of Basel, Switzerland.
Statistical analyses
On the basis of the methodology described by Berres and colleagues (2000; refer also to Berres et al., 2008), the raw scores on all neuropsychological test results from all patients were transformed into demographically adjusted z-scores.
Many patients had missing values in the Trail Making Test A (TMT A) (i.e., required more than 180 s to complete the task; n = 12/1646; 0.73%) and the TMT B (TMT B) (i.e., required more than 300 s to complete the task; n = 214/1646; 13.0%). To be able to use the TMT data in our analyses, missing values on this test were replaced by applying a malus to a fictive z-score on TMT A or TMT B. In order to create a malus for TMT B, we focused on two subsets of demented subjects: (i) patients who completed TMT B in the time interval between 240 and 300 s; and (ii) patients who failed to complete the TMT B. We aimed to compare their respective sample means in a representative score for test performance, namely, the z-values of the CERAD total score (Ehrensperger et al., 2010). Subset (i) achieved a mean CERAD total score of −2.41, whereas subset (ii) achieved a mean CERAD total score of −3.24. The resulting difference of 0.83 is a possible malus that could be subtracted from the minimal z-score from the TMT B (300 s) for each participant who failed to complete this test. This same procedure was applied for the interval between 270 and 300 s (reduced subset (i), mean = −2.54), with a possible malus of 0.7. We decided to subtract a malus of 0.7 from the z-scores of each patient who scored 300 on the TMT B. This procedure ensures an individual, demographically adjusted penalty for patients who failed to complete the test. The same procedure was carried out for TMT A, resulting in a malus of 0.4.
We selected 18 measures from each test battery, which represented a comprehensive estimate of cognitive functions most likely to be affected in dementia (Table 1). The z-scores of all selected variables fulfilled the requirements for normal distributions.
To identify the underlying factor structure in the two test batteries, the z-scores of the 18 variables of interest from each test battery (corresponding to the study samples described in Table 2A) were entered into two independent maximum likelihood factor analyses with promax rotation. The promax rotation was used because we assumed that underlying cognitive dimensions were correlated. Those z-scores that loaded highly on a common factor were summed to form a cognitive dimension. Beforehand, we confirmed that the sum of these z-scores was highly correlated with the corresponding factor scores. Because in a cognitively healthy population the standard deviation of a sum of z-scores is usually different from 1, the z-score for each factor was standardized on the basis of an independent sample of healthy individuals (refer to Berres et al., 2000). This independent sample was a subsample of the healthy participants of the BAsel Study on the ELderly (BASEL; Monsch et al., 2000) cohort. BASEL participants had also been administered either the standard or the challenging battery (Table 2B). The dimension score including the Five-Point Test (Regard et al., 1982) was standardized with only 282 independent participants who had completed the standard battery and 277 independent participants who had completed the challenging battery sample, because this test was only introduced later during the course of the BASEL Study. All other dimensions scores were standardized with 590 (standard battery) or 555 (challenging battery) independent, cognitively healthy participants.
Table 2B.
Demographic characteristics of the different study samples: normative study sample (NC) (n = 1145)
| Standard battery | Challenging battery | |
|---|---|---|
| N | 590 | 555 |
| Gender, males (%) | 52 | 45.4 |
| Age ± SD (y) | 68.65 ± 7.66 | 68.32 ± 7.61 |
| Education ± SD (y) | 12.34 ± 2.98 | 12.34 ± 3.00 |
| MMSE ± SD | 28.88 ± 1.13 | 28.92 ± 1.10 |
SD, standard deviation; MMSE, mini mental status examination (Folstein et al., 1975); NC, normal controls.
To examine how well the new dimension scores distinguished different diagnostic groups, the dimension scores were tested with the different diagnostic groups used to calculate the dimensions using the Kruskal–Wallis test. We compared patients from the following four diagnostic groups with each other: MCI, AD, FTD and major depression. In the standard battery, the small size of the sample of patients with major depression (only nine patients; Table 2A) precluded such comparisons; therefore, we only compared patients with MCI, AD and FTD with each other. Only five patients with a FTD had completed the challenging battery (refer also to Table 2A). Thus, on the challenging battery, we only compared patients with MCI, AD and major depression with each other. Because only three groups were tested with each battery, Mann–Whitney U-tests could be used for post-hoc comparisons without adjustment of α by applying a closed testing procedure. These analyses were followed up with linear discriminant analyses of the seven dimension scores in the four diagnostic groups (MCI, AD, FTD or major depression). Discriminant analysis allocates an observed vector x to group i, if
where mj is the mean vector for group j and S is the within group covariance matrix. Because the likelihood of x belonging to group i is proportional to exp(−di), the posterior probabilities can be computed by Bayes' formula as
This is the probability that a patient with dimension score x belongs to group i.
Discriminant analyses were conducted for each test battery. Patients were allocated to the diagnostic groups according to the aforementioned rule, which is equivalent to allocating to a group with the highest posterior probability. This allocation is correlated with the correct diagnostic group (i.e., MCI, AD, FTD or major depression).
The classification results from these analyses were tested with a new validation sample of 306 patients who had been examined at the Memory Clinic Basel between August 2011 and August 2012 (Table 2C). This sample only contains data from patients who had received a diagnosis of MCI, AD, FTD or major depression and from whom all data were available. We also conducted a discriminant function analysis to calculate each individual's probability to be classified in one of the four diagnostic groups, and the diagnosis with the highest probability was compared with the diagnosis made in the Memory Clinic.
Table 2C.
Demographic characteristics of the different study samples: Memory Clinic validation sample (n = 306)
| Standard battery | Challenging battery | |
|---|---|---|
| N | 151 | 155 |
| Gender, males (%) | 44.4 | 58.0 |
| Age ± SD (y) | 75.5 ± 7.33 | 68.0 ± 9.8 |
| Education ± SD (y) | 11.54 ± 3.17 | 13.2 ± 2.83 |
| MMSE ± SD | 23.11 ± 4.28 | 28.03 ± 2.60 |
| Probable AD | 94 | 24 |
| MCI | 50 | 118 |
| FTD | 3 | 2 |
| Major depression | 4 | 11 |
SD, standard deviation; MMSE, mini mental status examination (Folstein et al., 1975); MCI, mild cognitive impairment; AD, Alzheimer's dementia; FTD, frontotemporal dementia.
Results
In the standard battery, the maximum likelihood factor analysis with promax rotation yielded seven factors (p = 0.142 for the null hypothesis that seven factors are sufficient). The structure of the factor analysis is shown in the matrix of factor loadings in Table 3A. This seven factors solution explained 47.2% of the variance.
Table 3A.
Factor loadings for a seven-factor model of the two test batteries: standard battery
| Factor | |||||||
|---|---|---|---|---|---|---|---|
| Test | 1 | 2 | 3 | 4 | 5 | 6 | 7 |
| CERAD-NAB WL, learning | 0.768 | 0.176 | −0.114 | ||||
| CERAD-NAB WL, recall | 0.938 | 0.121 | |||||
| CERAD-NAB WL, recognition | 0.545 | ||||||
| TMT A | 0.681 | 0.145 | |||||
| TMT B | 0.795 | −0.109 | 0.112 | ||||
| S-words | −0.107 | 0.148 | 0.552 | 0.115 | |||
| Animal fluency | 0.796 | 0.117 | |||||
| CERAD-NAB figures, recall | 0.989 | ||||||
| Stroop, card 1 | 0.112 | 0.932 | |||||
| WMS-R—verbal digit span | |||||||
| Forward | 0.694 | ||||||
| WMS-R—verbal digit span | |||||||
| Backward | 0.591 | 0.104 | |||||
| WMS-R—Corsi block | |||||||
| Backward | 0.118 | 0.597 | |||||
| BNT | 0.100 | −0.122 | 0.495 | ||||
| CERAD-NAB figures, copy | 0.180 | 0.110 | 0.201 | 0.268 | |||
| WMS-R—Corsi block, | |||||||
| Forward | −0.102 | 0.400 | |||||
| Stroop, card 3/1 | −0.335 | 0.198 | |||||
| Five-Point Test | 0.486 | −0.156 | |||||
| CERAD-NAB WL, intrusions | 0.303 | −0.156 | |||||
CERAD-NAB, Consortium to Establish a Registry for Alzheimer's Disease–Neuropsychological Assessment Battery (Morris et al., 1988); WMS-R, Wechsler Memory Scale-Revised (Wechsler, 1987; BNT, Boston Naming Test (Kaplan et al., 1983); Trial Making Test A + B, TMT A and B (Spreen and Strauss, 1991).
Loadings that indicate which variables enter dimension scores are emphasized (loadings <0.1 are suppressed and variables sorted according to loadings >0.5).
In the challenging battery, the maximum likelihood factor analysis with promax rotation yielded nine factors (p = 0.141 for the null hypotheses that nine factors are sufficient). However, this solution revealed that four factors included only one variable each. This is undesirable because the goal of the factor analysis is to reduce the variables with the factors, and, as Harman (1976) pointed out, a law or model should be simpler than the data upon which it is based. The factor analysis with eight factors revealed a similar problem: it yielded a factor solution with two factors including only one variable each. Furthermore, the p-value of the eight-factor solution (p = 0.038 for the null hypothesis that eight factors are sufficient) showed that the data would be better explained with more factors. The factor analysis with seven factors had a p < 0.0001 (for the null hypotheses that seven factors are sufficient) suggesting that, also in this case, the data would be better explained by a greater number of factors. However, the seven-factor solution appears clinically best interpretable (Table 3B), and it corresponds closely to the seven factors of the standard battery. This seven factors solution explained 56.8% of the variance.
Table 3B.
Factor loadings for a seven-factor model of the two test batteries: challenging battery
| Factor | |||||||
|---|---|---|---|---|---|---|---|
| Test | 1 | 2 | 3 | 4 | 5 | 6 | 7 |
| CVLT, learning | 0.810 | 0.151 | |||||
| CVLT, recall | 0.976 | ||||||
| CVLT, recognition | 0.745 | 0.106 | |||||
| TMT A | 0.936 | ||||||
| TMT B | 0.850 | 0.118 | |||||
| S-words | 0.759 | 0.105 | |||||
| Animal fluency | 0.854 | ||||||
| WMS-R—verbal digit span | |||||||
| Forward | 0.910 | ||||||
| WMS-R—verbal digit span | |||||||
| Backward | 0.618 | ||||||
| WMS-R—Corsi block | |||||||
| Backward | 1.068 | ||||||
| Rey-figure, recall | 0.962 | ||||||
| Stroop, card 3/1 | 0.119 | 0.128 | 0.755 | ||||
| Stroop, card 1 | 0.285 | 0.235 | 0.156 | −0.418 | |||
| BNT | 0.286 | 0.191 | |||||
| Rey-figure, copy | 0.165 | 0.431 | |||||
| WMS-R—Corsi block | |||||||
| Forward | 0.303 | 0.117 | 0.255 | ||||
| Five-Point Test | −0.101 | 0.425 | 0.364 | ||||
| CVLT, intrusions | 0.291 | ||||||
WMS-R, Wechsler Memory Scale-Revised (Wechsler, 1987); CVLT, California Verbal Learning Test (Delis et al., 1987); BNT, Boston Naming Test (Kaplan et al., 1983); Trial Making Test A + B, TMT A and B (Spreen and Strauss, 1991).
Loadings that indicate which variables enter dimension scores are emphasized (loadings <0.1 are suppressed and variables sorted according to loadings >0.5).
The seven factors were labeled according to the cognitive functions assessed by the tests that loaded highly on them.
To determine the final cognitive dimension scores, the z-scores of all variables, which loaded highly on one factor (highlighted in Table 3A and 3B), were added and divided by the standard deviation of the cognitively healthy sample (Table 2B). The seven cognitive dimensions resulting from these calculations and their corresponding z-score formulae are shown in Table 4. Both test batteries yielded the same factor structure.
Table 4.
The seven cognitive dimensions and their z-scores
| Cognitive dimension | z-scores |
|---|---|
| 1. Verbal attention | (WMS-R–verbal digit span, forward + WMS-R–verbal digit span, backward)/1.86 |
| 2. Visual attention | (WMS-R–Corsi block, forward + WMS-R–Corsi block, backward)/1.57 |
| 3. Verbal learning and memory | Standard battery |
| CERAD-NAB Word List, learning + CERAD-NAB Word List, delayed recall + CERAD-NAB Word List, recognition + CERAD-NAB Word List, intrusions)/2.86 | |
| Challenging battery | |
| (CVLT, learning + CVLT, long delay free recall + CVLT, recognition + CVLT, free recall intrusions)/3.04 | |
| 4. Visual learning and memory | Standard battery |
| (CERAD-NAB figures, copy + CERAD-NAB figures, delayed recall)/1.72 | |
| Challenging battery | |
| (Rey-figure, copy + Rey-figure, delayed recall)/1.64 | |
| 5. Verbal language production | (Animal fluency + S-words + BNT)/2.07 |
| 6. Executive motor ability | (TMT A + TMT B + Five-Point Test)/2.09 |
| 7. Executive visual ability | (Stroop, card 1 − Stroop, card 3/1)/1.68 |
WMS-R, Wechsler Memory Scale-Revised (Wechsler, 1987); CERAD-NAB, Consortium to Establish a Registry for Alzheimer's Disease–Neuropsychological Assessment Battery (Morris et al., 1988); CVLT, California Verbal Learning Test (Delis et al., 1987); BNT, Boston Naming Test (Kaplan et al., 1983); Trial Making Test A + B, TMT A and B (Spreen and Strauss, 1991).
Comparisons of the seven cognitive dimensions between the diagnostic groups revealed that some cognitive dimensions from the two test batteries distinguished between the diagnostic groups (Table 5A and 5B and Figure 1(A)). In the standard battery, five of the seven cognitive dimensions distinguished significantly between the diagnostic groups (verbal attention, verbal learning and memory, visual learning and memory, verbal language production and executive visual ability). Because of the small sample size of the FTD group of patients, the differences between the cognitive dimensions of this group and the dimensions of the other patient groups did not reach significance; also, the differences were numerically large. In the challenging battery, also five of the seven cognitive dimensions differed significantly between patient groups (visual attention, verbal learning and memory, visual learning and memory, verbal language production and executive motor ability).
Table 5A.
Cognitive dimension scores of the four diagnostic groups, post-hoc comparisons and diagnostic accuracies: standard battery
| Cognitive dimension | MCI (n = 215) | Probable AD (n = 241) | FTD (n = 14) | p-value | Post-hoc comparisons (p < 0.05) |
|---|---|---|---|---|---|
| Verbal attention | −0.86 (0.77) | −0.70 (0.83) | −1.09 (0.93) | 0.024 | MCI < ADa |
| Visual attention | −1.11 (0.98) | −1.24 (0.98) | −1.05 (1.13) | 0.292 | n.s. |
| Verbal learning and memory | −1.32 (1.16) | −2.89 (1.02) | −2.13 (1.32) | <0.001 | MCI > FTD = AD |
| Visual learning and memory | −1.06 (1.05) | −1.43 (0.94) | −1.36 (1.09) | <0.001 | MCI > ADa |
| Verbal language production | −0.89 (1.09) | −1.35 (1.09) | −3.18 (2.01) | <0.001 | MCI > AD > FTD |
| Executive motor ability | −1.52 (1.19) | −1.68 (1.18) | −2.04 (1.55) | 0.168 | n.s. |
| Executive visual ability | 0.13 (1.26) | 0.11 (1.27) | −1.07 (1.52) | 0.015 | MCI = AD > FTD |
| Diagnostic accuracies | |||||
| Predicted diagnosis | |||||
| MCI | 158 (74%) | 41 (17%) | 6 (43%) | ||
| Probable AD | 56 (26%) | 199 (83%) | 2 (14%) | ||
| FTD | 1 (1%) | 1 (0%) | 6 (43%) | ||
AD, Alzheimer's dementia; MCI, mild cognitive impairment; FTD, frontotemporal dementia; n.s., not significant.
Values are mean z-scores (standard deviation). The p-values are from the Kruskal–Wallis tests with Monte Carlo method, the post-hoc comparisons from the Man–Whitney U-tests.
All other comparisons are not significant.
Table 5B.
Cognitive dimension scores of the four diagnostic groups, post-hoc comparisons and diagnostic accuracies: challenging battery
| Cognitive dimension | Major depression (n = 75) | MCI (n = 468) | Probable AD (n = 90) | p-value | Post-hoc comparisons (p < 0.05) |
|---|---|---|---|---|---|
| Verbal attention | −0.55 (1.00) | −0.54 (0.88) | −0.60 (0.91) | 0.994 | n.s. |
| Visual attention | −0.55 (1.25) | −0.66 (1.08) | −1.21 (1.01) | <0.001 | MCI = MD > AD |
| Verbal learning and memory | −1.19 (1.42) | −1.48 (1.38) | −2.89 (1.23) | <0.001 | MD > MCI > AD |
| Visual learning and memory | −0.17 (1.24) | −0.44 (1.13) | −1.28 (1.18) | <0.001 | MCI = MD > AD |
| Verbal language production | −0.44 (1.15) | −0.52 (1.07) | −1.19 (1.12) | <0.001 | MCI = MD > AD |
| Executive motor ability | −0.85 (1.59) | −0.78 (1.29) | −1.72 (1.48) | <0.001 | MCI = MD > AD |
| Executive visual ability | 0.09 (1.13) | 0.08 (1.08) | 0.24 (1.03) | 0.151 | n.s. |
| Diagnostic accuracies | |||||
| Predicted diagnosis | |||||
| Major depression | 12 (16%) | 29 (6%) | 4 (4%) | ||
| MCI | 60 (80%) | 406 (87%) | 73 (81%) | ||
| Probable AD | 1 (1%) | 28 (6%) | 13 (14%) | ||
AD, Alzheimer's dementia; MCI, mild cognitive impairment; n.s., not significant.
Values are mean z-scores (standard deviation). The p-values are from the Kruskal–Wallis tests with Monte Carlo method, the post-hoc comparisons from the Man–Whitney U-tests.
Figure 1.
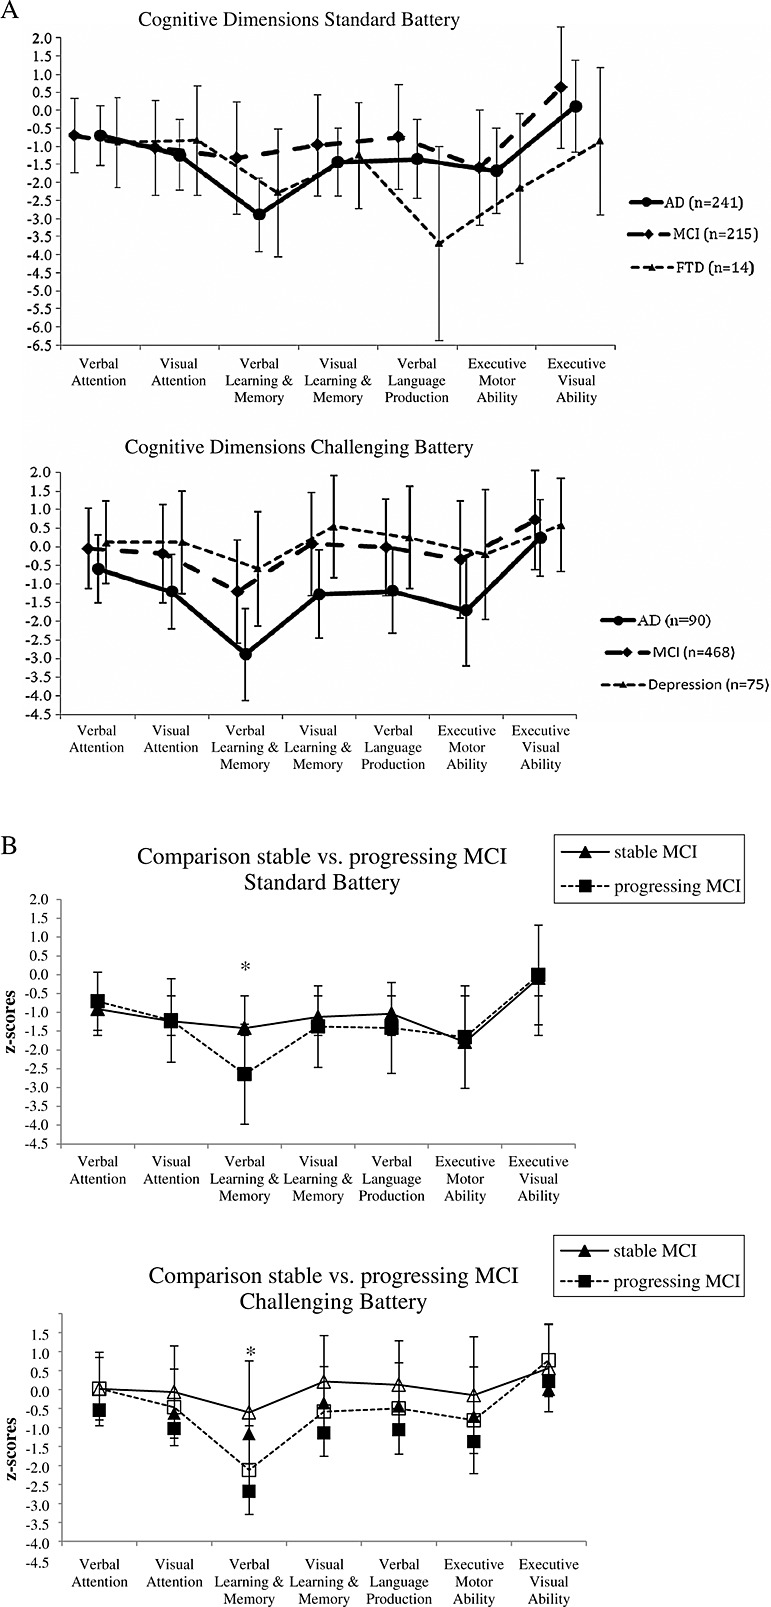
(A) Line charts of the cognitive dimension scores (with standard deviations) compared between patients with mild cognitive impairment (MCI), Alzheimer's dementia (AD) and frontotemporal dementia (FTD) (in the standard battery) and between patients with a MCI, AD and major depression (in the challenging battery). (B) Line charts of the cognitive dimension scores (with standard deviations) compared patients with stable MCI with patients with progressing MCI (*p < 0.01).
The diagnostic accuracies based on the cognitive dimensions are also shown in Table 5A and 5B. Because of the small sample size of patients with depression in the standard battery and of FTD patients in the Challenging battery, we only calculated the correct classification for these patients in one of the two batteries. The results revealed that the cognitive dimensions are able to distinguish between groups of patients with various types of dementia and between patients with dementia and those with major depression. In summary, the cognitive dimensions in the two test batteries that distinguish best between patients with MCI and those with AD are the two memory dimensions (verbal learning and memory and visual learning and memory) and the language dimension (verbal language production). Furthermore, verbal learning and memory from the Challenging battery was the single cognitive dimension that distinguished between the patients with major depression and patients with MCI. To distinguish between patients with MCI or AD and patients with FTD, the language dimension (verbal language production) and one of the executive function dimensions (executive visual ability) showed the best discriminability.
Further post-hoc analyses were made to test if the cognitive dimensions are able to differentiate those patients with MCI from the Memory Clinic study sample (Table 2A) at greater risk of progressing from MCI to dementia (progressing MCI) from those who remain stable or regress to a cognitively healthy state (stable MCI; Table 6. In both test batteries, results indicated that progressing MCI showed significant worse scores in the verbal learning and memory dimension compared with stable MCI patients (p < 0.001; Figure 1 (B)). The difference in the observation periods between progressing MCI and stable MCI is significant (p < 0.001). Thus, the results with respect to this distinction must be interpreted with great caution. To see if the different subtypes of MCI patients (Table 2A) differ in their cognitive dimension profiles, discriminant analyses were conducted. We refer to the Supplementary Material for these results.
Table 6.
Demographic characteristics of the MCI subsample (n = 683)
| Stable MCI | Progressing MCI | |
|---|---|---|
| Standard battery | ||
| N | 174 | 41 |
| Age ± SD (y) | 72.1 ± 8.71 | 75.3 ± 5.34 |
| Gender, males (%) | 47.1 | 58.5 |
| Time between baseline and diagnosis ± SD (months) | 6.17 ± 13.7 | 24.1 ± 14.8 |
| (stable: MCI or NC; progressive: dementia) | ||
| Challenging Battery | ||
| N | 436 | 32 |
| Age ± SD (y) | 65.1 ± 9.79 | 74.1 ± 6.07 |
| Gender, males (%) | 41.1 | 59.4 |
| Time between baseline and diagnosis ± SD (months) | 8.65 ± 15.6 | 21.4±12.8 |
| (stable: MCI or NC; progressive: dementia) |
SD, standard deviation; MCI, mild cognitive impairment; NC, normal controls.
Discriminant analyses were conducted to calculate the probability that a new patient is classified in the correct diagnostic group based on the cognitive dimension scores. The validation of correct classification by means of the cognitive dimension scores revealed that the cognitive dimension scores of the standard battery were good in classifying MCI (82.0%) and AD (83.0%) patients in the correct diagnosis group. In the challenging battery, the cognitive dimension scores demonstrated a near-perfect performance in classifying patients with MCI (99.2%) but classified only 20.8% of AD patients correctly (all others were classified as MCI subjects). No valid statements can be made regarding the classification of patients with FTD or with major depression as these samples were too small.
Discussion
This study found seven-factor solutions in two slightly different test batteries to reduce a variety of interrelated neuropsychological test results. The seven cognitive dimensions found in both tests batteries were verbal attention, visual attention, verbal learning and memory, visual learning and memory, verbal language production, executive motor ability and executive visual ability. On the basis of data from an independent sample of normal control participants, it was possible to create formulae with standard scores (z-score) for each cognitive dimension. These formulae allow for an easier characterization and interpretation of a subject's cognitive performance. Furthermore, the comparison between the different diagnostic groups showed that the cognitive dimensions in both test batteries are able to separate patients with different forms of dementia and patients with major depression. An additional analysis revealed that the new dimension scores were able to distinguish new samples of patients with MCI from patients with AD with high accuracy.
These findings are in line with a number of other studies examining the intrinsic structure of neuropsychological test batteries with dementia patients that also found five or more cognitive dimensions (e.g., Chapman et al., 2010a, 2010b; Dowling et al., 2010; Ownby et al., 2004; refer also to Supplementary Table). Looking at these different studies, the divergent findings in factor solutions may be due to different patient groups (i.e., MCI versus AD versus mixed samples (refer to Siedlecki et al., 2008)), different stages of dementia (mild versus advanced), different kinds of statistical analyses (e.g., confirmatory versus exploratory factor analysis versus principal component analysis (Dowling et al., 2010)) or the different neuropsychological tests included in the batteries.
To our knowledge, this is the first study to provide formulae to calculate z-scores for cognitive dimensions, which can be used in clinical and research settings. We found that these cognitive dimension z-scores from the four diagnoses of interest (MCI, AD, FTD and major depression) were able to significantly distinguish between the different diagnostic groups (Table 5A and 5B and Figure 1(A)) and that the dimension verbal learning and memory can discriminate patients with stable MCI from patients with progressing MCI (Figure 1(B)). Furthermore, these cognitive dimensions represent an elegant solution to practical issues in the clinical and research environment. Compared with the wide range of interrelated cognitive variables or to a single summary score, they are more likely to be able to show clinical courses of cognitive impairments or treatment responses in specific cognitive domains.
To validate these results, we tested the dimensions in a new sample of patients and found that the probability for a given patient to be categorized as MCI or AD on the basis of the seven cognitive dimensions was high in both test batteries. Regarding patients with a FTD or with major depression, there cannot be made any valid statement as the samples of these patients were too small.
A limitation of the present study is that the diagnostic accuracy of the cognitive dimensions may be partially overestimated: The neuropsychological data used to calculate the dimension scores were available to clinicians during the diagnostic process. This partial circularity may have artificially heightened the diagnostic accuracy of the cognitive dimensions.
In the present study, we identified meaningful and reliable dimensions of cognitive performance and created z-scores for these dimensions in order to produce a common metric among the dimensions. Further analyses revealed that these cognitive dimensions can separate between patients with different types of dementia and patients with major depression and that the new dimension scores were able to distinguish new samples of patients with MCI from patients with AD with high accuracy. These results demonstrate that the cognitive dimensions are a useful neuropsychological diagnostic, as the ability to define the latent structure minimizes redundancy, increases the reliability of measures and reduces the risk of type I error because of multiple comparisons. The cognitive dimensions found in this study allow clinicians to avoid assuming a single test score represents a single cognitive dimension and instead permit remapping of a patient's test battery results to fewer cognitive dimension scores, thereby facilitating the interpretation and communication of the results.
Conflict of interest
None declared.
Key points.
Factor analyses identified seven cognitive dimensions underlying the cognitive tests in two slightly different neuropsychological test batteries.
The calculated formulae with standard scores (z-scores) for each cognitive dimension allow an easier characterization and interpretation of a subject's cognitive performance.
The cognitive dimensions are able to separate patients with different forms of dementia and patients with a major depression.
The dimension scores distinguish new samples of patients with mild cognitive impairment from patients with Alzheimer's dementia with high accuracy.
Acknowledgments
This work was supported by the Swiss National Science Foundation [NF 32–49107.96], the Novartis Foundation, Basel, Switzerland, and the VELUX Foundation. We thank Kirsten I. Taylor for her editorial help.
Supporting Information
Additional supporting informationmay be found in the online version of this article at the publisher's web site.
References
- Albert MS, DeKosky ST, Dickson D, et al. The diagnosis of mild cognitive impairment due to Alzheimer's disease: recommendations from the National Institute on Aging and Alzheimer's Association Workgroup. Alzheimers Dement. 2011;7:270–279. doi: 10.1016/j.jalz.2011.03.008. [DOI] [PMC free article] [PubMed] [Google Scholar]
- American Psychiatric Association. DSM IV: Diagnostic and Statistical Manual of Mental Disorders. Washington, DC: American Psychiatric Press; 1994. [Google Scholar]
- Beck AT, Ward CH, Mendelson M, Mock J, Erbaugh J. An inventory for measuring depression. Arch Gen Psychiatry. 1961;4:561–571. doi: 10.1001/archpsyc.1961.01710120031004. [DOI] [PubMed] [Google Scholar]
- Berres M, Monsch AU, Bernasconi F, Thalmann B, Stähelin HB. Normal ranges of neuropsychological tests for the diagnosis of Alzheimer's disease. Stud Health Tech Informat. 2000;77:195–199. [PubMed] [Google Scholar]
- Berres M, Zehnder A, Bläsi S, Monsch AU. Evaluation of diagnostic scores with adjustment for covariates. Stat Med. 2008;27:1777–1790. doi: 10.1002/sim.3120. [DOI] [PubMed] [Google Scholar]
- Chapman RM, Mapstone M, McCrary JW, et al. Cognitive dimensions in Alzheimer's disease, mild cognitive impairment, and normal elderly: developing a common metric. Open Geriatr Med J. 2010a;3:1–10. doi: 10.2174/1874827901003010001. [DOI] [PMC free article] [PubMed] [Google Scholar]
- Chapman RM, Mapstone M, Porsteinsson AP, et al. Diagnosis of Alzheimer's disease using neuropsychological testing improved by multivariate analyses. J Clin Exp Neuropsychol. 2010b;32:793–808. doi: 10.1080/13803390903540315. [DOI] [PMC free article] [PubMed] [Google Scholar]
- Christensen H, Griffiths K, MacKinnon A, Jacomb P. A quantitative review of cognitive deficits in depression and Alzheimer-type dementia. J Int Neuropsychol Soc. 1997;3:631–651. [PubMed] [Google Scholar]
- De Jager CA, Hogervorst E, Combrinck M, Budge MM. Sensitivity and specificity of neuropsychological tests for mild cognitive impairment, vascular cognitive impairment and Alzheimer's disease. Psychol Med. 2003;33:1039–1050. doi: 10.1017/s0033291703008031. [DOI] [PubMed] [Google Scholar]
- Delis DC, Kramer JH, Kaplan E, Ober BA. California Verbal Learning Test: Adult Version. San Antonio, TX: The Psychological Corporation; 1987. [Google Scholar]
- Dowling NM, Hermann B, La Rue A, Sager MA. Latent structure and factorial invariance of a neuropsychological test battery for the study of preclinical Alzheimer's disease. Neuropsychology. 2010;24:742–756. doi: 10.1037/a0020176. [DOI] [PMC free article] [PubMed] [Google Scholar]
- Dubois B, Feldman HH, Jacova C, et al. Research criteria for the diagnosis of Alzheimer's disease: revising the NINCDS-ADRDA criteria. Lancet Neurol. 2007;26:734–746. doi: 10.1016/S1474-4422(07)70178-3. [DOI] [PubMed] [Google Scholar]
- Ehrensperger MM, Berres M, Taylor KI, Monsch AU. Early detection of Alzheimer's disease with a total score of the German CERAD. J Int Neuropsychol Soc. 2010;16:910–920. doi: 10.1017/S1355617710000822. [DOI] [PubMed] [Google Scholar]
- Folstein MF, Folstein SE, McHugh PR. “Mini-mental state”—a practical method for grading the cognitive state of patients for the clinician. J Psychiatr Res. 1975;12:189–198. doi: 10.1016/0022-3956(75)90026-6. [DOI] [PubMed] [Google Scholar]
- Gianotti G, Marra C. Some aspects of memory disorders clearly distinguish dementia of the Alzheimer's type from depressive pseudo-dementia. J Clin Exp Neuropsychol. 1994;16:65–78. doi: 10.1080/01688639408402617. [DOI] [PubMed] [Google Scholar]
- Harman HH. Modern Factor Analysis. Chicago: University of Chicago; 1976. 3rd edn. [Google Scholar]
- Harrison J, Minassian SL, Jenkins L, et al. A neuropsychological test battery for use in Alzheimer disease clinical trials. Arch Neurol. 2007;64:1323–1329. doi: 10.1001/archneur.64.9.1323. [DOI] [PubMed] [Google Scholar]
- Isaacs B, Kennie AT. The set test as an aid to the detection of dementia in old people. Brit J Psychiat. 1973;23:467–470. doi: 10.1192/bjp.123.4.467. [DOI] [PubMed] [Google Scholar]
- Kaplan E, Goodglass H, Weintraub S. Boston Naming Test. Philadelphia: Lea & Febiger; 1983. [Google Scholar]
- Künig G, Jäger M, Stief V, et al. The impact of the CERAD-NP on diagnosis of cognitive deficiencies in late onset depression and Alzheimer's disease. Int J Geriatr Psychiatry. 2006;21:911–916. doi: 10.1002/gps.1579. [DOI] [PubMed] [Google Scholar]
- Lambon Ralph MA, Patterson K, Graham N, Dawson K, Hodges JR. Homogeneity and heterogeneity in mild cognitive impairment and Alzheimer's disease a cross-sectional and longitudinal study of 55 cases. Brain. 2003;126:2350–2363. doi: 10.1093/brain/awg236. [DOI] [PubMed] [Google Scholar]
- Lannfelt L, Blennow K, Zetterberg H, et al. Safety, efficacy, and biomarker findings of PBT2 in targeting Aβ as a modifying therapy for Alzheimer's disease a phase IIa, double-blind, randomized, placebo-controlled trial. Lancet Neurol. 2008;7:779–786. doi: 10.1016/S1474-4422(08)70167-4. [DOI] [PubMed] [Google Scholar]
- Levy JA, Chelune GJ. Cognitive-behavioral profiles of neurodegenerative dementias: beyond Alzheimer's disease. J Geriatr Psych Neur. 2007;20:227–238. doi: 10.1177/0891988707308806. [DOI] [PubMed] [Google Scholar]
- McKhann G, Drachman D, Folstein M, et al. Clinical diagnosis of Alzheimer's disease: report of the NINCDS-ADRDA work group under the auspices of department of health and human services task force on Alzheimer's disease. Neurology. 1984;34:939–944. doi: 10.1212/wnl.34.7.939. [DOI] [PubMed] [Google Scholar]
- McKhann GM, Knopman DS, Chertkow H, et al. The diagnosis of dementia due to Alzheimer's disease: recommendations from the National Institute on Aging and the Alzheimer's Association Workgroup. Alzheimers Dement. 2011;7:263–269. doi: 10.1016/j.jalz.2011.03.005. [DOI] [PMC free article] [PubMed] [Google Scholar]
- Monsch AU, Thalmann B, Schneitter M, et al. The Basel study on the elderly's search for preclinical cognitive markers of Alzheimer's disease. Neurobiol Aging. 2000;21:31. [Google Scholar]
- Morris JC, Mohs RC, Rogers H, Fillenbaum G, Heyman A. Consortium to establish a registry for Alzheimer's disease (CERAD) clinical and neuropsychological assessment of Alzheimer's disease. Psychopharmacol Bull. 1988;24:641–652. [PubMed] [Google Scholar]
- Neary D, Snowden JS, Gustafson L, et al. Frontotemporal lobar degeneration a consensus on clinical diagnostic criteria. Neurology. 1998;51:1546–1554. doi: 10.1212/wnl.51.6.1546. [DOI] [PubMed] [Google Scholar]
- Ownby RL, Loewenstein DA, Schram L, Acevedo A. Assessing the cognitive abilities that differentiate patients with Alzheimer's disease from normals: single and multiple factor models. Int J Geriatr Psychiatry. 2004;19:232–242. doi: 10.1002/gps.1056. [DOI] [PubMed] [Google Scholar]
- Perry RJ, Hodges JR. Differentiating frontal and temporal variant frontotemporal dementia from Alzheimer's disease. Neurology. 2000;54:2277–2284. doi: 10.1212/wnl.54.12.2277. [DOI] [PubMed] [Google Scholar]
- Rascovsky K, Salmon DP, Hansen LA, Thal LJ, Galasko D. Disparate phonemic and semantic fluency deficits in autopsy-confirmed frontotemporal dementia and Alzheimer's disease. Neuropsychology. 2007;21:20–30. doi: 10.1037/0894-4105.21.1.20. [DOI] [PubMed] [Google Scholar]
- Regard M, Strauss E, Knapp P. Children's production on verbal and nonverbal fluency tasks. Percept Mot Skill. 1982;55:839–844. doi: 10.2466/pms.1982.55.3.839. [DOI] [PubMed] [Google Scholar]
- Rey A. L'examen psychologique dans les cas d'encephalopathie traumatique. Arch Psychol. 1941;28:286–340. [Google Scholar]
- Romàn GC, Tatemichi TK, Erkinjuntti T, et al. Vascular dementia: diagnostic criteria for research studies. Report of the NINDS-AIREN International Workshop. Neurology. 1993;43:250–260. doi: 10.1212/wnl.43.2.250. [DOI] [PubMed] [Google Scholar]
- Rosen WG, Mohs RC, Davis KL. A new rating scale for Alzheimer's disease. Am J Psychiat. 1984;141:1356–1364. doi: 10.1176/ajp.141.11.1356. [DOI] [PubMed] [Google Scholar]
- Sheikh JI, Yesavage JA. Geriatric Depression Scale (GDS): recent evidence and development of a shorter version. Clin Gerontol. 1986;5:165–173. [Google Scholar]
- Siedlecki KL, Honig LS, Stern Y. Exploring the structure of a neuropsychological battery across healthy elders and those with questionable dementia and Alzheimer's disease. Neuropsychology. 2008;22:400–411. doi: 10.1037/0894-4105.22.3.400. [DOI] [PMC free article] [PubMed] [Google Scholar]
- Spreen O, Benton AL. Neurosensory Centre Comprehensive Examination for Aphasia. Victoria: University of Victoria; 1977. [Google Scholar]
- Spreen O, Strauss E. A Compendium of Neuropsychological Tests. New York, NY: Oxford University Press; 1991. 2nd edn. [Google Scholar]
- Stroop JR. Studies of interference in serial verbal reaction. J Clin Exp Neuropsychol. 1935;18:643–662. [Google Scholar]
- Vellas B, Black R, Thal LJ, et al. Long-term follow-up of patients immunized with AN1792: reduced functional decline in antibody responders. Curr Alzheimer Res. 2009;6:144–151. doi: 10.2174/156720509787602852. [DOI] [PMC free article] [PubMed] [Google Scholar]
- Wechsler D. Wechsler Memory Scale-Revised. New York: Psychological Corporation; 1987. [Google Scholar]
- Winblad B, Palmer K, Kivipelto M, et al. Mild cognitive impairment—beyond controversies, towards a consensus: report of the International Working Group on mild cognitive impairment. J Intern Med. 2004;256:240–246. doi: 10.1111/j.1365-2796.2004.01380.x. [DOI] [PubMed] [Google Scholar]
Associated Data
This section collects any data citations, data availability statements, or supplementary materials included in this article.
Supplementary Materials
Additional supporting informationmay be found in the online version of this article at the publisher's web site.