

Abstract
Aim
This paper presents a discussion of classification and regression tree analysis and its utility in nursing research.
Background
Classification and regression tree analysis is an exploratory research method used to illustrate associations between variables not suited to traditional regression analysis. Complex interactions are demonstrated between covariates and variables of interest in inverted tree diagrams.
Design
Discussion paper.
Data sources
English language literature was sourced from eBooks, Medline Complete and CINAHL Plus databases, Google and Google Scholar, hard copy research texts and retrieved reference lists for terms including classification and regression tree* and derivatives and recursive partitioning from 1984–2013.
Discussion
Classification and regression tree analysis is an important method used to identify previously unknown patterns amongst data. Whilst there are several reasons to embrace this method as a means of exploratory quantitative research, issues regarding quality of data as well as the usefulness and validity of the findings should be considered.
Implications for Nursing Research
Classification and regression tree analysis is a valuable tool to guide nurses to reduce gaps in the application of evidence to practice. With the ever-expanding availability of data, it is important that nurses understand the utility and limitations of the research method.
Conclusion
Classification and regression tree analysis is an easily interpreted method for modelling interactions between health-related variables that would otherwise remain obscured. Knowledge is presented graphically, providing insightful understanding of complex and hierarchical relationships in an accessible and useful way to nursing and other health professions.
Keywords: classification tree, data analysis, data mining, decision tree, nursing research, recursive partitioning, regression tree, research method
Why is this research or review needed?
Classification and regression tree analysis is a relatively new tool of research available to nursing.
An understanding of classification and regression tree method will empower clinicians and scholars privy to the nuances of their profession to interrogate large data sets for attributes meaningful to nursing practice.
Like all research methods, researchers need to be cognizant of classification and regression tree analyses' strengths as well as weaknesses.
What are the three key findings?
Classification and regression tree software can handle large volumes of data, explicating previously concealed links among important patient, management and outcome variables.
Classification and regression tree method is a useful exploratory form of research capable of providing insights into what is happening across whole populations from large databases and may be used to develop models to evaluate and improve care, stratify risk and determine prognoses.
As with all research methods, there are several limitations in classification and regression tree analysis; it will not replace other quantitative methods, but will complement these and enhance our nursing knowledge base.
How should the findings be used to influence policy/practice/research/education?
Classification and regression tree analysis allows the researcher to question practice and outcomes on large data sets collected on whole populations. It may be used to improve research questions and inform future research agendas to improve evidence-based practice.
Classification and regression tree analysis should be used to more fully use available data sets to inform targeted research towards fulfilling national research priorities.
Database research is an important means for nurse researchers, clinicians and managers to evaluate what is working for patients across healthcare systems in terms of processes and equity of care, enabling them to advocate, educate and rectify any management gaps through refining models of contemporary care.
Introduction
New databases are regularly developed with existing ones expanding at an exponential rate in this data-rich society. Healthcare databases are numerous, extensive and growing prodigiously. They provide rich, relatively untapped sources of important quantitative information about patient populations, patterns of care and outcomes. To overlook them in nursing research would be a missed opportunity to add to existing nursing knowledge, generate new knowledge empirically and improve patient care and outcomes.
There are numerous methods for analysing quantitative data; each requires careful selection to suit the unique aims of each project of research. The aim of this paper is to describe classification and regression tree (CaRT) analysis and to highlight the benefits and limitations of this method for nursing research.
Background
Healthcare databases are large repositories of information that include a variety of clinical and administrative information and, although not specifically designed for the purpose, may be useful for secondary data analysis (Magee et al. 2006). Data sets, the collections of data in the databases, can be analysed to determine the influences on, and differences between, selected variables (Williams 2011) answering many questions. Patterns uncovered can inform health care and build knowledge, providing that research questions are well formulated and the extraction well planned and executed. Like all research methods, a conceptual fit is necessary between the data set and data analysis.
Fitting within the burgeoning framework of ‘big data’ (Mayer-Schönberger & Cukier 2013), CaRT analysis is an important component of data mining (Williams 2011), a means of exploring and analysing large data sets in search of meaningful patterns (Hurwitz et al. 2013). CaRT has become increasingly prevalent internationally since the sentinel work by Breiman et al. (1984). To date, the method has been used infrequently by nurse researchers (Bonner 2001, Dowding & Thompson 2004); however, we believe that, as the utility of the CaRT method becomes better known and research using large data sets gains momentum, its implementation will become commonplace in nursing research. It will provide new insights into community-wide healthcare systems in relation to patterns of care delivery and outcomes, including prognoses in any country in which health data are maintained.
CaRT method has been lauded because of its ability to overcome missing data by use of surrogate measures (Lamborn et al. 2004). Missing data are a common occurrence in many data sets, even those developed prospectively for the purpose of specific investigations (Speybroeck 2012); however, it is particularly a problem when working with large administrative and clinical data sets, such as those used in secondary data analysis (Lange & Jacox 1993, Speybroeck 2012).
CaRT is an exploratory method of research used to uncover relationships and produce clearly illustrated associations between variables not amenable to traditional linear regression analysis (Crichton et al. 1997). The method has a long history in market research and has more recently become increasingly used in medicine to stratify risk (Karaolis et al. 2010) and determine prognoses (Lamborn et al. 2004). In addition to quantification of risk, CaRT is an important means for uncovering new knowledge. The method of analysis is ideal for exploratory nursing research, as it may be used to uncover gaps in nursing knowledge and current practice. Through analysis of large data sets, we believe CaRT is capable of providing direction for further healthcare research regarding outcomes of health care, such as cost, quality and equity.
Data sources
This paper was informed by literature on classification and regression tree analysis from 1984, the year Breiman et al. (1984) published the sentinel classification and regression trees text until the time of writing this article in January 2013. Data sources included the online journal databases; MEDLINE Complete, CINAHL Plus full text and the eBooks databases; in addition to hardcopy research reference texts. The online facilities Google Scholar and Google were searched and reference lists of articles and books found to be pertinent to understanding the method or its use in the context of health care were also searched manually. A full list of search terms, the strategy used and the final number of articles incorporated into the development of this review are included in Figure 1. The search was restricted to English language articles and books.
Figure 1.
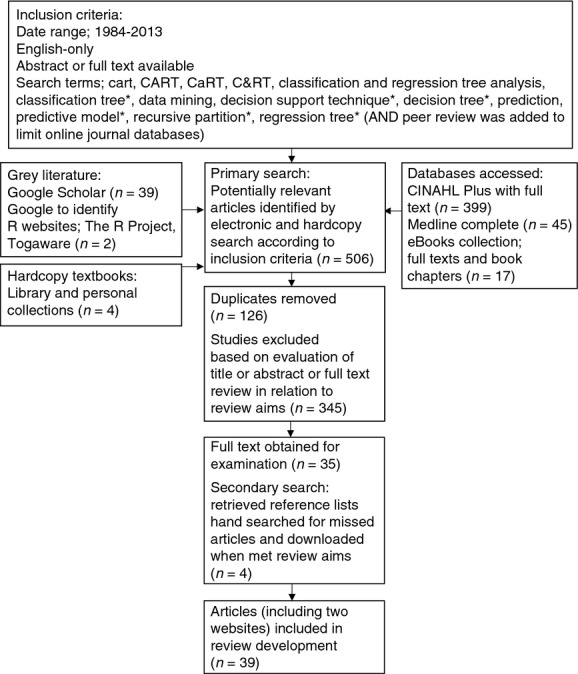
Flow chart of search method and results.
Discussion
Classification and regression trees
CaRT is a computationally intensive (Crawley 2007) exploratory, non-parametric (Breiman et al. 1984) procedure that makes no distributional assumptions of any kind (Frisman et al. 2008). It does not require a pre-defined underlying relationship between the dependent variable (referred to in CaRT terminology as ‘target’ variable) and the independent variables (‘predictors’). It does not imply cause-and-effect relationships between variables, but rather statistical associations between them (Leclerc et al. 2009).
CaRT-generating programs are available in several well-recognized commercial statistical computing packages such as SPSS, SAS and STATA, often as add-on modules. A statistical program familiar to the authors is R (R Development core Team 2010). This open-source program is freely downloaded from http://www.r-project.org and comes with the ‘rpart’ command package, enabling the generation of classification and regression trees. Rpart treats a variable preselected by the researcher as the target variable and the others selected as predictors.
Classification and regression tree analysis methodology
Classification and regression trees are labelled according to the dependent variable or variable of interest. Classification trees are used when the target variables are categorical, such as race, patient sex or gender and marital status. Regression trees assume that the outcome or dependent variable is continuous, for instance, age, height and time. Classification trees build classificatory models by asking categorical questions, for instance: ‘Is it going to be hot today?’ The answers are usually binary (‘yes’ or ‘no’), but not always (Williams 2011). They can have more categories such as ‘too hot’, ‘just right’ or ‘too cold’, all of which are classificatory. Regression tree models produce a numeric set of outcomes calculated mathematically by examining relationships between target and predictor variables to determine their mathematical relationship. This formula is then applied to new observations in an attempt to predict likely outcome. Using the same analogy, the outcomes for the day's comfort level would be expressed in Celsius or Fahrenheit scales. Williams (2011) calls this ‘predictive analytics’ (p. 175) and explains that it is carried out to produce both classification and regression tree models. The computer algorithms, therefore, learn (or are ‘trained’) from other related or historical data and their influence on target outcomes and then applies what is learnt to predict subsequent outcomes in new data. This is called ‘machine learning’.
CaRT analysis is often called ‘recursive partitioning’ (Lemon et al. 2003, Fonarow et al. 2005, Strobl et al. 2009) because it forces data to split by algorithm into increasingly smaller and homogenous subsets according to researcher-specified criteria (Crichton et al. 1997). Williams (2011) describes this partitioning as dividing and conquering. All predictor variables are checked at each level for the split that will result in the most pure split nodes (Prasad et al. 2006) according to the algorithm learnt by the machine. The machines are modern computers with increased power to handle large volumes of data. The learnt or trained algorithms of CaRT are repeated and are fitted to data in each partitioned subset by testing all variables in search of the one that results in the cleanest split (Frisman et al. 2008). This separates it from traditional statistical procedures, such as linear regression, which are global models with single predictive formulae (Lemon et al. 2003). With CaRT analysis, each question asked at each step is based on the answer to the previous question (Williams 2011).
Successive variable data, which may be mixed categorical or continuous independent variables, are split into increasingly mutually exclusive or homogenous subgroups in relation to the target variable (Lemon et al. 2003). The algorithm is designed to split and provide the best balance between sensitivity and specificity for predicting the target variable and continues until perfect homogeneity is reached or the researcher-defined limits are reached (Frisman et al. 2008). The final node along each branch contains all of the decisions (Williams 2011). Each corresponds with a specific pathway or set of decisions made by algorithm to navigate through the tree. Hence, the overarching name often given to the structures is ‘decision trees’ (Quintana et al. 2009, Gardino et al. 2010, Williams 2011).
There are several ways purity (which is carried out by calculating impurity) in each node is determined. These are statistical techniques to estimate ‘impurity’ in all predictor variables at each level to predict the largest difference between impurity of the parent node and weighted average of the impurity of the child nodes (Lemon et al. 2003, p. 174). These are the Gini, entropy and minimum error functions (Zhang & Singer 2010). The choice of impurity function and implementation of each are internal to the different statistical programs. Their calculations are beyond the scope of the current paper and interested readers are referred to Breiman et al. (1984) original text or those developed since, including Crichton et al. (1997), Lemon et al. (2003) and Williams (2011) for further explanation. Whichever impurity function is employed, the independent variable whose split has the greatest value is selected for splitting at each step by statistical algorithm (Lemon et al. 2003).
Using the fictitious tree illustrated in Figure 2 as an example, the researcher uses data for 1000 patients who were admitted to Hospital X in 2013 with acute myocardial infarction (AMI) to determine which patient characteristics (predictor variable(s)) are associated with patient age in years (the target variable) at the time of admission. The model is a regression tree because the target variable is continuous. Predictor variables available to build the regression tree are residing distance from Hospital X, patient sex, patient marital status, arrival at hospital by ambulance or private car and health insurance status. When the target variable and predictor variables are selected in the CaRT program, the computer algorithm chooses the variable that offers the most improvement in purity in the node (therefore has the most impurity with the greatest scope for correction by splitting). In this instance, the patient arrival at hospital by ambulance or private car variable provides the greatest splitting value, hence is chosen. There are no more splits fitting the criteria for patients who arrived by private car, hence this becomes a terminal node. For those who arrive by ambulance, the variable that provides the greatest value in splitting is patient sex. The exemplar constitutes an unusually simple and unrealistic tree model, however, the reader can see at a glance that younger patients with AMI tend to arrive by private car. Those patients who are older more often come by ambulance and the majority of those are men, who are much younger, generally, than women. The illustration presents a tree that provides minimal information and seems to have stopped splitting too early to provide much more explanation than simple grouping. The tree appears to be limited to too few splits and to only three levels, but still may uncover new information. It may indicate, for instance, that the message that patients with AMI should call an ambulance for transportation to hospital is not heeded by younger patients, which may guide future spending on media campaigns for AMI.
Figure 2.
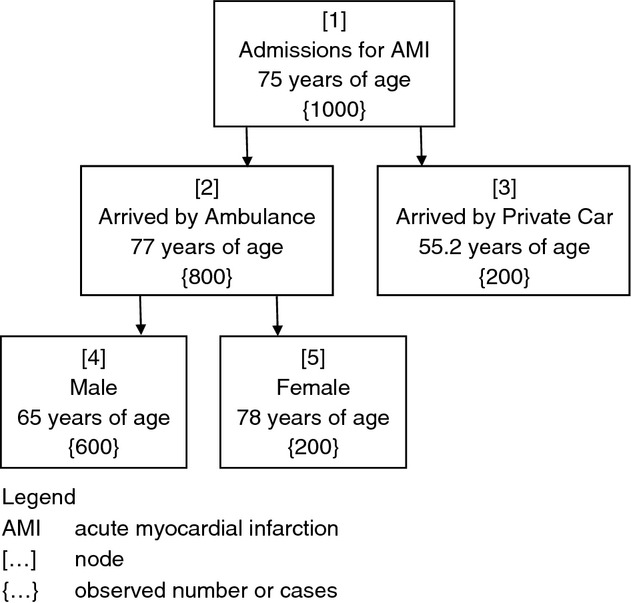
Fictional illustration of a regression tree indicating relationships of variables associated with age at hospitalization for acute myocardial infarction.
The example provided in Figure 2 lacks depth and complexity, yielding less information than may have been uncovered with broadened parameters. The overall level of complexity in CaRT models is determined by the complexity parameter (CP), which controls the number of splits in a tree by defining the minimum benefit that must be gained at each split to make that split worthwhile (Williams 2011). The CP eliminates splits that add little or no value to the tree and, in so doing, provides a stopping rule (Lemon et al. 2003). Set by the researcher, the CP assists the process of pruning a tree by controlling its size (Williams 2011). The parameter is reached using trial and error; the investigator observes trees at different CP levels and decides when no real information gain is made with greater levels of complexity. This is a form of pruning internal to the statistical program involving an iterative process employed by the researcher (Rokach & Maimon 2007).
Pruning is an essential function of CaRT analysis. It is the process of controlling, limiting or reducing a tree's size. Pruning removes sub-branches from overfitted trees to ensure that the tree's remaining components are contributing to the generalization accuracy and ease of interpretability of the final structures (Rokach & Maimon 2007).
This is an important function because reaching absolute homogeneity would result in a huge tree with almost as many nodes as observations and provide no meaningful information for interpretation beyond the initial data set. Large trees are unhelpful and are the result of ‘overfitting’, thereby providing no explanatory power (Crawley 2007). As the intention is to build a useful model, it is important that the components of the tree are able to be matched to new and different data. The more complex model will have good explanatory power for the data set on which it is trained, but will not be useful as a model applied to different data (Williams 2011).
Some researchers describe building a large tree and then employing ‘pruning’ techniques to the structure (Lemon et al. 2003, Fan et al. 2006, Williams 2011, Chang et al. 2012). Several investigators advocate a three-staged procedure: (1) Growing a large tree; (2) Pruning back the tree; and (3) Selecting the best-sized tree (Lemon et al. 2003, Fan et al. 2006, Williams 2011, Chang et al. 2012). The process of adjustment by the researcher ensures that important relationships between predictor variables and the target variable are not missed by growing too small a tree. Researcher involvement in the model built in the final tree is ideal as they are able to observe variables important to the process, but pruned to increase generalizability of the final model. The point at which to prune trees becomes visually evident and the researcher will see at which point the trees become overgrown and erratic. If they are not replicated past a certain point, they are stopped to maintain usefulness of the tree model. Any researcher bias is avoided in the selection process because future analysis would demonstrate a tree without any predictive ability on other data or a tree so overcomplicated, it would be of no use applied to other data and would fail the validation procedure.
To ensure that maximum tree interpretability is accompanied by utility, several other restrictions or stopping criteria are imposed on CaRT construction (Hess et al. 1999, Williams 2011). The stopping criteria are set by the researcher after repeated testing to balance the needs for accuracy of the model with simplicity. These include setting the maximum tree depth, minimum number of cases in terminal nodes, minimum number of cases in child nodes and splitting criteria level, which is set not be higher than a certain threshold (Rokach & Maimon 2007). These are used to control how large a tree is grown and determine the minimal degree of statistical difference between groups considered meaningful (Lemon et al. 2003). Deviance in CaRT models increases if there are too many nodes (Crawley 2007). Important outcomes from the CaRT modelling process are the rules associated with membership to each terminal node data class. All of these rules and settings help determine the components of the model and the final shape of the tree.
Components of the classification and regression tree
At the top of the multilevel inverted tree is the ‘root’ (Figure 3). This is often labelled ‘node 1’ and is generally known as the ‘parent node’ because it contains the entire set of observations to be analysed (Williams 2011). The parent node then splits into ‘child nodes’ that are as pure as possible to the dependent variable (Crichton et al. 1997). If the predictor variable is categorical, then the algorithm will apply either ‘yes’ or ‘no’ (‘if – then’) responses. If the predictor variable is continuous, the split will be determined by an algorithm-derived separation point (Crichton et al. 1997). These splits are sometimes called ‘edges’ (Rokach & Maimon 2007) or ‘branches’ (Williams 2011). The branches bifurcate into non-terminal (interior) or child nodes if they have not reached a homogenous outcome or selected stopping point. The ultimate aim of CaRT analysis is to reach terminal nodes within-node variance statistics. These are also known as ‘leaf’ nodes (Williams 2011) and occur when no new information will be gained through further splitting. Every node in the tree represents a distinct, homogenous data class enabling exploration. All of the nodes are numbered. These are used to illuminate associations otherwise indiscernible by conventional statistical inference and are specific to each portioned variable.
Figure 3.
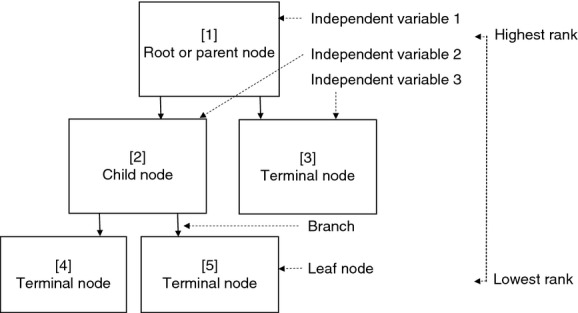
Generic illustration of a regression tree indicating relationship of child and terminal nodes to the root node with branches and level of hierarchy.
Criticisms of classification and regression tree methodology
An important criticism aimed at CaRT analysis is its inherent instability (Rokach & Maimon 2007, Protopopoff et al. 2009, Su et al. 2011). Small changes in data can alter a tree's appearance drastically and thereby alter the interpretation of the tree if not managed with caution. This is because, if a split changes, all splits subsequent to the affected node are changed as well. Each optimal partition depends on the path already taken through the tree (Crichton et al. 1997). Rokach and Maimon (2007) describe this oversensitivity in classification and regression trees as a ‘greedy characteristic’ (p. 75) and caution against irrelevant attributes and noise affecting training data sets. Crawley (2007) cites ‘over-elaboration’ as a problem with the trees because of their ability to respond to random features in data (p. 690). For this reason, the process of CaRT tree building is not as fast as it appears on the computer-generated outputs. Although the time taken to compute the algorithm for thousands of observations cited below the tree may be less than a second, it is a thoughtfully planned and executed process conducted by the researcher with numerous models developed through a process of comparison, adjustment and repetition. When the researcher has reached the point where the variables selected for splitting by the algorithm are reasonably consistent and spurious ones have been removed, a process of validation is undertaken to determine the final model.
CaRT methodology could be criticized because it does not provide a statistical output such as a confidence interval by which to quantify or support the validity of the findings. This lack of statistical assumption has been seen to be one of the method's strengths and also its weaknesses (Breiman et al. 1984). Decision-making is algorithmic rather than statistical; there are no distributions, likelihood ratios or design matrices common in traditional statistical modelling methods (Lemon et al. 2003). Few statistical inference procedures are available to the researcher seeking validation of the method (Crichton et al. 1997), which may be a source of stress for researchers hoping to quantify findings in these ways.
For this reason, and because CaRT analysis is relatively new to nursing research, we have sought to temper this discussion with a sample of the validation methodologies described by various healthcare researchers. Validation in CaRT methodology can involve partitioning out and withholding data from larger data sets or testing small subsets of smaller data sets multiple times. Ideally, a CaRT model will be validated on independent data before it can be deemed generalizable.
Validation in classification and regression tree analysis
In their CaRT survival analysis of 1000 consecutive patients with carcinoma of unknown primary origin, Hess et al. (1999) outlined important findings using their model, which they built using three different trees for estimating length of survival in months emanating from different root nodes for each of the trees. They used variables identified previously as prognostically significant (liver involvement, histology and lymph node involvement) as their root nodes in separate analyses and followed the algorithm-derived splits through to the terminal nodes for each. They then compared the attributes of each tree built and found that, although similar variables remained important, new prognostic groups and covariate structures were also identified. The researchers argued that the fact that the different approaches used similar variables to stratify patient survival confirmed the importance of these variables and supported the validity of their CaRT analysis. Hess et al. also noted that the variables found to be important using the CaRT methodology were concordant with those they had identified in previous research using the Cox univariate and multivariate techniques to stratify patients into survival groups. The previous findings were more generic and reportedly difficult to implement into clinical practice, hence Hess et al. believed that the new structures and prognostic groups would be useful. When describing the shortcomings of their CaRT analysis, the researchers pointed out that their model could not be accepted without validation performed on an independent data set (Hess et al. 1999).
The most commonly used validation technique for CaRT method in medical research is to train the computer algorithm with a subset of the data and then validate it on another. Models may be validated internally or externally.
In a departure from this, Chang et al. (2012) used a 50:50 split for their survival analysis of patients with adenocarcinoma (n = 10,494). They randomly assigned 50% of their sample to a software training sample for regression tree model building and the other half became the test sample by which to build the model. Chang et al. described several other statistical techniques such as Kaplan–Meier plot and log-rank test to compare survival differences amongst the groups identified in their regression tree analysis and found good discriminating capability for survival. Validation in this case was largely dependent on other statistical techniques and not on an independent set of observations.
Other researchers describe using a 10-fold cross-validation methodology for their medical research (Fan et al. 2006, Frisman et al. 2008, Protopopoff et al. 2009, Sayyad et al. 2011), thus also avoiding the use of an independent data set. For these studies, usually conducted with smaller sample sizes, rather than lose a portion of the sample to training and testing, randomly selected samples of the same data set were retested several times to observe for consistency of the tree models. Sayyad et al. (2011), for instance, performed cross-validation with 10 randomly selected subsets (called ‘sample folds’), providing a measure of the final tree's predictive accuracy for risk of progression of diabetic nephropathy. This type of validation technique is open to criticism for not testing the model on observations quarantined from the model during its development.
The methodology for CaRT validation described by Williams (2011) is likely to provide a more robust option for validation, but is best suited to application to moderate-to-large data sets. The R program readily lends itself to this three-way testing procedure.
Williams (2011) describes models built using three entirely separate, randomly selected subsets of the whole sample in R. Rpart provides an automatic partition function the researcher can easily select out of or change. The default partition is set at 70/15/15 of the total sample. Another common separation is 40/30/30 (Williams 2011), which provides more balanced proportions among the three samples. Random selection in the program provides three representative samples of the data, independent of researcher influence. The final decision of the partition ratio configuration rests with the researcher, who will seek to build the most stable tree model. In a recent study using regression tree analysis to determine factors influencing treatment onset times for patients with myocardial infarctions arriving at hospitals, the authors used 35/35/30 per cent divisions to enable more balanced proportions for tree development (Kuhn et al. 2013). As CaRT methods are novel in nursing research, the researchers chose to undertake their own randomized selection using Microsoft Excel (2010). This enabled reader comparison of sample characteristics across the three validation subsets with each other and with the whole data set (Kuhn et al. 2013).
The first randomly selected partitioned subset is the training data set, which is used to provide an estimate of the model's unbiased performance (Williams 2011). The observations used in this first data set are used for algorithm training, rather than model building, and remain segregated. The second data set is called the validation data set and is used to test various iterations to fine-tune the model (Williams 2011). Labelling this set ‘validation’ may lead to some confusion, however, as it does not provide a means of evaluating the performance of the derived model (Williams 2011). Williams says that this can also be called a ‘design dataset’ (p. 60) because it is manipulated by the researcher to design the model, which is less confusing. Model parameters such as the minimum observations in node size, complexity parameter and number of variables or nodes will be adjusted to improve performance of the developing model in this second data set (Williams 2011). This is a critical part of the researcher's role and tends to be developed slowly through an iterative process. The final portion of the original sample, the testing data set, is also called the ‘holdout’ or ‘out-of-sample’ data set (Williams 2011, p. 60). This third data set will have been randomly selected and holds no observations previously used in the other two data sets. It provides an ‘unbiased estimate of the true performance of the model on new, previously unseen observations’ (Williams 2011, p. 60). This provides the CaRT method with a technique for internal validation.
Whilst some researchers have used a variety of techniques that have continued to incorporate sample data used to develop as well as test the model, validation of CaRT analysis is ideally performed using an independent, external data set (Blumenstein 2005). In his editorial, Blumenstein (2005) says that it is still internal validation unless the trees are tested on data collected from other settings. External validation is not always possible, however, and CaRT researchers argue that their tree analyses are exploratory and need to be further tested in larger, prospective trials at any rate (Hess et al. 1999). They use trees derived by internal validation to make known previously undescribed associations between variables to enable further, targeted research. Discovering these new, otherwise indistinguishable relationships amongst data is their intention.
Implications for nursing
The aim of this paper was to provide a non-technical introduction and methodological overview of CaRT analysis to enable the method's effectual uptake into nursing research.
CaRT analysis is a useful means of identifying previously unknown patterns amongst data. Complex interactions are elucidated clearly between covariates and the variable of interest in an easy-to-understand tree diagram. Without researcher bias in selection of predictor variables, the CaRT analysis creates subgroups by testing all possible variable splits and illustrates previously unseen interplay amongst variables, enabling the researcher to hypothesize and further test the variables against each other in an informed way. Through careful application of algorithms at each step, the computer algorithms examine for patterns and disparities between all variables. The process is not necessarily an easy or fast one applied by the researcher. As with many other methods of database analyses, it can be tedious, with many attempts and adjustments made to select the right stopping rules and the best tree size to provide the most predictive model, without showing every observation in a leaf or terminal node.
Despite the encumbrances in uncovering the relationships between variables, CaRT offers meaningful insight into interactions between variables, which are not revealed by linear, traditional quantitative research because such research methods seek to observe global patterns amongst data. If research is restricted to these global paradigms, meaningful interactions between separate variables, and therefore reasons things occur the way they do, may not manifest.
An increasing number of large databases are becoming available in what has been popularly labelled ‘big data’ (Mayer-Schönberger & Cukier 2013) and more of these are likely to be linked, dramatically increasing their usefulness in research in the future. As yet, there are few effective methodological approaches available for nurses and other health researchers to meaningfully engage with the exponentially increasing volumes of available data. CaRT has a potentially valuable role as part of mixed method research as it highlights potential relationships, which can be investigated either quantitatively or qualitatively. For example, outcomes in health systems can be analysed, risk models developed and those factors influencing poorer outcomes may be identified and rectified.
Whilst there are several reasons to embrace this method as a means of exploratory research, it is not the panacea for all types of model development. Like all database research, issues related to institutional Research Ethics Committee approval, as well as access to, and quality of, data collected and the feasibility and usefulness of the outcome, need to be considered.
Conclusion
Classification and regression tree analysis presents an exciting opportunity for nursing and other healthcare research. The approach is an easily interpreted, computationally driven and practicable method for modelling interactions between health-related variables, the significance of which would otherwise remain concealed. The importance of this cannot be overstated, as frequently, in healthcare research, there are unidentified factors influencing patient outcomes. The opportunity to identify and test the relevance of these factors is the beauty of this method. Independent of researcher preconceptions regarding fit between variables, knowledge is presented in a way that removes the need for prohibitive statistical procedures or mathematics, to provide insightful understanding of complex and hierarchical relationships.
Classification and regression tree analysis is a quantitative research tool, which has previously received little attention from nurse researchers, but is likely to become a common method for exploring large data sets in the push to integrate evidence in nursing practice in the future. Due to the ability, rapidly, to discern patterns amongst variables, CaRT will become a valuable means by which to guide nurses to reduce gaps in the application of evidence to practice. With the ever-expanding availability of data at our fingertips, it is important that nurses understand the utility and limitations of this research method.
Future nursing research should engage CaRT for its exploratory and explanatory value when access to large data sets is available to evaluate what is working for patients across healthcare systems in terms of processes and equity of care, enabling nurses to advocate, educate and rectify any clinical management gaps through refining models of contemporary care.
Funding
The first author was supported by an Australian Postgraduate Award with Stipend and a grant from the Royal College of Nursing, Australia National Research and Scholarship Fund.
Conflicts of interest
No conflicts of interest have been declared by the authors.
Author contributions
All authors have agreed on the final version and meet at least one of the following criteria [recommended by the ICMJE (http://www.icmje.org/ethical_1author.html)]:
substantial contributions to conception and design, acquisition of data, or analysis and interpretation of data;
drafting the article or revising it critically for important intellectual content.
The Journal of Advanced Nursing (JAN) is an international, peer-reviewed, scientific journal. JAN contributes to the advancement of evidence-based nursing, midwifery and health care by disseminating high quality research and scholarship of contemporary relevance and with potential to advance knowledge for practice, education, management or policy. JAN publishes research reviews, original research reports and methodological and theoretical papers.
For further information, please visit JAN on the Wiley Online Library website: www.wileyonlinelibrary.com/journal/jan
Reasons to publish your work in JAN:
High-impact forum: the world's most cited nursing journal, with an Impact Factor of 1·527 – ranked 14/101 in the 2012 ISI Journal Citation Reports © (Nursing (Social Science)).
Most read nursing journal in the world: over 3 million articles downloaded online per year and accessible in over 10,000 libraries worldwide (including over 3,500 in developing countries with free or low cost access).
Fast and easy online submission: online submission at http://mc.manuscriptcentral.com/jan.
Positive publishing experience: rapid double-blind peer review with constructive feedback.
Rapid online publication in five weeks: average time from final manuscript arriving in production to online publication.
Online Open: the option to pay to make your article freely and openly accessible to non-subscribers upon publication on Wiley Online Library, as well as the option to deposit the article in your own or your funding agency's preferred archive (e.g. PubMed).
References
- Blumenstein BA. A comment on the utility of recursive partitioning. Journal of Clinical Oncology. 2005;23(19):4254–4255. doi: 10.1200/JCO.2005.12.908. [DOI] [PubMed] [Google Scholar]
- Bonner G. Decision making for health care professionals: use of decision trees within the community mental health setting. Journal of Advanced Nursing. 2001;35(3):349–356. doi: 10.1046/j.1365-2648.2001.01851.x. [DOI] [PubMed] [Google Scholar]
- Breiman L, Friedman J, Olshen R. Stone C. Classification and Regression Trees. Belmont, CA: Wadsworth International Group; 1984. [Google Scholar]
- Chang YJ, Chen LJ, Chung KP. Lai MS. Risk groups defined by recursive partitioning analysis of patients with colorectal adenocarcinoma treated with colorectal resection. BMC Medical Research Methodology. 2012;12:2. doi: 10.1186/1471-2288-12-2. doi: 10.1186/1471-2288-12-2. [DOI] [PMC free article] [PubMed] [Google Scholar]
- Crawley MJ. The R Book. Hoboken, NJ: John Wiley & Sons; 2007. [Google Scholar]
- Crichton NJ, Hinde JP. Marchini J. Models for diagnosing chest pain: is CART helpful? Statistics in Medicine. 1997;16(7):717–727. doi: 10.1002/(sici)1097-0258(19970415)16:7<717::aid-sim504>3.0.co;2-e. [DOI] [PubMed] [Google Scholar]
- Dowding D. Thompson C. Using decision trees to aid decision-making in nursing. Nursing Times. 2004;100(21):36–39. [PubMed] [Google Scholar]
- Fan J, Xiao-Gang S, Levine RA, Nunn ME. Leblanc M. Trees for correlated survival data by goodness of split, with applications to tooth prognosis. Journal of the American Statistical Association. 2006;101(475):959–967. [Google Scholar]
- Fonarow GC, Adams KF, Jr, Abraham WT, Yancy CW. Boscardin WJ. Risk stratification for in-hospital mortality in acutely decompensated heart failure: classification and regression tree analysis. Journal of the American Medical Association. 2005;293(5):572–580. doi: 10.1001/jama.293.5.572. [DOI] [PubMed] [Google Scholar]
- Frisman L, Prendergast M, Lin HJ, Rodis E. Greenwell L. Applying classification and regression tree analysis to identify prisoners with high HIV risk behaviors. Journal of Psychoactive Drugs. 2008;40(4):447–458. doi: 10.1080/02791072.2008.10400651. [DOI] [PMC free article] [PubMed] [Google Scholar]
- Gardino SL, Jeruss JS. Woodruff TK. Using decision trees to enhance interdisciplinary team work: the case of oncofertility. Journal of Assisted Reproduction and Genetics. 2010;27(5):227–231. doi: 10.1007/s10815-010-9413-8. [DOI] [PMC free article] [PubMed] [Google Scholar]
- Hess KR, Abbruzzese MC, Lenzi R, Raber MN. Abbruzzese JL. Classification and regression tree analysis of 1000 consecutive patients with unknown primary carcinoma. Clinical Cancer Research. 1999;5(11):3403–3410. [PubMed] [Google Scholar]
- Hurwitz J, Nugent A, Halper F. Kaufman M. Big Data for DUMMIES. Hoboken, NJ: John Wiley & Sons; 2013. [Google Scholar]
- Karaolis MA, Moutiris JA, Hadjipanayi D. Pattichis CS. Assessment of the risk factors of coronary heart events based on data mining with decision trees. IEEE Transactions on Information Technology in Biomedicine. 2010;14(3):559–566. doi: 10.1109/TITB.2009.2038906. [DOI] [PubMed] [Google Scholar]
- Kuhn L, Worrall-Carter L, Ward J. Page K. Factors associated with delayed treatment onset for acute myocardial infarction in Victorian emergency departments: a regression tree analysis. Australasian Emergency Nursing Journal. 2013 doi: 10.1016/j.aenj.2013.08.002. doi: 10.1016/j.aenj.2013.08.002. [DOI] [PubMed] [Google Scholar]
- Lamborn KR, Chang SM. Prados MD. Prognostic factors for survival of patients with glioblastoma: recursive partitioning analysis. Neurological Oncology. 2004;6(3):227–235. doi: 10.1215/S1152851703000620. [DOI] [PMC free article] [PubMed] [Google Scholar]
- Lange LL. Jacox A. Using large data bases in nursing and health policy research. Journal of Professional Nursing. 1993;9(4):204–211. doi: 10.1016/8755-7223(93)90037-d. [DOI] [PubMed] [Google Scholar]
- Leclerc BS, Begin C, Cadieux E, Goulet L, Allaire JF, Meloche J, Leduc N. Kergoat MJ. A classification and regression tree for predicting recurrent falling among community-dwelling seniors using home-care services. Canadian Journal of Public Health. Revue Canadienne de Sante Publique. 2009;100(4):263–267. doi: 10.1007/BF03403944. [DOI] [PMC free article] [PubMed] [Google Scholar]
- Lemon SC, Roy J, Clark MA, Friedmann PD. Rakowski W. Classification and regression tree analysis in public health: methodological review and comparison with logistic regression. Annals of Behavioral Medicine. 2003;26(3):172–181. doi: 10.1207/S15324796ABM2603_02. [DOI] [PubMed] [Google Scholar]
- Magee T, Lee SM, Giuliano KK. Munro B. Generating new knowledge from existing data: the use of large data sets for nursing research. Nursing Research. 2006;55(2):S50–56. doi: 10.1097/00006199-200603001-00009. [DOI] [PubMed] [Google Scholar]
- Mayer-Schönberger V. Cukier K. Big Data: A Revolution That Will Transform How We Live, Work and Think. Boston, MA: An Eamon Dolan Book, Houghton Mifflin Harcourt; 2013. [Google Scholar]
- Prasad AM, Iverson LR. Liaw A. Newer classification and regression tree techniques: bagging and random forests for ecological prediction. Ecosystems. 2006;9:181–199. [Google Scholar]
- Protopopoff N, Van Bortel W, Speybroeck N, Van Geertruyden JP, Baza D, D'Alessandro U. Coosemans M. Ranking malaria risk factors to guide malaria control efforts in African highlands. PLoS ONE. 2009;4(11):e8022. doi: 10.1371/journal.pone.0008022. doi: 10.1371/journal.pone.0008022. [DOI] [PMC free article] [PubMed] [Google Scholar]
- Quintana JM, Bilbao A, Escobar A, Azkarate J. Goenaga JI. Decision trees for indication of total hip replacement on patients with osteoarthritis. Rheumatology. 2009;48(11):1402–1409. doi: 10.1093/rheumatology/kep264. [DOI] [PubMed] [Google Scholar]
- R Development core Team. R: A language and environment for statistical computing. Vienna, Austria: R Foundation for Statistical Computing; 2010. [Google Scholar]
- Rokach L. Maimon O. Data Mining with Decision Trees: Theory and Applications. River Edge, NJ: World Scientific; 2007. [Google Scholar]
- Sayyad MG, Gopal G. Shahani AK. Classification and regression trees: a possible method for creating risk groups for progression to diabetic nephropathy. Journal of Applied Sciences. 2011;11(12):2076–2083. [Google Scholar]
- Speybroeck N. Classification and regression trees. International Journal of Public Health. 2012;57(1):243–246. doi: 10.1007/s00038-011-0315-z. [DOI] [PubMed] [Google Scholar]
- Strobl C, Malley J. Tutz G. An introduction to recursive partitioning: rationale, application and characteristics of classification and regression trees, bagging and random forests. Psychological Methods. 2009;14(4):323–348. doi: 10.1037/a0016973. [DOI] [PMC free article] [PubMed] [Google Scholar]
- Su X, Azuero A, Cho J, Kvale E, Meneses KM. McNees MP. An introduction to tree-structured modeling with application to quality of life data. Nursing Research. 2011;60(4):247–255. doi: 10.1097/NNR.0b013e318221f9bc. [DOI] [PMC free article] [PubMed] [Google Scholar]
- Williams G. Data Mining with Rattle and R: The Art of Excavating Data for Knowledge Discovery. New York: Springer; 2011. [Google Scholar]
- Zhang H. Singer BH. Recursive Partitioning in the Health Sciences. 2. New York: Springer; 2010. [Google Scholar]