
Figure 2.
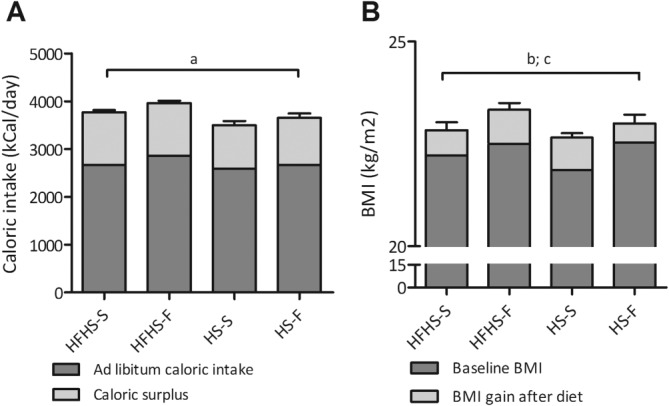
(A) Ad libitum caloric intake and surplus caloric intake during the diet interventions. Data are presented as mean and SEM, average of the 6-week diet period. (a) ANOVA of total caloric intake: P = 0.11, F = 2.24. (B) Baseline BMI and BMI gain after the hypercaloric diets. Data are presented as mean and SEM group averages. (b) ANOVA BMI gain: P = 0.42, F = 0.97; (c) ANOVA BMI after the diet: P = 0.81, F = 0.32.