

Abstract
The cost-effectiveness of noninvasive tests (NITs) as alternatives to liver biopsy is unknown. We compared the cost-effectiveness of using NITs to inform treatment decisions in adult patients with chronic hepatitis C (CHC). We conducted a systematic review and meta-analysis to calculate the diagnostic accuracy of various NITs using a bivariate random-effects model. We constructed a probabilistic decision analytical model to estimate health care costs and outcomes (quality-adjusted life-years; QALYs) using data from the meta-analysis, literature, and national UK data. We compared the cost-effectiveness of four treatment strategies: testing with NITs and treating patients with fibrosis stage ≥F2; testing with liver biopsy and treating patients with ≥F2; treat none; and treat all irrespective of fibrosis. We compared all NITs and tested the cost-effectiveness using current triple therapy with boceprevir or telaprevir, but also modeled new, more-potent antivirals. Treating all patients without any previous NIT was the most effective strategy and had an incremental cost-effectiveness ratio (ICER) of £9,204 per additional QALY gained. The exploratory analysis of currently licensed sofosbuvir treatment regimens found that treat all was cost-effective, compared to using an NIT to decide on treatment, with an ICER of £16,028 per QALY gained. The exploratory analysis to assess the possible effect on results of new treatments, found that if SVR rates increased to >90% for genotypes 1-4, the incremental treatment cost threshold for the “treat all” strategy to remain the most cost-effective strategy would be £37,500. Above this threshold, the most cost-effective option would be noninvasive testing with magnetic resonance elastography (ICER = £9,189). Conclusions: Treating all adult patients with CHC, irrespective of fibrosis stage, is the most cost-effective strategy with currently available drugs in developed countries. (Hepatology 2014;60:832–843)
Chronic hepatitis C (CHC) virus infection is one of the main causes of chronic liver disease, with an estimated 130-170 million persons infected worldwide. The natural history of the disease is variable, and it is estimated that one third of infected patients will progress to cirrhosis in less than 20 years, whereas another one third will never progress to cirrhosis.1 Antiviral treatment can eradicate the virus and stop further fibrosis progression. With current antiviral treatment, sustained virological response (SVR) rates are 75% for genotype 1 and 80% for genotypes 2 and 3.2 These rates are going to further increase in the next 5 years, because more-effective antivirals are being developed.
There has always been a dilemma concerning which patients to treat, because interferon (IFN)-based treatments have considerable side effects and not all patients with CHC will progress to cirrhosis. Indeed, antiviral treatment has been advocated for patients with fibrosis stage ≥F2, whereas those with less fibrosis could potentially wait.3 A caveat to this strategy was the need for liver biopsy in order to assess the extent of fibrosis. Therefore, clinical practice evolved to treat most patients with antiviral treatment without a liver biopsy, irrespective of fibrosis stage.
The recent explosive development and use of noninvasive tests (NITs) for evaluating fibrosis has led to questioning this approach, particularly because more effective treatments with fewer side effects will soon become available and thus patients can potentially wait. Moreover, because NITs can be performed serially in the same patient and therefore the evolution of fibrosis can be monitored, this newer paradigm is used more often. Therefore, the use of NITs before deciding to start antiviral therapy might be a more cost-effective approach given the increased costs of new therapies.4 In the current study, we assessed the cost-effectiveness of such tests for treatment decisions in adult patients with CHC.
Materials and Methods
Systematic Review
We performed a systematic review and meta-analysis to determine the diagnostic accuracy of NITs, compared to liver biopsy, in adult patients with CHC. This was part of a larger project funded by the UK National Institute for Health Research Health Technology Assessment Program that determined the cost-effectiveness of NITs in patients with hepatitis B virus, hepatitis C virus (HCV), alcoholic liver disease, and nonalcoholic fatty liver disease. The study is registered in the PROSPERO database (PROSPERO 2011:CRD42011001561).
Study Selection and Data Extraction
MEDLINE, Embase, and Science Citation Index Expanded were searched from 1988 until April 2012 for all available studies of NITs across all etiologies of liver disease as part of the larger project. Studies that reported on patients with HCV were selected and included for this article. Reference lists of identified studies and reviews and conference proceedings from recent hepatology conferences (last 2 years) were hand searched to identify further studies. The search strategy is provided in the Web Appendix (see the Supporting Information).
We included full articles and abstracts, which provided the data necessary to determine the number of true positive (TP), true negative (TN), false positive (FP), and false negative (FN) results of the NITs for ≥F2 using liver biopsy as the reference standard, irrespective of language or publication status. We excluded studies that reported on fewer than 10 patients and when the maximum interval between liver biopsy and the NITs was >6 months.
Study selection and data extraction were performed independently by two researchers. Data were entered into a specifically created Excel file. The quality of the included studies was assessed independently by two researchers using the QUADAS-2 tool.5 The criteria used for QUADAS-2 assessment are shown in the Web Appendix (see the Supporting Information).
Data Analysis
The data were combined using the bivariate random-effects model,6 with correlation between sensitivity and specificity using the METADAS macro developed by the SRDTA Working Group in the SAS 9.2 statistical software (SAS Institute Inc., Cary, NC).7 For tests with explicit thresholds, such as serum markers, we calculated the summary sensitivity and specificity at specific thresholds. If the results did not converge using the above-mentioned random-effects model with a correlation between sensitivity and specificity, we performed the meta-analysis with variations of bivariate analysis, which included bivariate random-effects model without correlation, fixed-effect model for sensitivity and random-effects model for specificity, random-effects model for sensitivity and fixed-effect model for specificity, and fixed-effects model for both sensitivity and specificity, depending upon the distribution of sensitivities and specificities across the studies. We also calculated the median, lowest, and highest prevalence for the specific stages of fibrosis in the included studies.
Economic Evaluation: Approach to Analysis
The systematic review identified 57 relevant NITs for use in CHC. We assessed the cost-effectiveness of the NITs in the context of treating patients with fibrosis stage ≥F2. Additional comparators for the strategies including NITs were: (1) treat all patients with CHC irrespective of fibrosis; (2) treat none; and (3) biopsy all and treat those with fibrosis stage ≥F2.
We initially conducted an analysis where we compared single NITs to each other. We assumed that only patients who tested positive (TP or FP) would receive immediate treatment with anti-viral agents. We then conducted a second analysis, which evaluated the use of more than one test, combined based on four sequential test strategies which are or could potentially be used in clinical practice (see Table1). Given the large number of tests, it was not feasible to model combinations of all identified NITs; therefore, we chose six NITs from within three defined test categories (indirect serum markers, direct and patented serum markers, and imaging modalities). To choose the six NITs, we used a decision rule whereby we chose the best NIT (defined as the most cost-effective NIT at a cost-effectiveness threshold of £20,000) from within each category with a defined diagnostic cutoff (high or low) and the best NIT without any defined cut-off. We assumed that NITs used sequentially were independent of each other.
Table 1.
Sequential Testing Approach: Hepatitis C Model
| First NIT Result | Second NIT Result | |||
|---|---|---|---|---|
| Positive | Negative | Positive | Negative | |
| Strategy 1 | Treat patients | Liver biopsy | ||
| Strategy 2 | Do second test | Watchful waiting | Treat patients | Liver biopsy |
| Strategy 3 | Do second test | Liver biopsy | Treat patients | Liver biopsy |
| Perform two NITs regardless of test outcome | ||||
| Strategy 4 | Agree (+): treat | Agree: treat or watchful waiting | ||
| Agree (−): watchful waiting | Disagree: liver biopsy | |||
The second analysis compared the six chosen NITs used singly, combinations of the six NITs based on the four sequential testing strategies (Table1), liver biopsy, “treat all” and “treat no one,” four published algorithms for CHC (SAFE, Fibropaca, Bordeaux, and Leroy), which are a combination of NITs used sequentially or concomitantly, and several NITs with a dual diagnostic threshold (a high cutoff with high specificity and a low cutoff with high sensitivity; when these cutoffs are combined to minimize the number of FPs and FNs, then a number of patients falling between the two cutoffs have indeterminate results and need further testing), resulting in a comparison of 56 strategies in the second analysis.
Model Structure
The analyses were based on a decision tree, combined with a Markov model to estimate the long-term costs and outcomes associated with each potential NIT diagnosis: TP, FP, FN, or TN and the treat all and treat no one testing strategies. The Markov model estimated the lifetime mean costs and outcomes for a hypothetical cohort of 1,000 patients with CHC genotypes 1-4, with suspected fibrosis, who would usually present for liver biopsy. The model structure is a modified version of previously published models of liver fibrosis in CHC (Fig. 1).8,9 We validated the model natural history outputs using data from a study that retrospectively assessed a cohort of patients who did not attain SVR after IFN treatment10; the outputs were similar for patients with F4.
Figure 1.
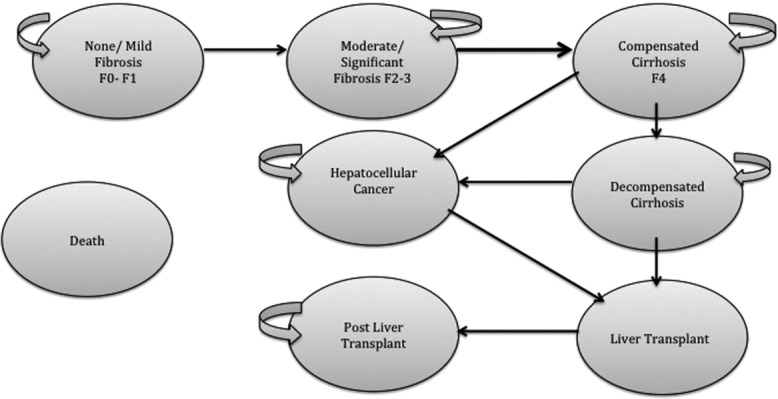
Illustration of the Markov model used for economic analysis. The disease stages reflect the Metavir staging score for liver fibrosis and cirrhosis. The cohort represents those suspected of liver fibrosis who can enter the models in one of three disease stages: mild fibrosis (Metavir stages F0-F1), moderate fibrosis (Metavir stages F2-F3), and compensated cirrhosis (Metavir stage F4), with the proportions determined by the prevalence estimated from the results of the systematic review (prevalence ≥F2: 53%). Within the model, patients can remain within any disease stage for longer than one cycle (length of cycle is set as 1 year), except for the LT disease stage, where patients can only progress to either a post-LT stage or death.
Health outcomes were expressed as quality-adjusted life-years (QALYs), which combine data on life expectancy with data reflecting quality of life (sometimes referred to as “utility” data). The study was carried out from a UK National Health Service perspective. A threshold value for incremental cost-effectiveness was assumed to be £20,000 per additional QALY gained, based on the lower boundary of UK guidelines, and was varied in sensitivity analysis.11 A discount rate of 3.5% was applied to costs and QALYs.11 The decision tree was populated with results from the Markov model, summary sensitivity and specificity, and average disease prevalence to estimate the cost-effectiveness of all comparators.
Input Parameters
The disease prevalence for the F0-F1, F2-F3, and F4 health states as well as the diagnostic accuracy of the NITs were estimated using data from the systematic literature review.
In accord with UK national guidelines, treatment reflected in the model was a combination of pegylated IFN (Peg-IFN)-α-2a or -α-2b, ribavirin (RBV), and telaprevir (TVR) or boceprevir (BOC), depending upon the genotype.12–15 Genotype 1 patients received triple therapy (TT) with BOC or TVR (50/50 split). Treatment was initiated if the diagnostic test result (from the NITs used singly or in combination) was equal to a Metavir score of moderate fibrosis (≥F2; TP and FP). Otherwise, a strategy of “watchful waiting” was initiated whereby patients would be retested with a NIT every 2 years. The effect of treatment in the model was based on SVR rates, such that if patients achieved SVR, they no longer retained the risk of progression to a worse disease stage and reverted to general population mortality rates.
The rate of disease progression in the Markov model was sourced from a published cost-effectiveness study by Wright et al.9; early disease stage costs (≤F4) and health-related utility data were also sourced from this study; as per National Institute for Health and Clinical Excellence (NICE) guidance,11 the data were based on patients' self-reported health status using the EQ-5D questionnaire in a UK population.16 Later disease stage costs and utilities were estimated using the raw data from a cost-effectiveness study of liver transplantation (LT).17 We incorporated adverse effects (AEs) associated with Peg-IFN-α treatment in the model by applying a disutility during treatment, using data from Wright et al.9 We allowed for an increased EQ-5D value post–successful response (SVR) to treatment.9
Cohort characteristics, mortality data, SVR rates after treatment, and treatment costs were sourced from published literature and routine national UK source of cost data. All input parameters and sources are listed in Table2. Costs for the NITs and liver biopsy are listed in the Web Appendix (see the Supporting Information).
Table 2.
Input Parameters: Hepatitis C Model
| Model Inputs | Parameters Value | PSA distribution (if applicable) | Source |
|---|---|---|---|
| Cohort characteristics | |||
| Age | 40 | Wright et al.27 | |
| Average weight | 79.8 kg | Fried et al.28 | |
| % male | 61 | Wright et al.27 | |
| Genotype, % | |||
| 1 | 66 | ||
| 2 and 3 | 31 | Fried et al.28 | |
| 4 | 3 | ||
| Natural history data | |||
| Mild-moderate fibrosis | 0.025 | Dirichlet | Wright et al.27 |
| Moderate fibrosis-compensated cirrhosis | 0.037 | ||
| Cirrhosis-decompensated cirrhosis | 0.04 | ||
| Cirrhosis-HCC | 0.14 | ||
| Decompensated cirrhosis/HCC-LT | 0.02 | ||
| Decompensated cirrhosis-death | 0.13 | ||
| HCC-death | 0.43 | ||
| LT-Death | 0.15 | ||
| Post-LT-death | 0.03 | ||
| All-cause mortality | Range from 0.014 to 0.335 | Interim life table England and Wales, 2008-2010 | |
| SVR Rate | |||||
|---|---|---|---|---|---|
| Treatment | Dosage (mg) | Duration (weeks) | SVR Rate (%) | Source | |
| Genotype 1: treatment naïve | Peg-IFN-α-2a | 180 (weekly) | 48 | NICE HTA 25213 | |
| RBV | 1,200 (daily) | 48 | 75 | ||
| TVR | 2,250 (daily | 12 | |||
| Genotype 1: treatment naïve | Peg-IFN-α-2b | 120 (weekly) | 48 | NICE HTA 25312 | |
| RBV | 1,000 (daily) | 48 | 66.1 | ||
| BOC | 2,400 (daily) | 32 | |||
| Genotype 1: patients with cirrhosis (treatment naïve) | Peg-IFN-α-2b | 120 (weekly) | 48 | NICE HTA 25312 | |
| RBV | 1,000 (daily) | 48 | 41.7 | ||
| BOC | 2,400 (daily) | 36 | |||
| Genotypes 2 and 3 (treatment naïve) | Peg-IFN-α-2a | 180 (weekly) | 24 | 76 | Fried et al.28 |
| RBV | 1,200 (daily) | 24 | |||
| Peg-IFN-α-2b | 120 (weekly) | 24 | 82 | Manns et al.29 | |
| RBV | 1,000 (daily) | 24 | |||
| Genotype 4 (treatment naïve) | Peg-IFN-α-2a | 180 (weekly) | 48 | 77 | Fried et al.28 |
| RBV | 1,200 (daily) | 48 | |||
| Peg-IFN-α-2b | 120 (weekly) | 48 | 69 | Kamal et al.30 | |
| RBV | 1,000 (daily) | 48 | |||
| Health State Costs | |||||
|---|---|---|---|---|---|
| Mean | Standard Error | PSA Distribution | Source | ||
| Mild fibrosis | 185 | 36.39 | Wright et al.27 | ||
| Moderate fibrosis | 959 | 101.69 | Gamma | ||
| Compensated cirrhosis | 1,521 | 309.05 | |||
| Decompensated cirrhosis | 38,871 | 9410.46 | Longworth et al.17 | ||
| HCC | 38,871 | 9410.46 | |||
| LT | 69,174 | 7054.86 | |||
| Post-LT | 4,356 | 861.57 | |||
| Treatment Costs | |||||
|---|---|---|---|---|---|
| Treatment | Cost | Source | |||
| Genotype 1: treatment naïve | Peg-IFN-α-2a and RBV/TVR | 32,809 | British National Formulary 64 http://www.bnf.org/bnf/index.htm | ||
| Genotype 1: treatment naïve | Peg-IFN-α-2b and RBV/BOC | 33,270 | |||
| Genotype 1: patients with cirrhosis | Peg-IFN-α-2b and RBV/BOC | 41,670 | |||
| Genotypes 2 and 3 | Peg-IFN-α-2a and RBV | 4,446 | |||
| Genotypes 2 and 3 | Peg-IFN-α-2b and RBV | 5,435 | |||
| Genotype 4 | Peg-IFN-α-2a and RBV | 10,411 | |||
| Genotype 4 | Peg-IFN-α-2b and RBV | 10,870 | |||
| Utilities | |||||
|---|---|---|---|---|---|
| Mean | Standard Error | PSA Distribution | Source | ||
| Without treatment with antiviral agents | |||||
| Mild fibrosis | 0.77 | 0.035 | Beta | Wright et al.27 | |
| Moderate fibrosis | 0.66 | 0.018 | |||
| Compensated cirrhosis | 0.55 | 0.032 | |||
| Decompensated cirrhosis | 0.49 | 0.056 | Longworth et al.17 | ||
| HCC | 0.49 | 0.056 | |||
| LT | 0.51 | 0.053 | |||
| Post-LT | 0.52 | 0.061 | |||
| Death | 0 | 0 | |||
| During treatment with antiviral agents | |||||
| Mild fibrosis (during treatment) | 0.65 | 0.035 | Beta | Wright et al.27 | |
| Moderate fibrosis (during treatment) | 0.55 | 0.018 | |||
| Compensated cirrhosis (during treatment) | 0.44 | 0.04 | Grishchenko et al.31 | ||
| After successful response to treatment with antiviral agents | |||||
| Mild fibrosis (SVR after treatment) | 0.82 | 0.04 | Beta | Wright et al.27 | |
| Moderate fibrosis (SVR after treatment) | 0.71 | 0.05 | |||
| Compensated cirrhosis (SVR after treatment) | 0.60 | 0.04 | Grishchenko et al.31 | ||
Analysis of Results and Uncertainty
We conducted an incremental analysis to identify the cost-effective testing strategy.18 We ruled out test strategies, which were more costly and less effective (“dominated”). We then estimated incremental cost-effectiveness ratios (ICERs), for the remaining NITs, where they were compared to the next-best alternative, calculated using the formula:
where C1 = lifetime cost of strategy 1, C0 = lifetime cost of (the next-best) strategy, E1 = QALYs from strategy 1 and, and E0 = QALYs from (the next-best) strategy.
Test strategies with an ICER greater than that of a more-effective intervention (extendedly dominated) were also ruled out, and the remaining tests were then compared to identify the NIT leading to the highest QALY gain given a £20,000/QALY cost-effectiveness threshold.
Probabilistic sensitivity analysis (PSA) was used to represent uncertainty in the model, and cost-effectiveness acceptability frontiers (CEAFs) were constructed. The CEAF plots the uncertainty associated with the optimal testing strategy, for different values of the cost-effectiveness threshold (threshold value range varied from £0 to £60,000).19
Sensitivity Analysis
A number of one-way sensitivity analyses were conducted in order to test the robustness of our findings.
We assumed that there was no increase in utility values after a successful response (represented by SVR in the model) to treatment with antiviral agents.
We assumed that there was no reduction in utility values during treatment with antiviral agents.
We assumed an additional disutility decrement value of 0.05 to represent potential AEs from the use of TVR or BOC in HCV genotype 1 patients.
We used higher utility values for all health states. These values were sourced from a published Health Technology Assessment (HTA) report.20
We changed the prevalence of ≥F2 disease (53%) to the minimum and maximum estimates extracted from the meta-analysis (17% and 83%, respectively).
The base-case model assumes that patients with no or mild fibrosis who are treated incorrectly (test diagnosis of FP) benefit from antiviral treatment. We tested this assumption by reducing the successful response to treatment (SVR rate) for this group of patients by decrements of 10%.
We conducted an analysis allowing for patients in a cirrhotic health state who had a successful response to treatment (SVR) to retain a small risk of progression to decompensated cirrhosis (0.4%) and hepatocellular carcinoma (HCC; 0.2%) health states.
Our base-case analysis assumes that the retest (from the meta-analysis of the systematic review data in the watchful waiting strategy for patients with a negative test result) correctly identified all patients who had progressed to a health state ≥F2. We tested this assumption by applying the sensitivity and specificity of three commonly used tests (aspartate transaminase to platelets ratio index [APRI], FibroTest, and FibroScan).
We assumed a later starting age (50 years) in the model by amending the rates of all-cause mortality to reflect a cohort of ≥50 years. We also increased the probability of disease progression in the mild and moderate health states to reflect those of an older cohort of patients (transition probability of 0.067 and 0.077 to reflect progression from a mild to moderate health state from a moderate to cirrhotic health state, respectively).
We incorporated a discontinuation rate for TT with BOC or TVR, which had an effect on the total cost of treatment. The discontinuation rates for BOC were 4% at week 12 and 2% at week 24 and for TVR 5% at week 4 and 2% at week 12.13,14
Secondary Analysis
Summary sensitivity and specificity estimates for some of the NITs were based on only one study. Taking this into consideration, we conducted a secondary analysis where we evaluated only those NITs (14 NITs) where the bivariate model for the meta-analysis converged (used as an indicator of the magnitude of the evidence base underlying an NIT).
Exploratory Analysis
We conducted an exploratory analysis to assess the potential effect of new therapies on the findings for NITs. We assessed the effect of increased treatment costs and effectiveness to reflect the use of sofosbuvir (SOF) as part of TT in combination with Peg-IFN-α-2a/2b and RBV. We assumed that genotype 1 and 4 patients would receive treatment with Peg-IFN-α-2a, RBV, and SOF for a total of 12 weeks (SVR rate: 89% and 96%, respectively, with a total treatment cost of £36,476). We assumed that genotype 2 patients would receive treatment with RBV and SOF for a total of 12 weeks (SVR rate without cirrhosis: 92%; SVR rate with cirrhosis: 94%; with a total treatment cost of £35,723). We assumed that genotype 3 patients would receive treatment with RBV and SOF for a total of 24 weeks (SVR rate without cirrhosis: 94%; SVR rate with cirrhosis: 92%; with a total treatment cost of £71,466).21
We further assessed potential new IFN-free therapies with assuming an SVR rate of 90% for genotype 1, 92% for genotypes 2 and 3, and 94% for genotype 4.
Results
Meta-Analysis
The selection flow chart for studies is shown in Fig. 1 (Web Appendix in the Supporting Information). Data on patients with HCV were extracted from 162 studies (Web Appendix in the Supporting Information). NIT cutoffs for the diagnosis of specific histological stages were not always predetermined and, consequently, varied. Cutoffs were grouped into narrow ranges, as appropriate. Therefore, when a range of cutoffs is mentioned in the results tables (Table3), the reported sensitivities and specificities are probably overestimated.
Table 3.
Diagnostic Accuracy of NITs for Detection of Fibrosis Stage ≥F2 in Patients With CHC
| Test | Number of Studies | Cutoff | Summary Sensitivity | 95% CI | Summary Specificity | 95% CI | Statistics |
|---|---|---|---|---|---|---|---|
| Indirect noninvasive serum tests | |||||||
| APRI (low cutoff) | 47 | 0.4-0.7 | 0.82 | 0.77-0.86 | 0.57 | 0.49-0.65 | Bivariate random-effects model with correlation between sensitivity and specificity |
| APRI (high cutoff) | 36 | 1.5 | 0.39 | 0.32-0.47 | 0.92 | 0.89-0.95 | Bivariate random-effects model with correlation between sensitivity and specificity |
| Age_Platelet index | 1 | 3 | 0.58 | 0.46-0.70 | 0.70 | 0.64-0.84 | Single study |
| AST_ALT_ratio | 7 | 0.6-1 | 0.44 | 0.27-0.63 | 0.71 | 0.62-0.78 | Bivariate random-effects model with correlation between sensitivity and specificity |
| Cirrhosis discriminant score | 1 | 6 | 0.66 | 0.59-0.73 | 0.49 | 0.34-0.64 | Single study |
| FIB-4 (low cutoff) | 11 | 0.6-1.45 | 0.89 | 0.79-0.95 | 0.42 | 0.25-0.61 | Random-effects model for sensitivity and specificity without correlation |
| FIB-4 (high cutoff) | 9 | 1-3.25 | 0.59 | 0.43-0.73 | 0.74 | 0.56-0.87 | Bivariate random-effects model with correlation between sensitivity and specificity |
| Forns index (low cutoff) | 18 | 4.2-4.5 | 0.88 | 0.83-0.91 | 0.40 | 0.33-0.48 | Bivariate random-effects model with correlation between sensitivity and specificity |
| Forns index (high cutoff) | 15 | 6.9-8.7 | 0.35 | 0.29-0.41 | 0.96 | 0.92-0.98 | Bivariate random-effects model with correlation between sensitivity and specificity |
| FibroQ | 1 | 1.6 | 0.78 | 0.71-0.83 | 0.66 | 0.51-0.78 | Single study |
| Fibrosis probability index (low cutoff) | 2 | 0.2 | 0.91 | 0.83-0.96 | 0.45 | 0.34-0.57 | Fixed-effects model for sensitivity and specificity without correlation |
| Fibrosis probability index (high cutoff) | 2 | 0.8 | 0.42 | 0.32-0.54 | 0.95 | 0.87-0.98 | Fixed-effects model for sensitivity and specificity without correlation |
| GUCI | 3 | 0.33-1.1 | 0.65 | 0.1-1.00 | 0.79 | 0.03-1.00 | Bivariate random-effects model with correlation between sensitivity and specificity |
| Kings | 1 | 9.87 | 0.84 | 0.75-0.9 | 0.70 | 0.61-0.79 | Single study |
| Kings (low cutoff) | 1 | 4.46 | 0.62 | 0.55-0.69 | 0.81 | 0.76-0.86 | Single study |
| Kings (high cutoff) | 1 | 12.3 | 0.58 | 0.51-0.65 | 0.79 | 0.73-0.83 | Single study |
| Lok's model | 4 | 0.2-1.67 | 0.67 | 0.55-0.77 | 0.55 | 0.29-0.78 | Bivariate random-effects model with correlation between sensitivity and specificity |
| Platelets | 10 | 48-182 | 0.50 | 0.41-0.59 | 0.89 | 0.83-0.93 | Bivariate random-effects model with correlation between sensitivity and specificity |
| Pohl index | 2 | Positive | 0.06 | 0.04-0.1 | 0.99 | 0.93-1.00 | Fixed-effects model for sensitivity and specificity without correlation |
| Direct serum noninvasive serum tests | |||||||
| Aminopyrine breath test | 1 | 8.1 | 0.73 | 0.57-0.85 | 0.74 | 0.58-0.85 | Single study |
| Hyaluronic acid | 8 | 34-110 ng/mL | 0.75 | 0.64-0.83 | 0.75 | 0.68-0.82 | Bivariate random-effects model with correlation between sensitivity and specificity |
| Hepascore | 10 | 0.31-0.5 | 0.73 | 0.66-0.79 | 0.73 | 0.65-0.79 | Bivariate random-effects model with correlation between sensitivity and specificity |
| Hepascore (high cutoff) | 1 | 0.84 | 0.33 | 0.24-0.43 | 0.92 | 0.85-0.96 | Single study |
| MP3 | 1 | 0.3 | 0.82 | 0.73-0.89 | 0.73 | 0.63-0.81 | Single study |
| PIIINP | 2 | 8.3-9.1 | 0.78 | 0.63-0.87 | 0.76 | 0.54-0.90 | Fixed-effects model for sensitivity and specificity without correlation |
| PIIINP/MMP-1 index | 1 | 0.3 | 0.65 | 0.55-0.75 | 0.85 | 0.77-0.90 | Single study |
| Type IV collagen | 5 | 110-298 | 0.88 | 0.71-0.96 | 0.73 | 0.63-0.82 | Random-effects model for sensitivity and specificity without correlation |
| YKL-40 (low cutoff) | 1 | 290 | 0.80 | 0.66-0.89 | 0.33 | 0.26-0.41 | Single study |
| YKL-40 (high cutoff) | 1 | 540 | 0.33 | 0.21-0.48 | 0.80 | 0.73-0.86 | Single study |
| Commercial noninvasive serum tests | |||||||
| ELF | 1 | 8.75 | 0.84 | 0.69-0.92 | 0.70 | 0.52-0.83 | Single study |
| ELF (low cutoff) | 1 | 9.55 | 0.90 | 0.85-093 | 0.52 | 0.43-0.61 | Single study |
| ELF (high cutoff) | 1 | 11.07 | 0.47 | 0.41-0.54 | 0.90 | 0.83-0.94 | Single study |
| FibroIndex (low cutoff) | 4 | 1.25 | 0.83 | 0.15-0.99 | 0.57 | 0.22-0.86 | Random-effects model for sensitivity and specificity without correlation |
| FibroIndex (high cutoff) | 4 | 2.25 | 0.24 | 0.11-0.43 | 0.98 | 0.93-1.00 | Random-effects model for sensitivity and fixed-effect model for specificity without correlation |
| FibroMeter | 4 | 0.42-0.57 | 0.79 | 0.69-0.86 | 0.73 | 0.63-0.81 | Bivariate random-effects model with correlation between sensitivity and specificity |
| FibroSpect II | 5 | 42-72 | 0.78 | 0.49-0.93 | 0.71 | 0.59-0.80 | Random-effects model for sensitivity and specificity without correlation |
| FibroTest | 17 | 0.32-0.53 | 0.68 | 0.58-0.77 | 0.72 | 0.70-0.77 | Bivariate random-effects model with correlation between sensitivity and specificity |
| FibroTest (low cut-off) | 7 | 0.1-0.3 | 0.91 | 0.86-0.94 | 0.41 | 0.37-0.46 | Random-effects model for sensitivity and specificity without correlation |
| Fibrotest (high cutoff) | 10 | 0.6-0.7 | 0.57 | 0.46-0.67 | 0.85 | 0.74-0.92 | Bivariate random-effects model with correlation between sensitivity and specificity |
| Imaging modalities | |||||||
| ARFI | 3 | 1.21-1.34 | 0.79 | 0.75-0.83 | 0.89 | 0.84-0.93 | Fixed-effects model for sensitivity and specificity without correlation |
| MRE | 3 | — | 0.94 | 0.13-1 | 0.92 | 0.72-0.98 | Model 3; random effects for sensitivity and fixed effect for specificity |
| PLT_spleen ratio | 3 | 1750-2200 | 0.88 | 0.62-0.99 | 0.73 | 0.41-0.99 | Bivariate random-effects model with correlation between sensitivity and specificity |
| FibroScan | 37 | 5.2-10.1 | 0.79 | 0.74-0.84 | 0.83 | 0.77-0.88 | Bivariate random-effects model with correlation between sensitivity and specificity |
| US | 3 | — | 0.35 | 0.14-0.63 | 0.86 | 0.59-0.96 | Metadas |
| US_SAPI | 3 | — | 0.74 | 0.69-0.79 | 0.79 | 0.72-0.85 | Model 5; fixed-effect model for both |
| US_SAPI (high cutoff) | 2 | — | 0.61 | 0.54-0.68 | 0.96 | 0.9-0.98 | Model 5; fixed-effect model for both |
| US_SAPI_F2 (low cutoff) | 2 | — | 0.94 | 0.9-0.97 | 0.39 | 0.31-0.49 | Model 5; fixed-effect model for both |
| Combination of fibrosis noninvasive tests algorithms | |||||||
| Bordeaux | 1 | — | 0.88 | 0.85-0.91 | 0.89 | 0.85-0.92 | Single study |
| Fibropaca | 1 | — | 0.85 | 0.81-0.89 | 0.90 | 0.86-0.93 | Single study |
| Leroy | 1 | — | 0.90 | 0.79-0.96 | 0.98 | 0.95-0.99 | Single study |
| SAFE | 4 | — | 1.00 | 1.00-1.00 | 0.81 | 0.80-0.83 | Fixed-effects model for sensitivity and specificity without correlation |
Bordeaux consists of the synchronous use of FibroTest and FibroScan, followed by liver biopsy in cases of discordance. Fibropaca consists of the synchronous use of FibroTest plus APRI and/or Forns, followed by liver biopsy in cases of discordance. Leroy consists of the synchronous use of FibroTest plus APRI, followed by liver biopsy in patients with intermediate values. SAFE is a sequential algorithm that consists of APRI as the initial test followed by FibroTest in the indeterminate fibrosis cases or liver biopsy in patients with low risk of fibrosis according to APRI.
Abbreviations: AST, aspartate aminotransferase; ALT, alanine aminotransferase; GUCI, Göteborg University Cirrhosis Index; MP3 score, combination of PIIINP and MMP-1; PIIINP, N-terminal procollagen III; MMP-1, matrix metalloproteinase 1; YKL-40, human cartilage glycoprotein 39; ELF, enhanced liver fibrosis score; ARFI, acoustic radiation force impulse; PLT_spleen ratio, platelet to spleen size ratio; US, ultrasound; US_SAPI, ultrasonographic evaluation of the splenic artery pulsatility index; CI, confidence interval.
A number of mainly indirect NITs reported sensitivities and specificities at dual cutoffs, one high and one low. The low and high cut-off threshold is usually set at 90%-95% of sensitivity and specificity, respectively. We performed separate meta-analyses of low and high cutoffs whenever such cutoffs were reported.
The most commonly evaluated NITs for ≥F2 were APRI (low cutoff), which was evaluated in 47 studies, followed by FibroScan in 37 studies and APRI (high cutoff) in 36 studies. Summary sensitivity and specificity of NITs for diagnosis of ≥F2 is shown in Table3. Overall, only five studies had low risk of bias in all the domains of the QUADAS-2 tool; therefore, all our estimates may be biased. A table of the quality assessment of included studies based on QUADAS-2 is in the Web Appendix (see the Supporting Information).
Economic Modeling
The most cost-effective strategy is to adopt a treat all approach with an ICER of £9,204. This ICER reflects that the treat all strategy has a QALY gain of 0.47 at an additional cost of £4,287, compared to the next-best alternative (FibroSpect and FibroScan) and is within the standard UK threshold range for cost-effectiveness. Table4 displays results of the base-case analysis (second stage of the analyses); for clarity of presentation, only test strategies that were not “dominated” or “extendedly dominated” are shown in the table (see the Web Appendix in the Supporting Information for full table and results of the comparison of NITs evaluated as single tests). The CEAF (Fig. 2) shows that the probability of treat all being cost-effective, given a cost-effectiveness threshold value of £20,000, is 45%.
Table 4.
Base-Case Analysis*
| Test Strategy | Costs (£) | QALYs | Incremental Cost (£) | Incremental QALYs | ICER (£) |
|---|---|---|---|---|---|
| (S4) type IV collagen and PLT spleen | 46,911 | 14.22 | — | — | — |
| FibroSpect and FibroScan | 46,954 | 14.27 | 43 | 0.05 | 928 |
| Treat all | 51,241 | 14.73 | 4,287 | 0.47 | 9,204 |
Second stage of the analysis: comparison of sequential testing strategies, most cost-effective tests from first stage of the analysis, liver biopsy, published algorithms, NIT with a combined cut-off diagnostic threshold, and the treat all and no treatment comparators.
Abbreviation: PLT, platelet.
Figure 2.
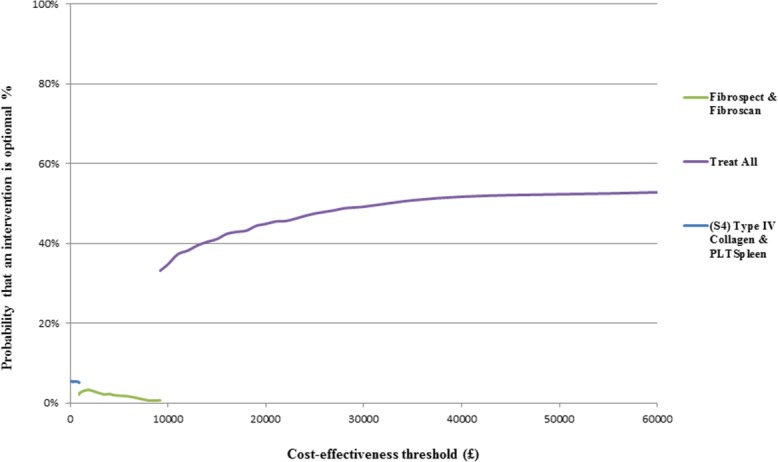
CEAFs showing the probability that treat all is cost-effective, compared to alternatives over a range of values for the maximum acceptable cost-effectiveness threshold value (ceiling ratio λ) for HCV. PLT_Spleen, platelet/spleen size ratio.
Sensitivity Analyses
The base-case analysis result remained robust to the majority of the sensitivity analyses. Analyses that changed the base-case result are detailed below.
Amending the assumption that patients who were treated incorrectly (patients with mild fibrosis [F0-F1] who test FP), benefitted from treatment, changed the base-case results. We reduced the SVR rate (representative of treatment benefit) for these patients by decrements of 10%. When the SVR rate was reduced by more than 23%, treat all was no longer cost-effective. The illustrative graph (see Fig. 2 in the Web Appendix in the Supporting Information) shows the increase in the ICER for treat all as the assumption around treatment benefit for this group of patients is relaxed.
Secondary Analysis
Using only those 14 NITs where the bivariate model for the meta-analysis converged did not change the overall result, and treat all remained cost-effective with an ICER of £8,162.
Exploratory Analyses
The exploratory analysis to assess the possible effect on results of increased costs and effectiveness associated with treatment with Peg-IFN-α-2a, RBV, and SOF found that the base-case analysis results remained the same and treat all was still the most cost-effective strategy to adopt, compared to no treatment or only treating patients ≥F2 with Peg-IFN-α-2a, RBV, and SOF (genotypes 1 and 4) or RBV and SOF (genotypes 2 and 3), though with a higher ICER of £16,028 (full table in the Web Appendix in the Supporting Information).
The exploratory analysis on new treatments found that if SVR rates were 90% for genotypes 1 and 4 and costs increased by £20,000 for all genotypes, the baseline results do not change substantially, with the treat all strategy remaining the most cost-effective strategy with an ICER of £10,009. However, increasing the additional cost by £40,000 increases the ICER for the treat all strategy to £21,174, which would not be cost-effective given a £20,000 threshold. The most cost-effective option in this case would be testing with magnetic resonance elastography (MRE) and treating those patients with ≥F2, with an ICER of £9,189. The incremental treatment cost threshold for the treat all strategy to remain the most cost-effective strategy was determined at £37,500.
Discussion
The results of our economic modeling and analysis indicate that a treat all strategy with currently available drugs is the most cost-effective strategy in patients with CHC in the UK. Given the similar health costs and treatment pathways for CHC in Western countries, it is reasonable to extrapolate that this holds true for most countries in the developed world.
Our meta-analysis of NITs has been the most detailed and extensive to date, including all described serum tests and imaging modalities with no language restrictions and using state-of-the-art statistical and reporting methods. A recent systematic review only included serum tests and did not report on summary sensitivity and specificity, but chose to present median values.22 A striking finding of our meta-analysis was that the vast majority of studies (98%) had high risk of bias and failed in important methodological aspects, such as the absence of predetermined test cutoffs and suboptimal quality of liver biopsy as the reference standard. NITs performed significantly better for the diagnosis of cirrhosis than for lesser fibrosis stages. Indirect serum NITs, such as APRI and FIB-4, fail to classify a significant proportion of patients who fall into the gray zone of indeterminate values. Proprietary serum NITs, with the possible exception of FibroTest, are insufficiently validated in independent cohorts. The increasingly used FibroScan does not have validated cutoffs for specific fibrosis stages.23 Therefore, NITs need better-quality studies and further validation, particularly for the diagnosis of moderate fibrosis.
Our economic analysis revealed that treating all CHC patients without testing for fibrosis stage was the most cost-effective strategy given a cost-effectiveness threshold of £20,000. This result was robust to most of the amendments in the sensitivity analysis. A key driver in the cost-effectiveness results is that patients with mild fibrosis (F0-F1) gain benefit from treatment, albeit at an increased cost. We have performed a threshold analysis to confirm this assumption. For the treat all strategy to cease to be cost-effective, the relative treatment benefit would need to be reduced by only 23%. In addition to mortality and morbidity associated with liver disease, the analysis reflects the risk of death from other causes. This was based on estimates from the UK general population; however, we recognize that, in practice, some patients with CHC may have higher mortality rates. This is likely to underestimate the ICER for the treat all strategy, relative to the comparators.
Previously published models by Wright et al.9 and Liu et al.8 evaluated the cost-effectiveness of alternative treatments for CHC. The results from both studies show that treating all patients irrespective of fibrosis level is cost-effective at UK cost-effectiveness thresholds. The analysis by Wright et al. evaluated early treatment for patients with CHC (all nongenotype 1 patients grouped together). The study by Liu et al. evaluated different treatment strategies, which included the use of an NIT (FibroTest) in genotype 1-3 patients, but did not incorporate its diagnostic accuracy. This model also assumed a linear progression from F0 to the F4 health state and assumed that the costs for the F0-F4 health states were the same. Our study adds substantially to both of these studies. We evaluated more treatments than Wright et al. (IFN-α and RBV and Peg-IFN in a sensitivity analysis) and Liu et al. (Peg-IFN-α, RBV, and TVR) and also performed exploratory analyses for more-potent antiviral treatments. Our model incorporated data on differential rates of disease progression and costs according to different health states. Most important, we evaluated 57 NITs for use in patients with genotype 1-4 CHC and incorporated their diagnostic accuracy and the consequences of TP, FP, FN, and TN results in the Markov model. This makes our approach unique and distinct from previous models.
New antiviral treatments with increased efficacy and lesser side effects for genotypes 1 and 4 will soon be licensed.21 However, the cost-effectiveness of such drugs will depend on their price and robust data on effectiveness. The exploratory analysis presented here shows that a strategy of treat all with Peg-IFN-α-2a, RBV, and SOF would be cost-effective, compared to no treatment or using the NITs to restrict that treatment combination to patients with ≥F2. Given that other treatment combinations are available, the cost-effectiveness of SOF needs to be assessed, relative to currently standard treatments. The exploratory analysis on other treatments showed that treat all would be cost-effective if the overall increase in treatment costs is up to approximately £37,500, but not above. In the latter case, a strategy of NIT and treatment of patients with ≥F2 is the most cost-effective strategy. This is of particular importance, because the pricing of new antiviral therapies is not yet known and relative effectiveness is not fully established. Although the estimates on diagnostic accuracy of NITs carry a high risk of bias, our data indicate that if treatment costs increase beyond a certain point, then testing with NITs of a defined sensitivity, specificity, and cost will be the most cost-effective strategy.
Our economic modeling was performed from the perspective of an economy of a developed country, and therefore its findings cannot be extrapolated to the developing world. This would require a separate analysis with the use of different utilities and costs, such as the one recently performed in Egypt.24 The emergence of population screening strategies for HCV infection, as recently recommended in the United States,25 will result in further increases in health care costs. If the detection rates increase significantly, even cost-effective strategies might not be realistic in certain health care systems. We assumed that NITs used sequentially were independent of one another. Although this assumption did not influence the results, it has not been sufficiently tested. We have based the model on SVR being a valid surrogate outcome and that there are no long-term adverse events related to protease inhibitors as in previous economic models.26 Our conclusions will change if the above is not true.
In conclusion, we have shown that treating all adult patients with CHC, irrespective of fibrosis stage, is the most cost-effective strategy with current standard treatments in developed countries. Licensing of more-potent and expensive antiviral treatment, such as SOF, does appear to be cost-effective given the current price; however, more costly combinations could change these findings. Further analyses of such treatments are required to determine their cost-effectiveness. Because studies of NITs had a high risk of bias, better-quality data are urgently needed to validate their reported diagnostic accuracy.
Glossary
- AEs
adverse events
- APRI
aspartate transaminase to platelets ratio index
- BOC
boceprevir
- CEAFs
cost-effectiveness acceptability frontiers
- CHC
chronic hepatitis C
- FN
false negative
- FP
false positive
- HCC
hepatocellular carcinoma
- HCV
hepatitis C virus
- HTA
Health Technology Assessment
- ICER
incremental cost-effectiveness ratio
- IFN
interferon
- LT
liver transplantation
- MRE
magnetic resonance elastography
- NICE
National Institute for Health and Clinical Excellence
- NITs
noninvasive tests
- Peg-IFN
pegylated IFN
- PA
probabilistic sensitivity analysis
- QALYs
quality-adjusted life-years
- RBV
ribavirin
- SOF
sofosbuvir
- SVR
sustained virological response
- TN
true negative
- TP
true positive
- TT
triple therapy
- TVR
telaprevir
Supporting Information
Additional Supporting Information may be found in the online version of this article at the publisher's website.
Supplementary Information
References
- 1.Poynard T, Bedossa P, Opolon P. Natural history of liver fibrosis progression in patients with chronic hepatitis C. The OBSVIRC, METAVIR, CLINIVIR, and DOSVIRC groups. Lancet. 1997;349:825–832. doi: 10.1016/s0140-6736(96)07642-8. [DOI] [PubMed] [Google Scholar]
- 2.European Association for the Study of the Liver. EASL Clinical Practice Guidelines: management of hepatitis C virus infection. J Hepatol. 2011;55:245–264. doi: 10.1016/j.jhep.2011.02.023. [DOI] [PubMed] [Google Scholar]
- 3.Afdhal NH, Lok AS, Di Bisceglie AM. Clinical decisions. Management of incidental hepatitis C virus infection. N Engl J Med. 2009;360:1902–1906. doi: 10.1056/NEJMclde0900131. [DOI] [PubMed] [Google Scholar]
- 4.Martinez SM, Crespo G, Navasa M, Forns X. Noninvasive assessment of liver fibrosis. Hepatology. 2011;53:325–335. doi: 10.1002/hep.24013. [DOI] [PubMed] [Google Scholar]
- 5.Whiting PF, Rutjes AW, Westwood ME, Mallett S, Deeks JJ, Reitsma JB, et al. QUADAS-2: a revised tool for the quality assessment of diagnostic accuracy studies. Ann Intern Med. 2011;155:529–536. doi: 10.7326/0003-4819-155-8-201110180-00009. [DOI] [PubMed] [Google Scholar]
- 6.Reitsma JB, Glas AS, Rutjes AW, Scholten RJ, Bossuyt PM, Zwinderman AH. Bivariate analysis of sensitivity and specificity produces informative summary measures in diagnostic reviews. J Clin Epidemiol. 2005;58:982–990. doi: 10.1016/j.jclinepi.2005.02.022. [DOI] [PubMed] [Google Scholar]
- 7.Takwoingi Y, Deeks JJ. MetaDAS: a SAS macro for meta-analysis of diagnostic accuracy studies. USER Guide Version 1.3. 2012. Available from: http://srdtacochraneorg/sites/srdtacochraneorg/files/uploads/MetaDAS Readme v13 May 2012 pdf. Accessed October 25,
- 8.Liu S, Schwarzinger M, Carrat F, Goldhaber-Fiebert JD. Cost effectiveness of fibrosis assessment prior to treatment for chronic hepatitis C patients. PLoS ONE. 2011;6:e26783. doi: 10.1371/journal.pone.0026783. [DOI] [PMC free article] [PubMed] [Google Scholar]
- 9.Wright M, Grieve R, Roberts J, Main J, Thomas HC, Alexander G, et al. Health benefits of antiviral therapy for mild chronic hepatitis C: randomized controlled trial and economic evaluation. Health Technol Assess. 2006;10:iii–93. doi: 10.3310/hta10210. [DOI] [PubMed] [Google Scholar]
- 10.van der Meer AJ, Hansen BE, Fattovich G, Feld JJ, Wedemeyer H, Dufour JF, et al. Reliable prediction of clinical outcome in patients with chronic HCV infection and compensated advanced hepatic fibrosis: a validated model using objective and readily available clinical parameters. Gut. 2014 doi: 10.1136/gutjnl-2013-305357. May 9. doi: 10.1136/gutjnl-2013-305357. [Epub ahead of print] [DOI] [PubMed] [Google Scholar]
- 11.National Institute for Health and Clinical Excellence (NICE) Guide to the Methods of Technology Appraisal. London: NICE; 2013. [PubMed] [Google Scholar]
- 12.National Institute for Health and Clinical Excellence (NICE) NICE Technology Appraisal Guidance 106. London: NICE; 2007. Peginterferon alfa and ribavirin for the treatment of mild chronic hepatitis C. [Google Scholar]
- 13.National Institute for Health and Clinical Excellence (NICE) Technology Appraisal Guidance 253. London: NICE; 2012. Boceprevir for the treatment of genotype 1 chronic hepatitis C. [Google Scholar]
- 14.National Institute for Health and Clinical Excellence (NICE) NICE Technology Appraisal Guidance 252. NICE; 2012. Telaprevir for the treatment of genotype 1 chronic hepatitis C. [Google Scholar]
- 15.National Institute for Health and Clinical Excellence (NICE) Part Review of NICE Technology Appraisal Guidance 75 and 106. London: NICE; 2010. Peginterferon alfa and ribavirin for the treatment of chronic hepatitis C. [Google Scholar]
- 16.Brooks R. EuroQol: the current state of play. Health Policy. 1996;37:53–72. doi: 10.1016/0168-8510(96)00822-6. [DOI] [PubMed] [Google Scholar]
- 17.Longworth L, Young T, Buxton MJ, Ratcliffe J, Neuberger J, Burroughs A, Bryan S. Midterm cost-effectiveness of the liver transplantation program of England and Wales for three disease groups. Liver Transpl. 2003;9:1295–1307. doi: 10.1016/j.lts.2003.09.012. [DOI] [PubMed] [Google Scholar]
- 18.Drummond M, O'Brien BJ, Stoddart GL, Torrance GW. Methods for the Economic Evaluation of Health Care Programmes. Oxford, UK: Oxford University Press; 1997. [Google Scholar]
- 19.Fenwick E, Claxton K, Sculpher M. Representing uncertainty: The role of cost-effectiveness acceptability curves. Health Econ. 2001;10:779–787. doi: 10.1002/hec.635. [DOI] [PubMed] [Google Scholar]
- 20.Shepherd J, Brodin H, Cave C, Waugh N, Price A, Gabbay J. Pegylated interferon α-2a and −2b in combination with ribavirin in the treatment of chronic hepatitis C: A systematic review and economic evaluation. Health Technol Assess. 2004;8:iii–iv. doi: 10.3310/hta8390. 1-125. [DOI] [PubMed] [Google Scholar]
- 21.Lawitz E, Mangia A, Wyles D, Rodriguez-Torres M, Hassanein T, Gordon SC, et al. Sofosbuvir for previously untreated chronic hepatitis C infection. N Engl J Med. 2013;368:1878–1887. doi: 10.1056/NEJMoa1214853. [DOI] [PubMed] [Google Scholar]
- 22.Chou R, Wasson N. Blood tests to diagnose fibrosis or cirrhosis in patients with chronic hepatitis C virus infection: a systematic review. Ann Intern Med. 2013;158:807–820. doi: 10.7326/0003-4819-158-11-201306040-00005. [DOI] [PubMed] [Google Scholar]
- 23.Tsochatzis EA, Gurusamy KS, Ntaoula S, Cholongitas E, Davidson BR, Burroughs AK. Elastography for the diagnosis of severity of fibrosis in chronic liver disease: a meta-analysis of diagnostic accuracy. J Hepatol. 2011;54:650–659. doi: 10.1016/j.jhep.2010.07.033. [DOI] [PubMed] [Google Scholar]
- 24.Deuffic-Burban S, Schwarzinger M, Mallet V, Pol S, Pageaux GP, Canva-Delcambre V, et al. Immediate or delayed treatment initiation with “Previr” containing regimens in HCV-infected naive genotype 1 (G1) patients without severe fibrosis? A cost effectiveness analysis (ANRS No 12188) J Hepatol. 2013;58(Suppl. 1):S331. [Google Scholar]
- 25.Smith BD, Morgan RL, Beckett GA, Falck-Ytter Y, Holtzman D, Ward JW. Hepatitis C virus testing of persons born during 1945-1965: recommendations from the Centers for Disease Control and Prevention. Ann Intern Med. 2012;157:817–822. doi: 10.7326/0003-4819-157-9-201211060-00529. [DOI] [PMC free article] [PubMed] [Google Scholar]
- 26.van der Meer AJ, Wedemeyer H, Feld JJ, Hansen BE, Manns MP, Zeuzem S, Janssen HL. Is there sufficient evidence to recommend antiviral therapy in hepatitis C? J Hepatol. 2014;60:191–196. doi: 10.1016/j.jhep.2013.07.043. [DOI] [PubMed] [Google Scholar]
- 27.Wright M, Grieve R, Roberts J, Main J, Thomas HC. Health benefits of antiviral therapy for mild chronic hepatitis C: randomised controlled trial and economic evaluation. Health Technol Assess. 2006;10:1–113, iii. doi: 10.3310/hta10210. [DOI] [PubMed] [Google Scholar]
- 28.Fried MW, Shiffman ML, Rajender Reddy K, Smith C, Marinos G, Gonçales FL, Jr, et al. Peginterferon alfa-2a plus ribavirin for chronic hepatitis C virus infection. N Engl J Med. 2002;347:975–982. doi: 10.1056/NEJMoa020047. [DOI] [PubMed] [Google Scholar]
- 29.Manns MP, Wedemeyer H, Cornberg M. Treating viral hepatitis C: efficacy, side effects, and complications. Gut. 2006;55:1350–1359. doi: 10.1136/gut.2005.076646. [DOI] [PMC free article] [PubMed] [Google Scholar]
- 30.Kamal SM, El Tawil AA, Nakano T, He Q, Rasenack J, Hakam SA, et al. Peginterferon α-2b and ribavirin therapy in chronic hepatitis C genotype 4: impact of treatment duration and viral kinetics on sustained virological response. Gut. 2005;54:858–866. doi: 10.1136/gut.2004.057182. [DOI] [PMC free article] [PubMed] [Google Scholar]
- 31.Grishchenko M, Grieve RD, Sweeting MJ, De Angelis D, Thomson BJ, Ryder SD, Irving WL. Cost-effectiveness of pegylated interferon and ribavirin for patients with chronic hepatitis C treated in routine clinical practice. Int J Technol Assess Health Care. 2009;25:171–180. doi: 10.1017/S0266462309090229. [DOI] [PubMed] [Google Scholar]
Associated Data
This section collects any data citations, data availability statements, or supplementary materials included in this article.
Supplementary Materials
Supplementary Information